| Param | Original file | Final file |
|---|---|---|
| Filename | modeM0/AS1A05_188T01_9000003018_20436cztM0_level2.evt | modeM0/AS1A05_188T01_9000003018_20436cztM0_level2_quad_clean.evt |
| Size (bytes) | 445,104,000 | 86,284,800 |
| Size | 424.5 MB | 82.3 MB |
| Events in quadrant A | 3,174,872 | 556,034 |
| Events in quadrant B | 3,328,824 | 568,437 |
| Events in quadrant C | 3,209,677 | 534,065 |
| Events in quadrant D | 3,342,455 | 518,495 |
| Mode SS | |||
|---|---|---|---|
| Quadrant | BADHDUFLAG | Total packets | Discarded packets |
| A | 0 | 128 | 0 |
| B | 0 | 128 | 0 |
| C | 0 | 128 | 0 |
| D | 0 | 128 | 0 |
| Mode M9 | |||
|---|---|---|---|
| Quadrant | BADHDUFLAG | Total packets | Discarded packets |
| A | 0 | 18 | 0 |
| B | 0 | 19 | 0 |
| C | 0 | 19 | 0 |
| D | 0 | 19 | 0 |
| Mode M0 | |||
|---|---|---|---|
| Quadrant | BADHDUFLAG | Total packets | Discarded packets |
| A | 0 | 13302 | 2 |
| B | 0 | 13715 | 2 |
| C | 0 | 13313 | 2 |
| D | 0 | 13970 | 2 |
| Quadrant | Total seconds | Saturated seconds | Saturation percentage |
|---|---|---|---|
| A | 6240 | 36 | 0.576923% |
| B | 6240 | 51 | 0.817308% |
| C | 6240 | 53 | 0.849359% |
| D | 6240 | 60 | 0.961538% |
Noise dominated data is calculated using 1-second bins in cleaned event files. If a bin has >2000 counts, and if more than 50% of those come from <1% of pixels, then it is considered to be noise-dominated and hence unusable.
| Quadrant | # 1 sec bins | Bins with >0 counts | Bins with >2000 counts | High rate bins dominated by noise | Noise dominated (total time) | Noise dominated (detector-on time) | Marked lightcurve |
|---|---|---|---|---|---|---|---|
| A | 7510 | 6240 | 0 | 0 | 0.00% | 0.00% | 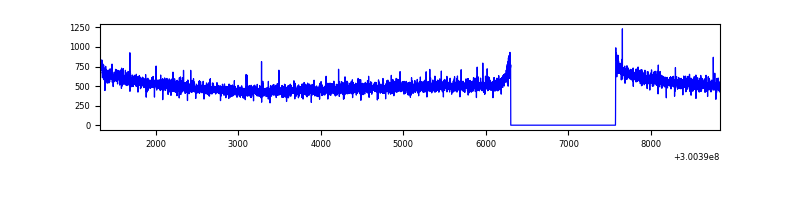 |
| B | 7510 | 6241 | 4 | 4 | 0.05% | 0.06% | 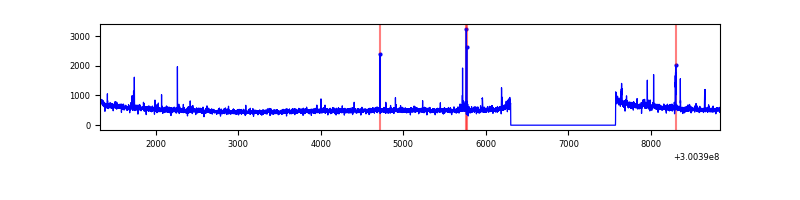 |
| C | 7510 | 6241 | 0 | 0 | 0.00% | 0.00% | 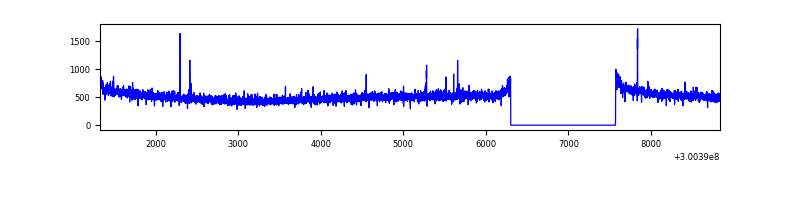 |
| D | 7510 | 6241 | 34 | 34 | 0.45% | 0.54% | 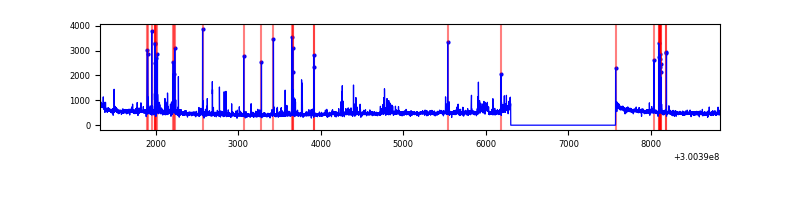 |
Top three noisy pixels from each quadrant. If the there are fewer than three noisy pixels in the level2.evt file, extra rows are filled as -1
| Pixel properties | Quadrant properties | ||||||
|---|---|---|---|---|---|---|---|
| Quadrant | DetID | PixID | Counts | Sigma | Mean | Median | Sigma |
| A | 0 | 226 | 7299 | 39.95 | 824 | 811 | 162.4 |
| A | 3 | 137 | 6422 | 34.55 | 824 | 811 | 162.4 |
| A | 12 | 194 | 5856 | 31.07 | 824 | 811 | 162.4 |
| B | 10 | 245 | 47859 | 309.6 | 822 | 805 | 152.0 |
| B | 12 | 111 | 18029 | 113.33 | 822 | 805 | 152.0 |
| B | 0 | 189 | 17706 | 111.2 | 822 | 805 | 152.0 |
| C | 14 | 238 | 126738 | 704.57 | 778 | 783 | 178.8 |
| C | 3 | 247 | 47288 | 260.14 | 778 | 783 | 178.8 |
| C | 13 | 61 | 5565 | 26.75 | 778 | 783 | 178.8 |
| D | 1 | 52 | 254001 | 1350.07 | 783 | 762 | 187.6 |
| D | 13 | 153 | 88517 | 467.84 | 783 | 762 | 187.6 |
| D | 7 | 96 | 40832 | 213.62 | 783 | 762 | 187.6 |
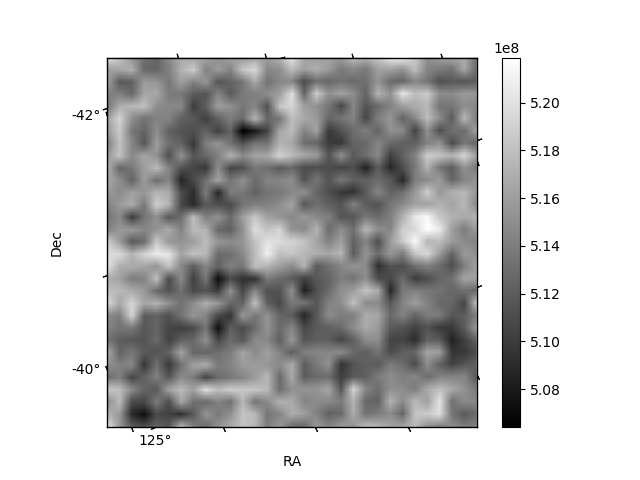
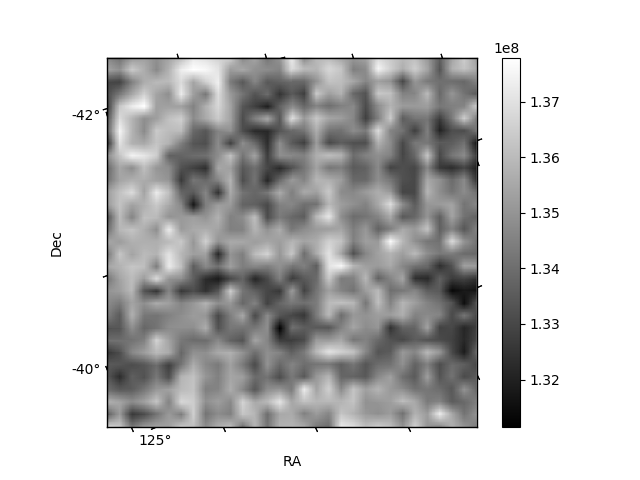
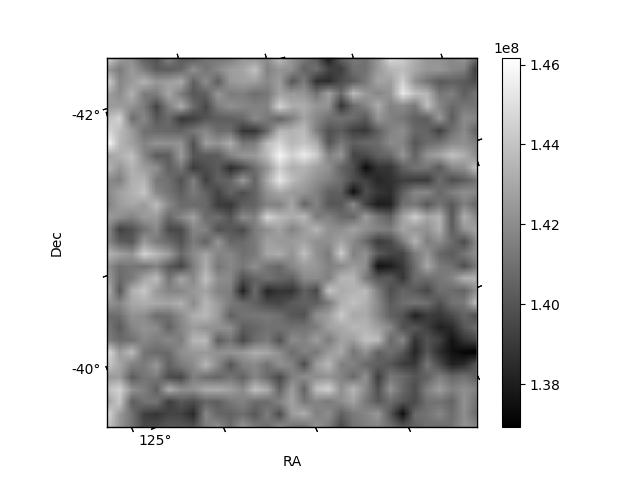
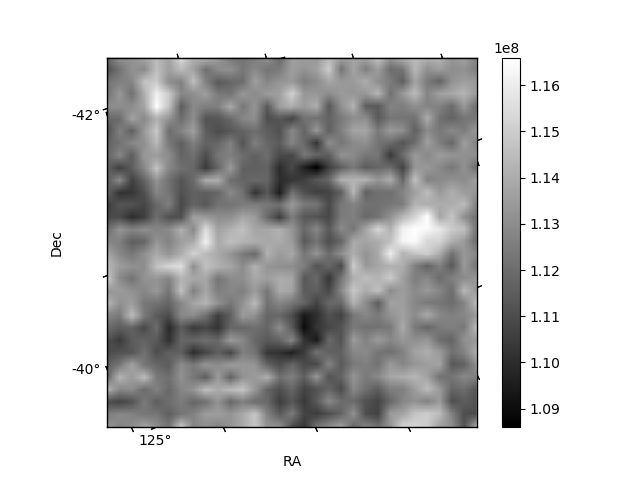
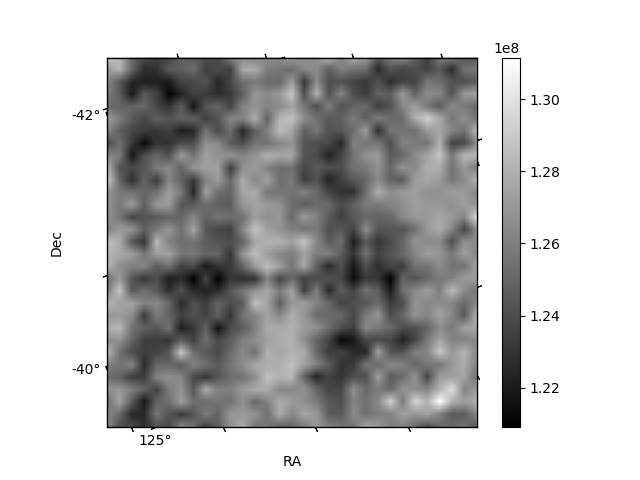
Histogram calculated using DETX and DETY for each event in the final _common_clean file
| Quadrant A | 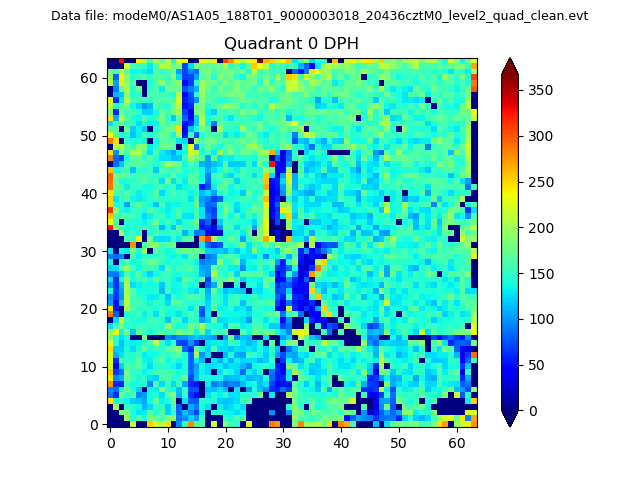 |
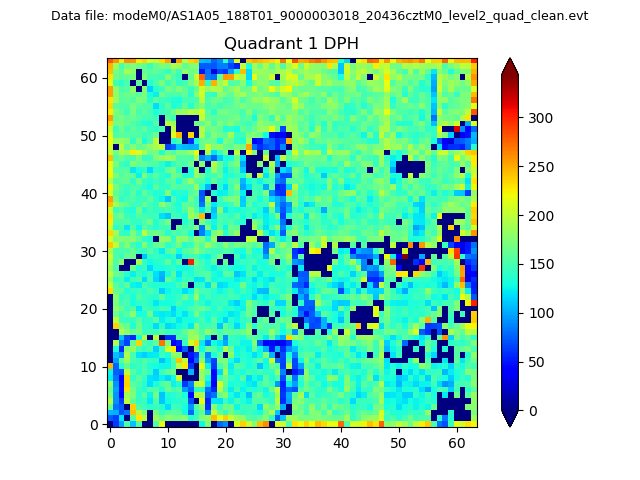 |
Quadrant B |
|---|---|---|---|
| Quadrant D |  |
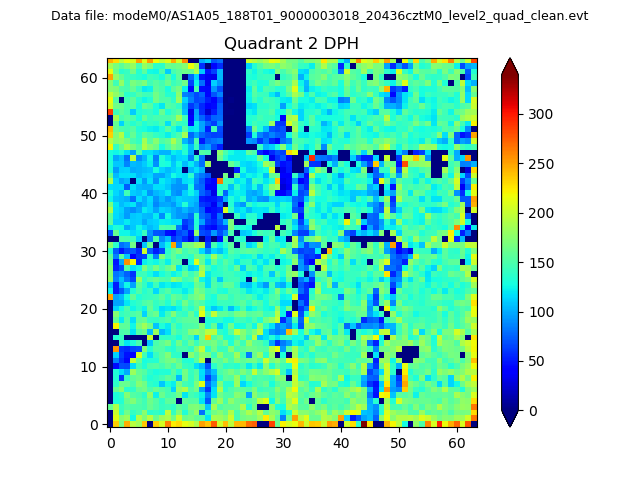 |
Quadrant C |
| Plot type | Count rate plots | Images |
|---|---|---|
| Comparison with Poisson distribution Blue bars denote a histogram of data divided into 1 sec bins. Red curve is a Poisson curve with rate = median count rate of data. |
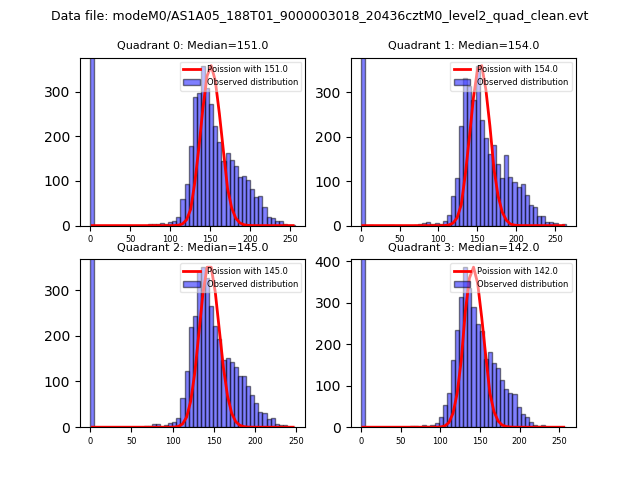 |
 |
| Quadrant-wise count rates Data is divided into 100 sec bins |
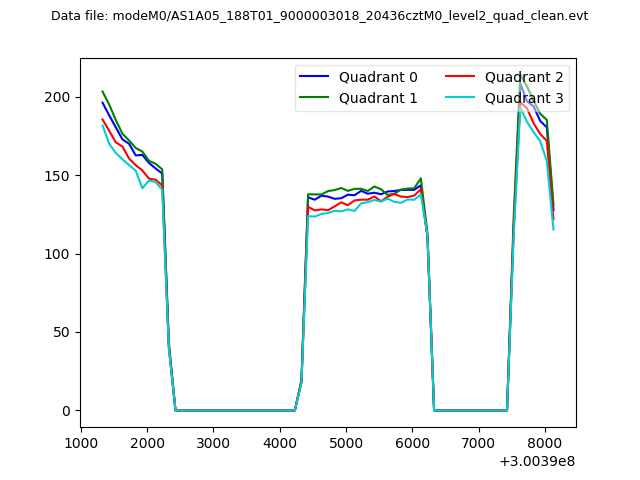 |
|
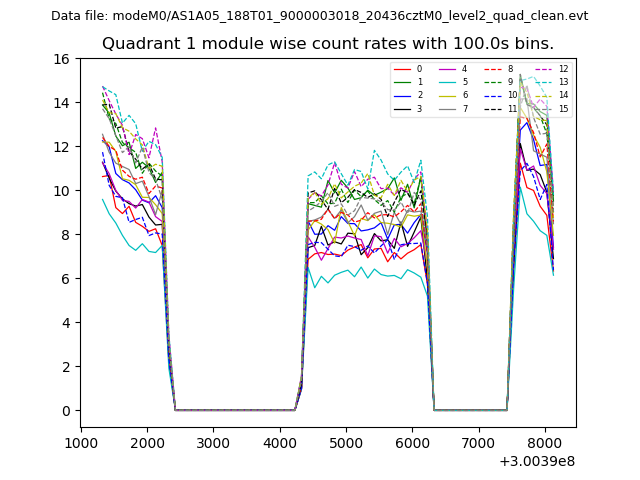
| Module-wise count rates for Quadrant A Data is divided into 100 sec bins |
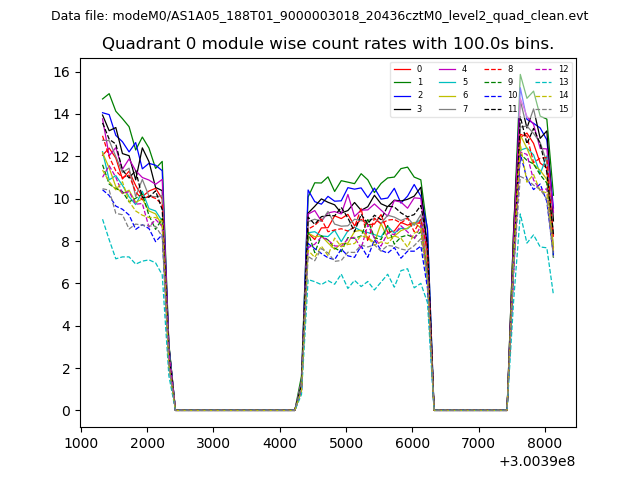 |
 |
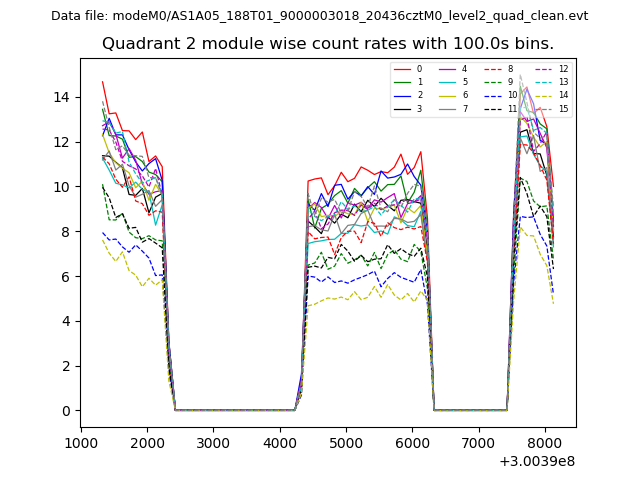
| Module-wise count rates for Quadrant B Data is divided into 100 sec bins |
 |
 |
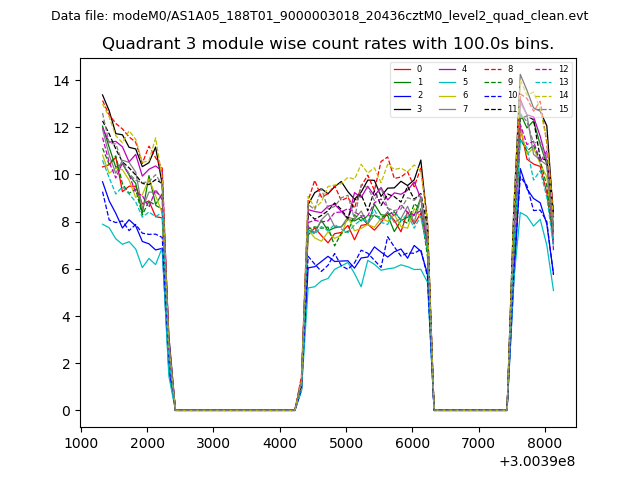
| Module-wise count rates for Quadrant C Data is divided into 100 sec bins |
 |
 |
| Module-wise count rates for Quadrant D Data is divided into 100 sec bins |
 |
 |
| Parameter | Plot |
|---|---|
| CZT HV Monitor | 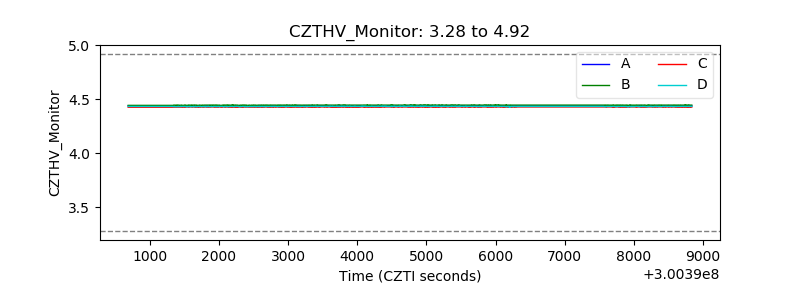 |
| D_VDD | 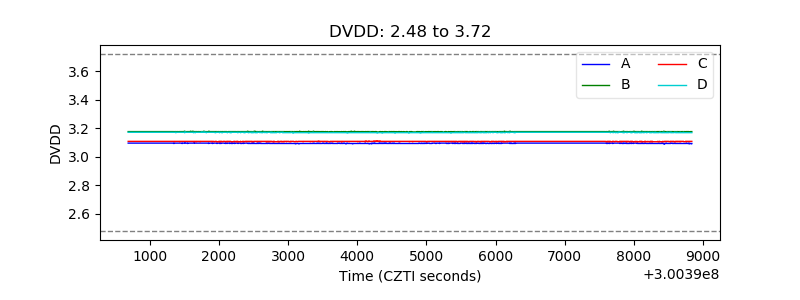 |
| Temperature 1 | 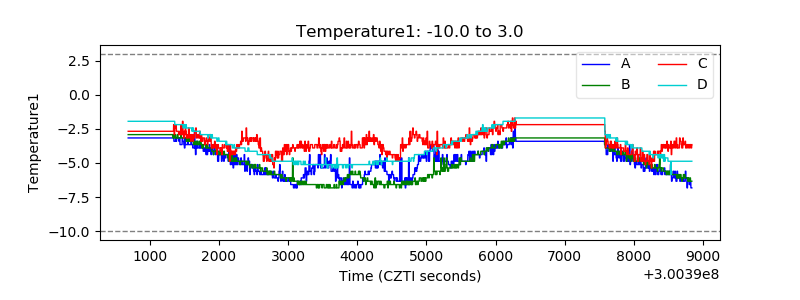 |
| Veto HV Monitor | 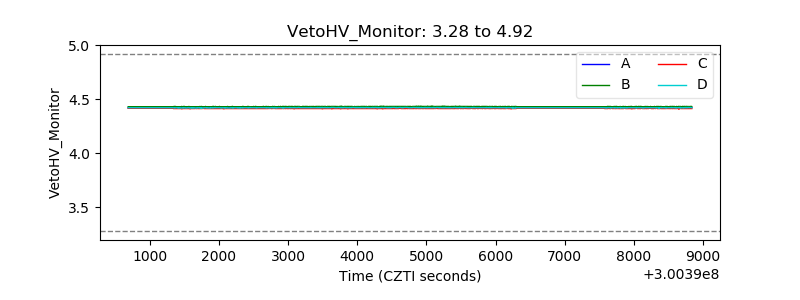 |
| Veto LLD | 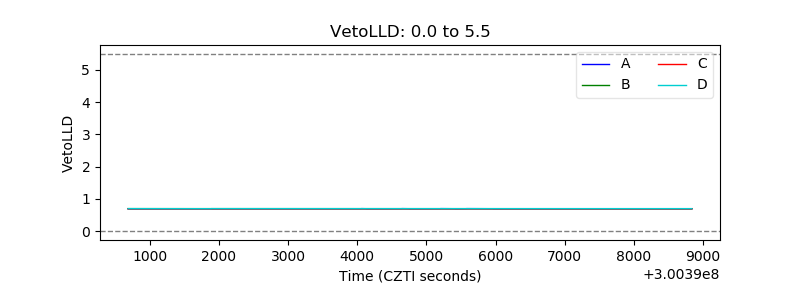 |
| Alpha Counter | 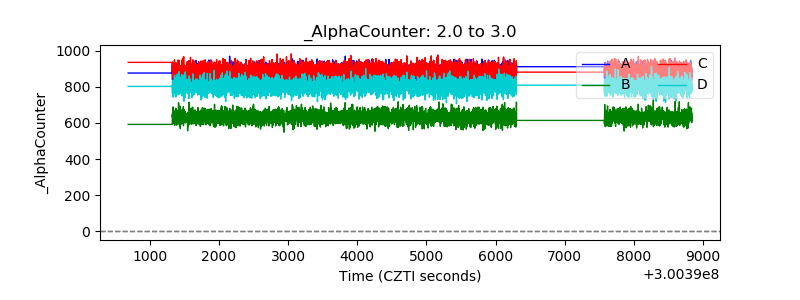 |
| _CPM_Rate | 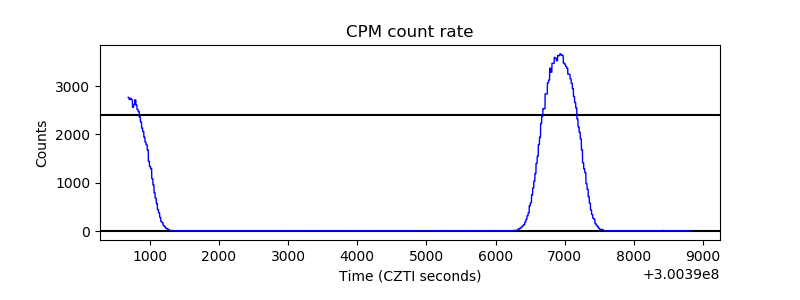 |
| CZT Counter | 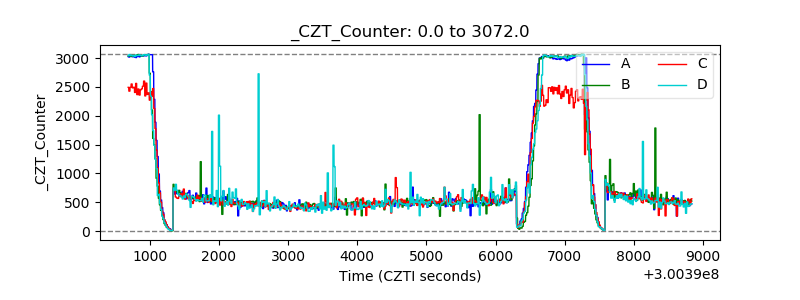 |
| +2.5 Volts monitor |  |
| +5 Volts monitor |  |
| _ROLL_ROT | 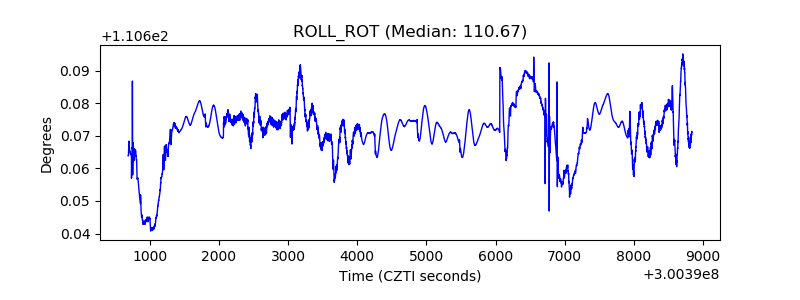 |
| _Roll_DEC | 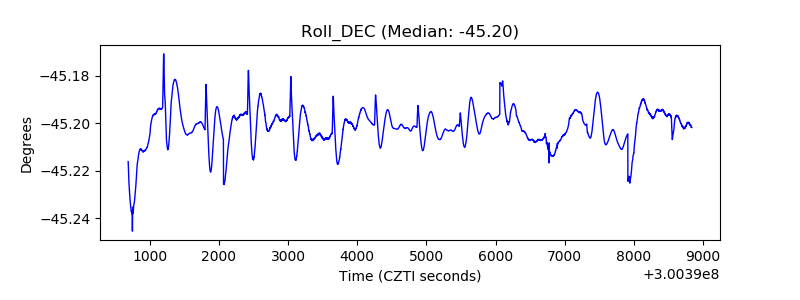 |
| _Roll_RA | 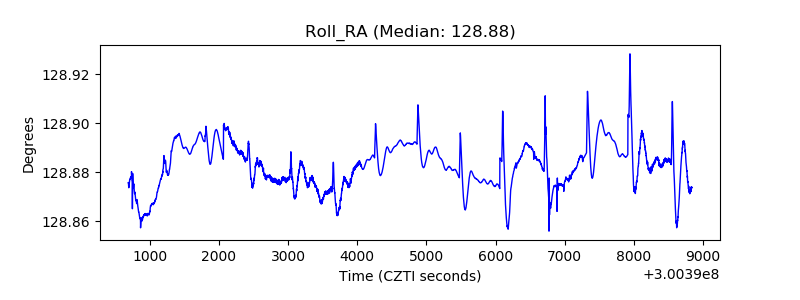 |
| Veto Counter | 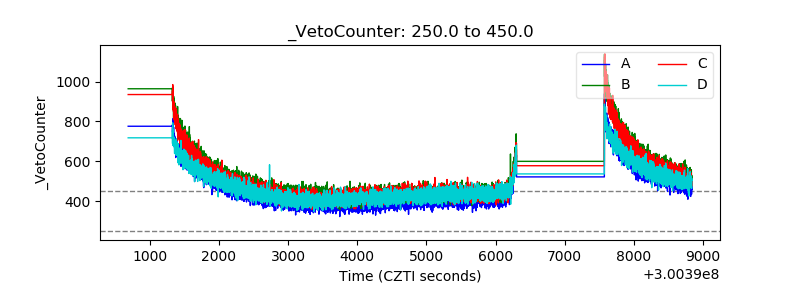 |