| Param | Original file | Final file |
|---|---|---|
| Filename | modeM0/AS1A05_188T01_9000003018_20437cztM0_level2.evt | modeM0/AS1A05_188T01_9000003018_20437cztM0_level2_quad_clean.evt |
| Size (bytes) | 453,539,520 | 76,826,880 |
| Size | 432.5 MB | 73.3 MB |
| Events in quadrant A | 3,251,402 | 484,971 |
| Events in quadrant B | 3,377,510 | 495,842 |
| Events in quadrant C | 3,304,151 | 465,522 |
| Events in quadrant D | 3,384,520 | 450,374 |
| Mode SS | |||
|---|---|---|---|
| Quadrant | BADHDUFLAG | Total packets | Discarded packets |
| A | 0 | 126 | 0 |
| B | 0 | 126 | 0 |
| C | 0 | 126 | 0 |
| D | 0 | 126 | 0 |
| Mode M9 | |||
|---|---|---|---|
| Quadrant | BADHDUFLAG | Total packets | Discarded packets |
| A | 0 | 22 | 0 |
| B | 0 | 23 | 0 |
| C | 0 | 23 | 0 |
| D | 0 | 23 | 0 |
| Mode M0 | |||
|---|---|---|---|
| Quadrant | BADHDUFLAG | Total packets | Discarded packets |
| A | 0 | 13301 | 2 |
| B | 0 | 13671 | 2 |
| C | 0 | 13366 | 2 |
| D | 0 | 13831 | 3 |
| Quadrant | Total seconds | Saturated seconds | Saturation percentage |
|---|---|---|---|
| A | 6152 | 33 | 0.536411% |
| B | 6152 | 31 | 0.503901% |
| C | 6152 | 50 | 0.812744% |
| D | 6151 | 63 | 1.024224% |
Noise dominated data is calculated using 1-second bins in cleaned event files. If a bin has >2000 counts, and if more than 50% of those come from <1% of pixels, then it is considered to be noise-dominated and hence unusable.
| Quadrant | # 1 sec bins | Bins with >0 counts | Bins with >2000 counts | High rate bins dominated by noise | Noise dominated (total time) | Noise dominated (detector-on time) | Marked lightcurve |
|---|---|---|---|---|---|---|---|
| A | 7532 | 6152 | 0 | 0 | 0.00% | 0.00% | 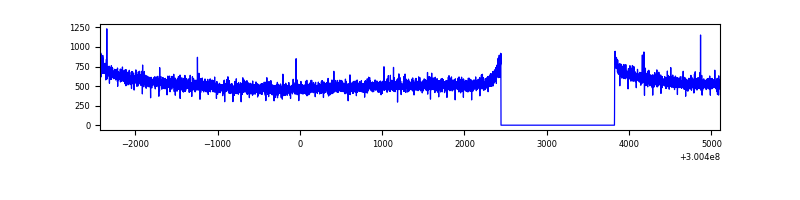 |
| B | 7532 | 6153 | 2 | 2 | 0.03% | 0.03% | 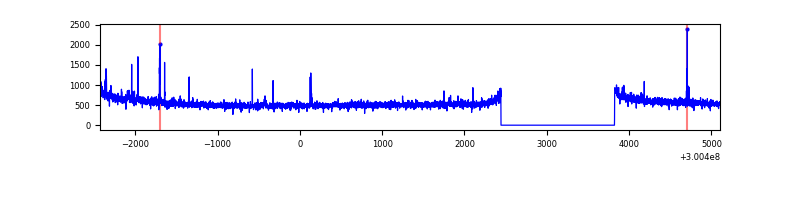 |
| C | 7532 | 6153 | 3 | 3 | 0.04% | 0.05% | 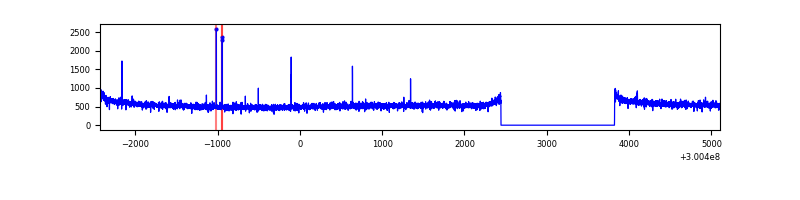 |
| D | 7531 | 6152 | 52 | 52 | 0.69% | 0.85% | 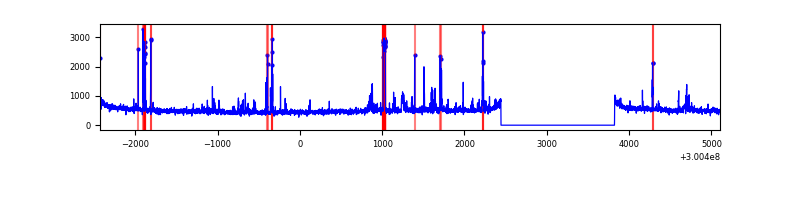 |
Top three noisy pixels from each quadrant. If the there are fewer than three noisy pixels in the level2.evt file, extra rows are filled as -1
| Pixel properties | Quadrant properties | ||||||
|---|---|---|---|---|---|---|---|
| Quadrant | DetID | PixID | Counts | Sigma | Mean | Median | Sigma |
| A | 0 | 226 | 7458 | 40.08 | 845 | 833 | 165.3 |
| A | 3 | 137 | 6530 | 34.46 | 845 | 833 | 165.3 |
| A | 12 | 194 | 5781 | 29.93 | 845 | 833 | 165.3 |
| B | 10 | 245 | 30064 | 189.78 | 844 | 828 | 154.0 |
| B | 12 | 111 | 18122 | 112.26 | 844 | 828 | 154.0 |
| B | 11 | 111 | 16017 | 98.6 | 844 | 828 | 154.0 |
| C | 14 | 238 | 131566 | 717.67 | 798 | 806 | 182.2 |
| C | 3 | 247 | 47730 | 257.54 | 798 | 806 | 182.2 |
| C | 3 | 233 | 8882 | 44.32 | 798 | 806 | 182.2 |
| D | 7 | 96 | 177295 | 924.87 | 800 | 778 | 190.9 |
| D | 1 | 52 | 172069 | 897.49 | 800 | 778 | 190.9 |
| D | 2 | 234 | 26047 | 132.4 | 800 | 778 | 190.9 |
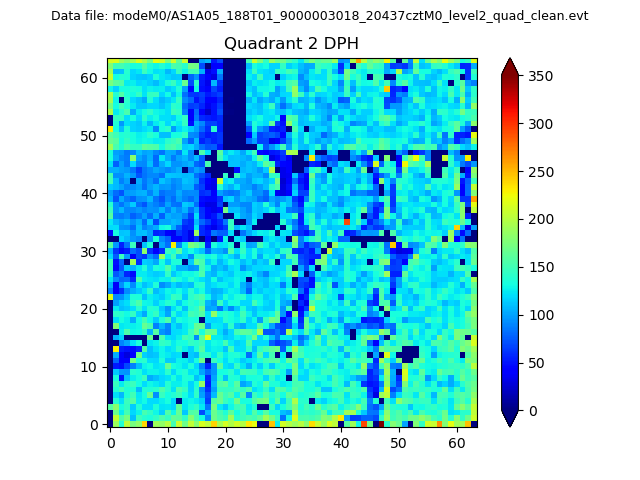
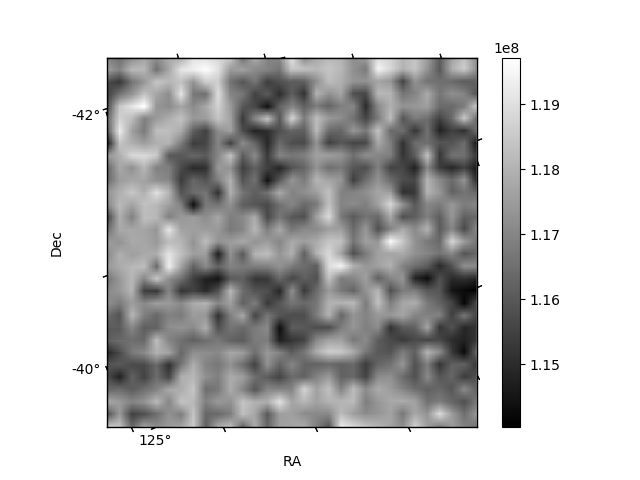
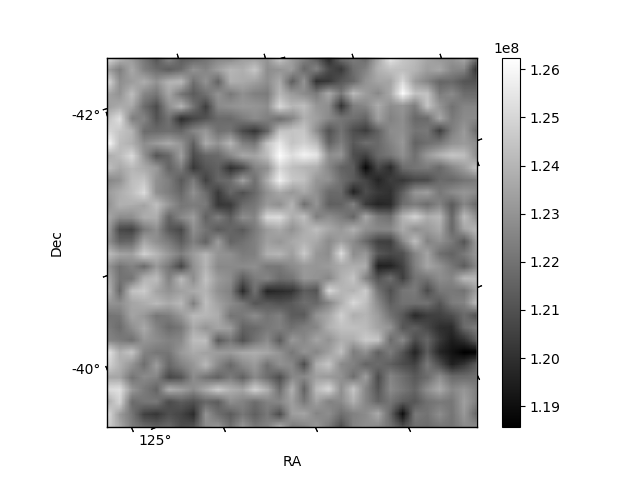
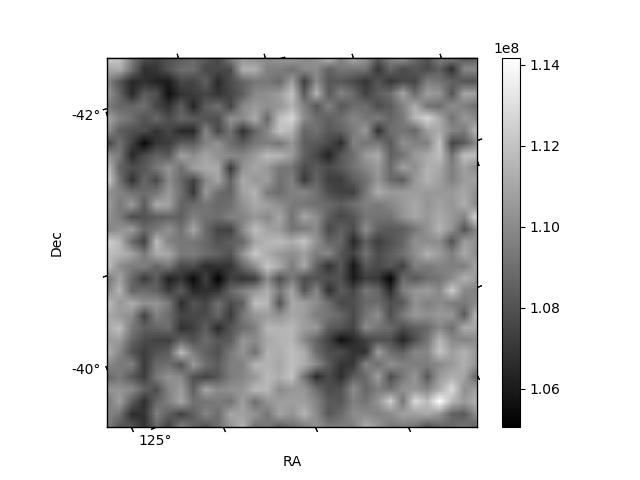
Histogram calculated using DETX and DETY for each event in the final _common_clean file
| Quadrant A |  |
 |
Quadrant B |
|---|---|---|---|
| Quadrant D | 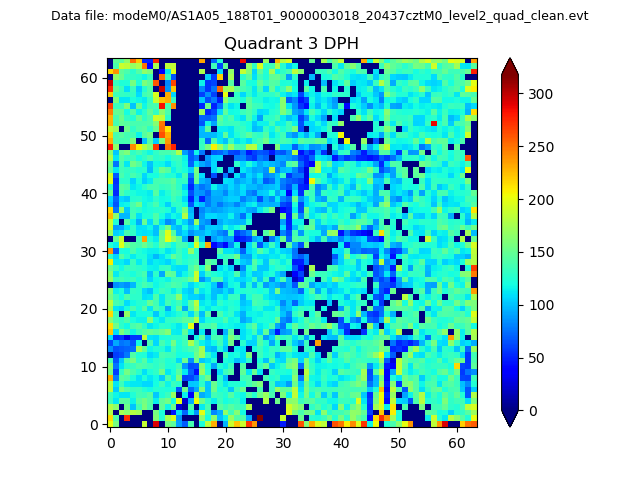 |
 |
Quadrant C |
| Plot type | Count rate plots | Images |
|---|---|---|
| Comparison with Poisson distribution Blue bars denote a histogram of data divided into 1 sec bins. Red curve is a Poisson curve with rate = median count rate of data. |
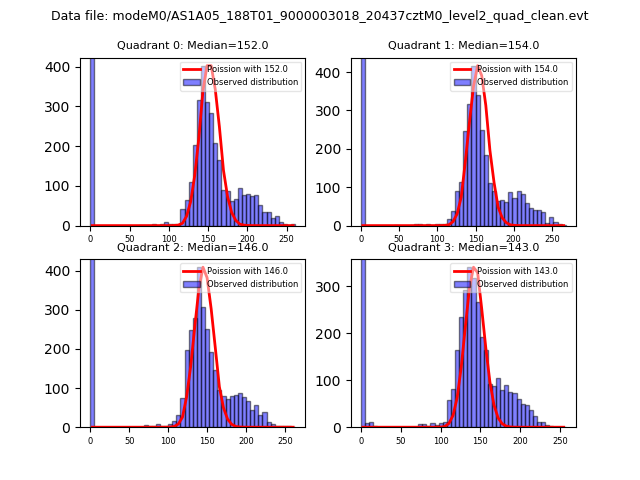 |
 |
| Quadrant-wise count rates Data is divided into 100 sec bins |
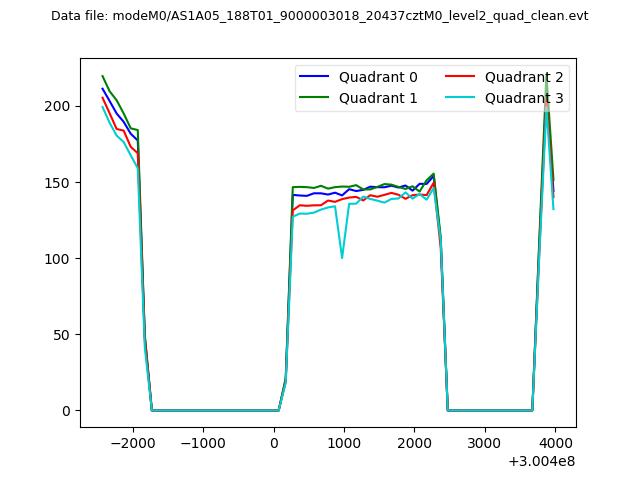 |
|
| Module-wise count rates for Quadrant A Data is divided into 100 sec bins |
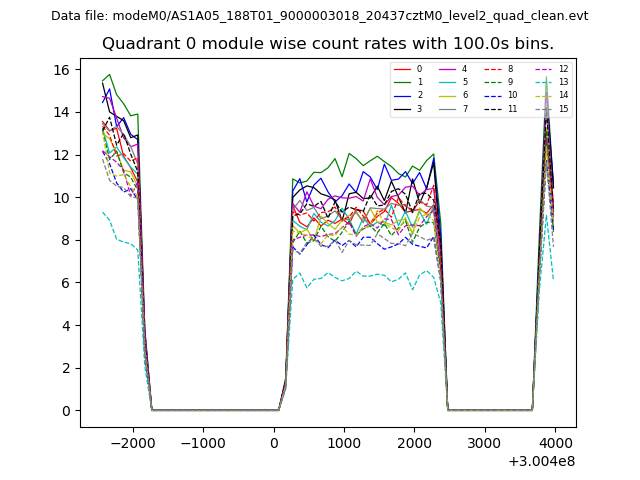 |
 |
| Module-wise count rates for Quadrant B Data is divided into 100 sec bins |
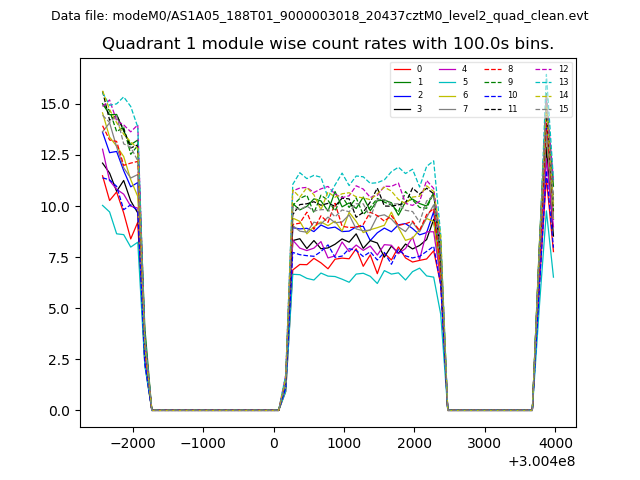 |
 |
| Module-wise count rates for Quadrant C Data is divided into 100 sec bins |
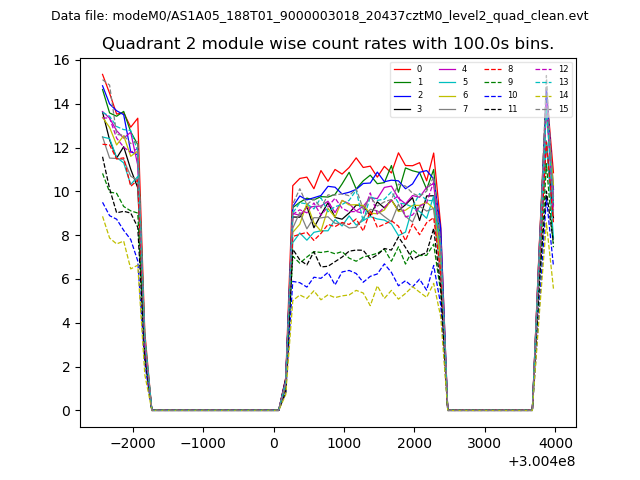 |
 |
| Module-wise count rates for Quadrant D Data is divided into 100 sec bins |
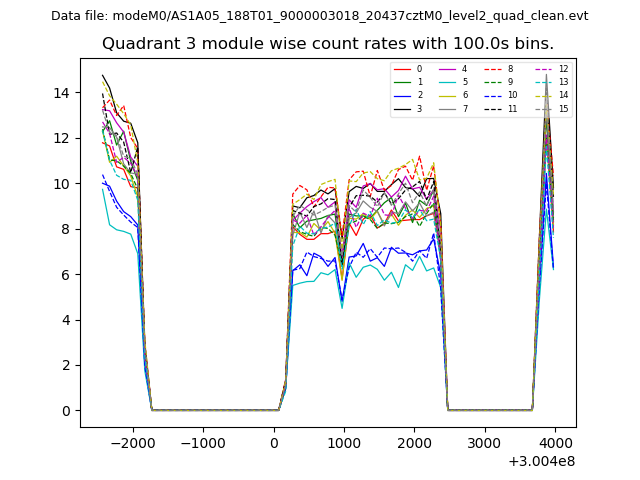 |
 |
| Parameter | Plot |
|---|---|
| CZT HV Monitor | 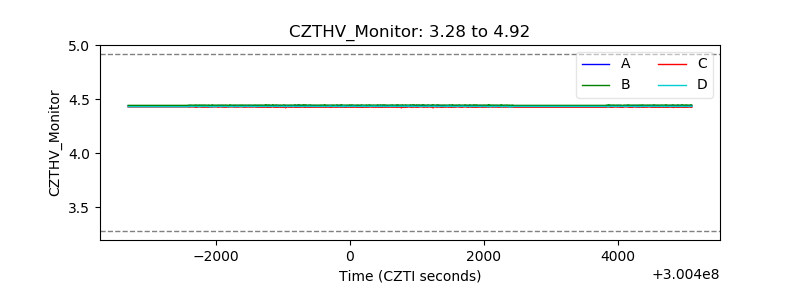 |
| D_VDD | 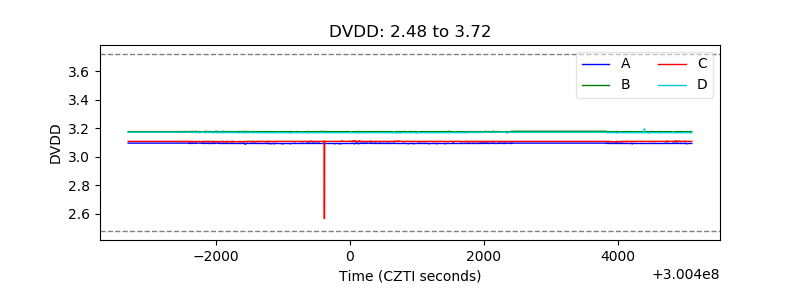 |
| Temperature 1 | 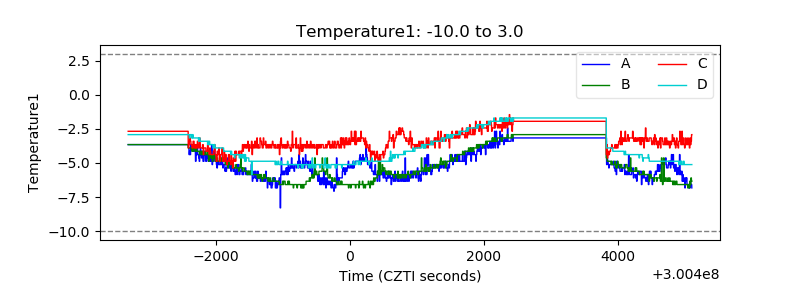 |
| Veto HV Monitor | 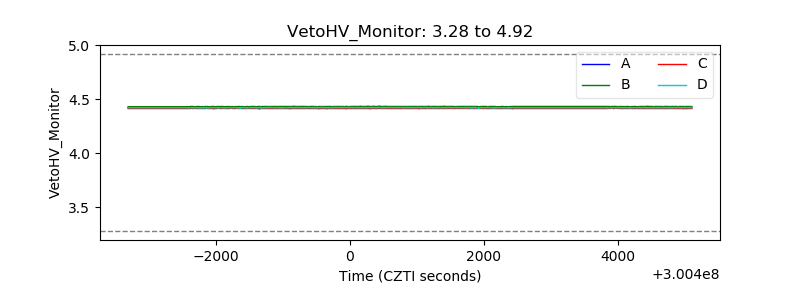 |
| Veto LLD |  |
| Alpha Counter | 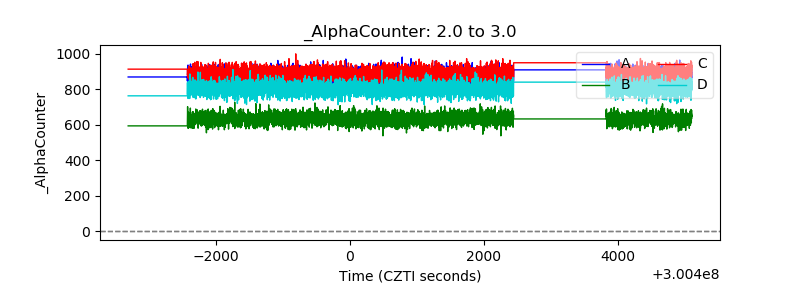 |
| _CPM_Rate | 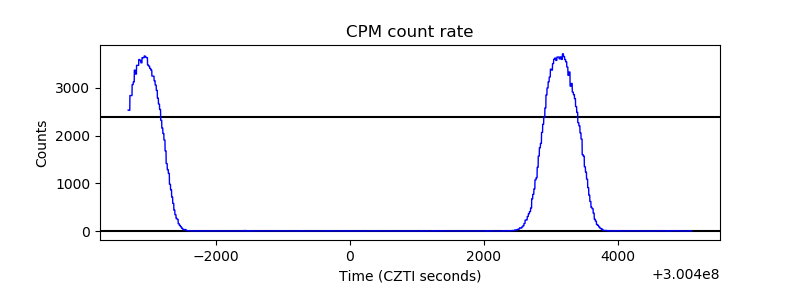 |
| CZT Counter | 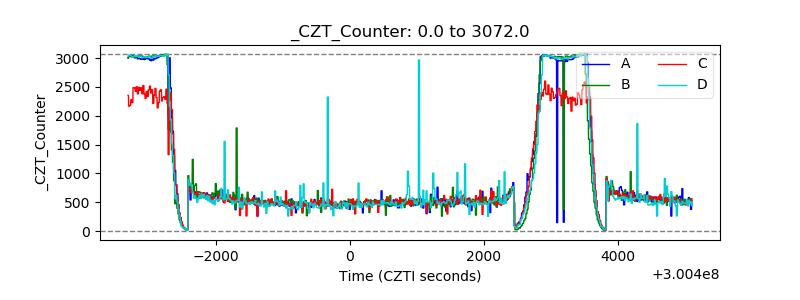 |
| +2.5 Volts monitor |  |
| +5 Volts monitor | 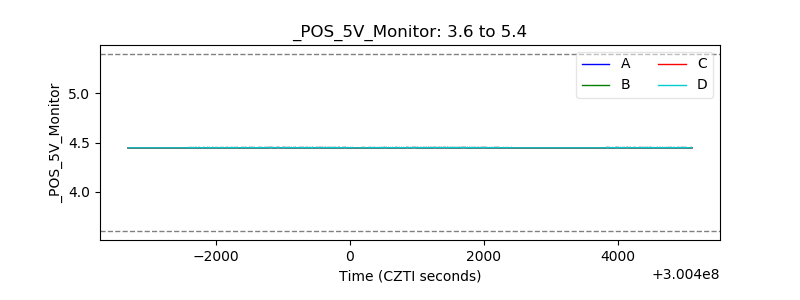 |
| _ROLL_ROT | 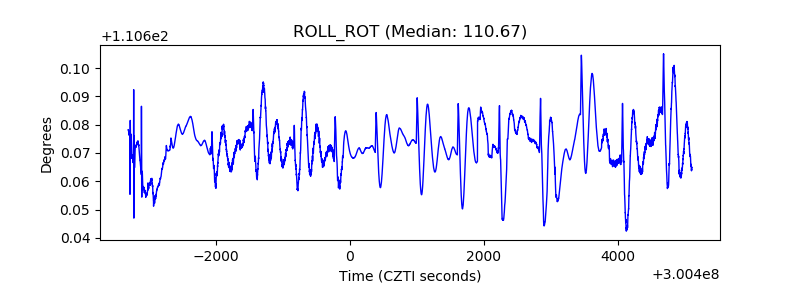 |
| _Roll_DEC | 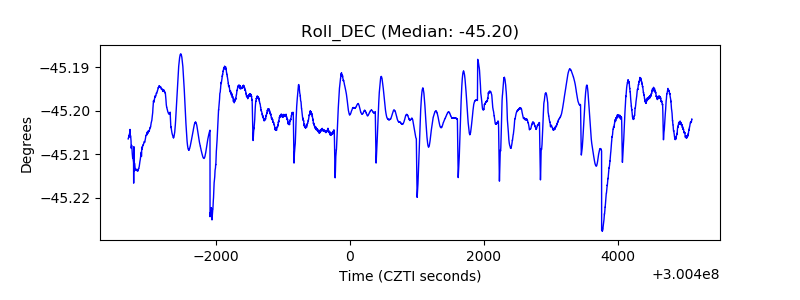 |
| _Roll_RA |  |
| Veto Counter | 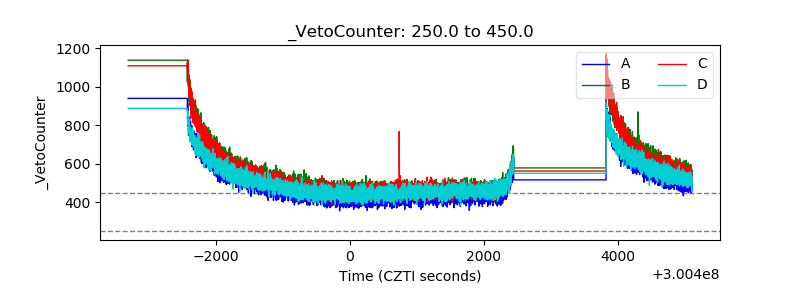 |