| Param | Original file | Final file |
|---|---|---|
| Filename | modeM0/AS1A05_188T01_9000003018_20439cztM0_level2.evt | modeM0/AS1A05_188T01_9000003018_20439cztM0_level2_quad_clean.evt |
| Size (bytes) | 463,481,280 | 71,735,040 |
| Size | 442.0 MB | 68.4 MB |
| Events in quadrant A | 3,234,423 | 441,555 |
| Events in quadrant B | 3,555,903 | 451,090 |
| Events in quadrant C | 3,364,967 | 428,828 |
| Events in quadrant D | 3,459,086 | 416,551 |
| Mode SS | |||
|---|---|---|---|
| Quadrant | BADHDUFLAG | Total packets | Discarded packets |
| A | 0 | 126 | 0 |
| B | 0 | 126 | 0 |
| C | 0 | 126 | 0 |
| D | 0 | 126 | 0 |
| Mode M9 | |||
|---|---|---|---|
| Quadrant | BADHDUFLAG | Total packets | Discarded packets |
| A | 0 | 18 | 0 |
| B | 0 | 19 | 0 |
| C | 0 | 19 | 0 |
| D | 0 | 19 | 0 |
| Mode M0 | |||
|---|---|---|---|
| Quadrant | BADHDUFLAG | Total packets | Discarded packets |
| A | 0 | 13124 | 2 |
| B | 0 | 14177 | 3 |
| C | 0 | 13342 | 2 |
| D | 0 | 13932 | 2 |
| Quadrant | Total seconds | Saturated seconds | Saturation percentage |
|---|---|---|---|
| A | 6222 | 53 | 0.851816% |
| B | 6221 | 78 | 1.253818% |
| C | 6221 | 67 | 1.076997% |
| D | 6221 | 111 | 1.784279% |
Noise dominated data is calculated using 1-second bins in cleaned event files. If a bin has >2000 counts, and if more than 50% of those come from <1% of pixels, then it is considered to be noise-dominated and hence unusable.
| Quadrant | # 1 sec bins | Bins with >0 counts | Bins with >2000 counts | High rate bins dominated by noise | Noise dominated (total time) | Noise dominated (detector-on time) | Marked lightcurve |
|---|---|---|---|---|---|---|---|
| A | 7587 | 6223 | 0 | 0 | 0.00% | 0.00% | 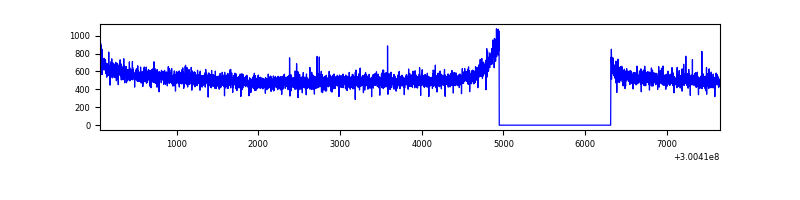 |
| B | 7586 | 6222 | 2 | 2 | 0.03% | 0.03% | 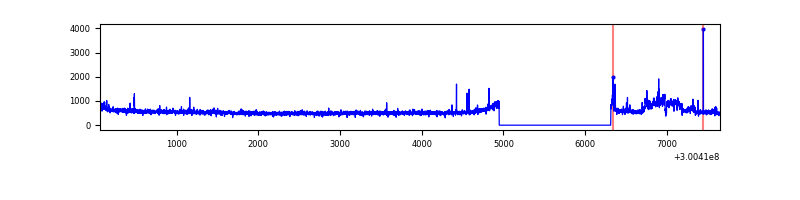 |
| C | 7586 | 6222 | 3 | 3 | 0.04% | 0.05% | 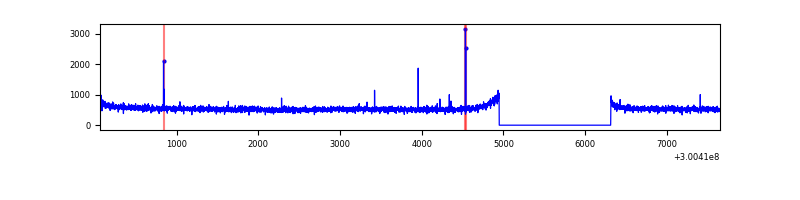 |
| D | 7586 | 6221 | 75 | 75 | 0.99% | 1.21% | 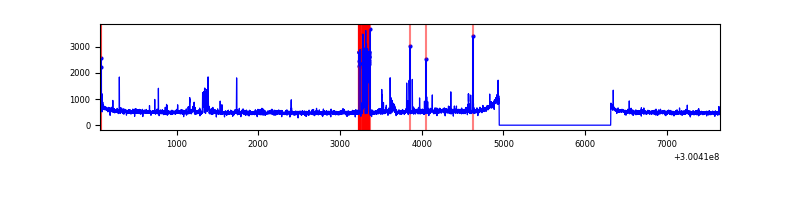 |
Top three noisy pixels from each quadrant. If the there are fewer than three noisy pixels in the level2.evt file, extra rows are filled as -1
| Pixel properties | Quadrant properties | ||||||
|---|---|---|---|---|---|---|---|
| Quadrant | DetID | PixID | Counts | Sigma | Mean | Median | Sigma |
| A | 0 | 226 | 7378 | 39.81 | 840 | 826 | 164.6 |
| A | 3 | 137 | 6336 | 33.48 | 840 | 826 | 164.6 |
| A | 12 | 194 | 6031 | 31.62 | 840 | 826 | 164.6 |
| B | 10 | 245 | 239839 | 1554.33 | 838 | 820 | 153.8 |
| B | 12 | 111 | 18487 | 114.89 | 838 | 820 | 153.8 |
| B | 11 | 111 | 16520 | 102.1 | 838 | 820 | 153.8 |
| C | 14 | 238 | 131245 | 709.14 | 806 | 813 | 183.9 |
| C | 3 | 247 | 56424 | 302.35 | 806 | 813 | 183.9 |
| C | 3 | 233 | 25480 | 134.11 | 806 | 813 | 183.9 |
| D | 13 | 153 | 231804 | 1203.09 | 808 | 785 | 192.0 |
| D | 1 | 52 | 148349 | 768.47 | 808 | 785 | 192.0 |
| D | 2 | 234 | 26164 | 132.17 | 808 | 785 | 192.0 |
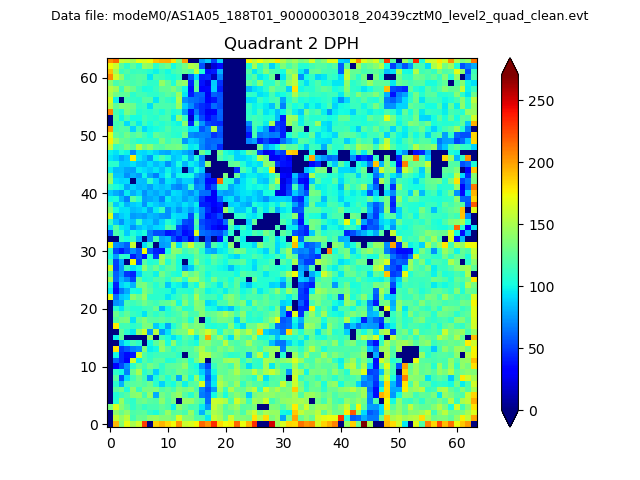
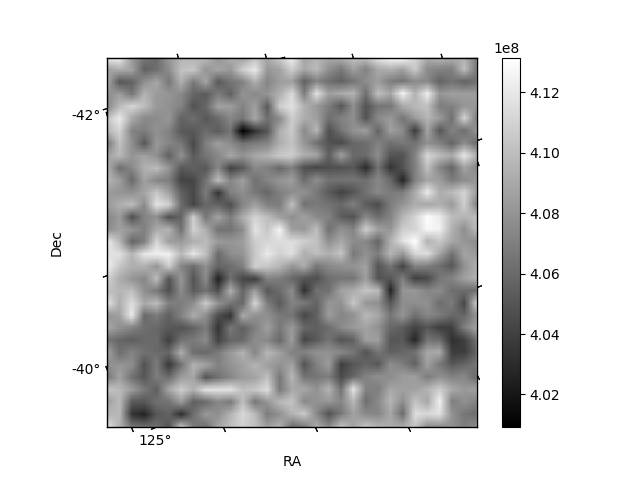
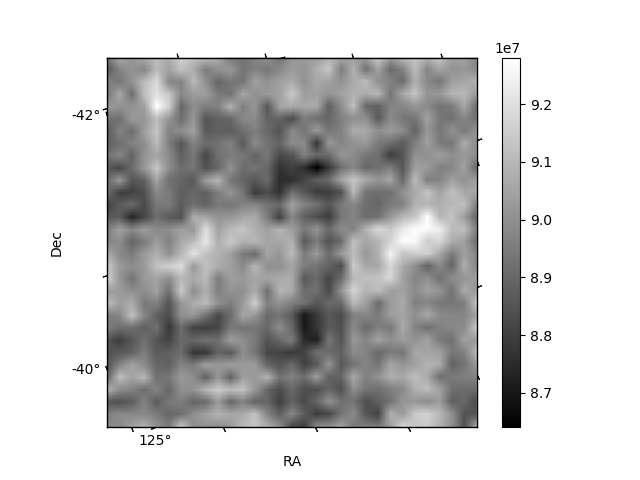
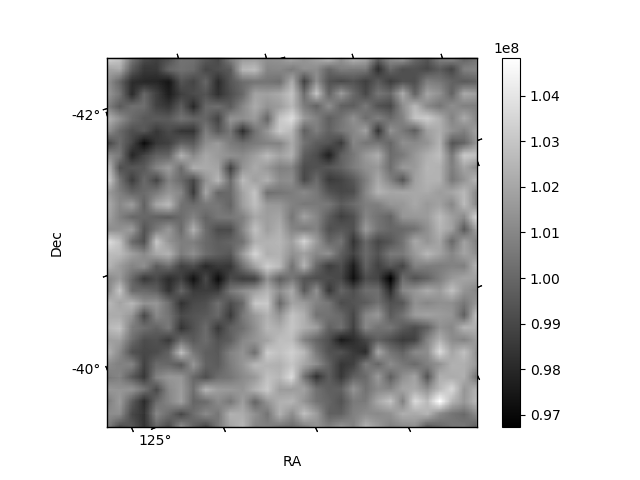
Histogram calculated using DETX and DETY for each event in the final _common_clean file
| Quadrant A | 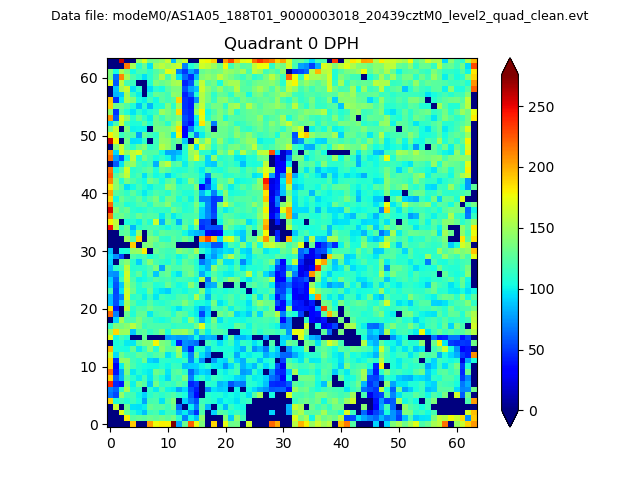 |
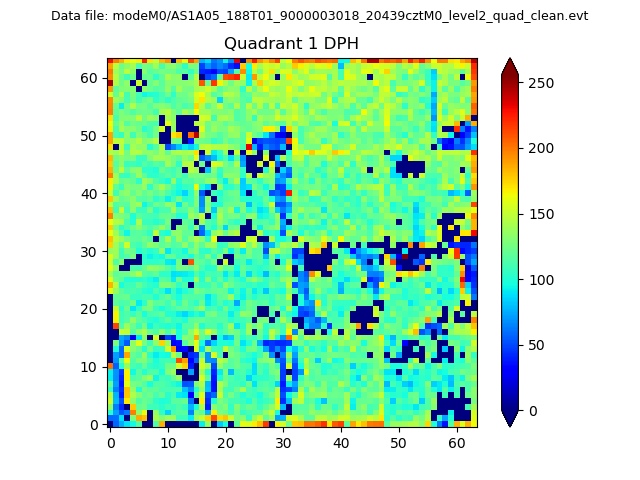 |
Quadrant B |
|---|---|---|---|
| Quadrant D | 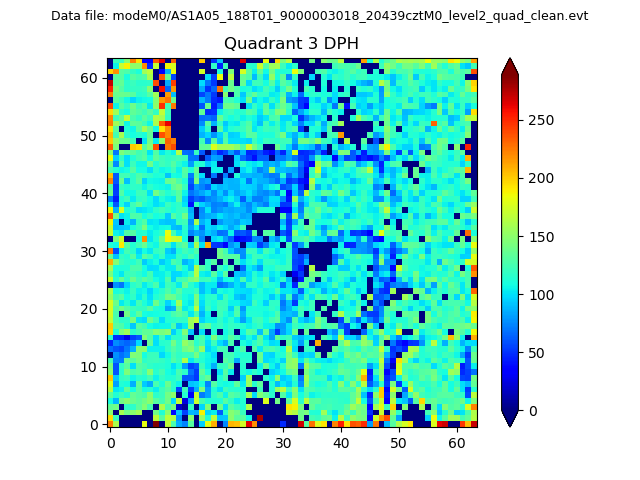 |
 |
Quadrant C |
| Plot type | Count rate plots | Images |
|---|---|---|
| Comparison with Poisson distribution Blue bars denote a histogram of data divided into 1 sec bins. Red curve is a Poisson curve with rate = median count rate of data. |
 |
 |
| Quadrant-wise count rates Data is divided into 100 sec bins |
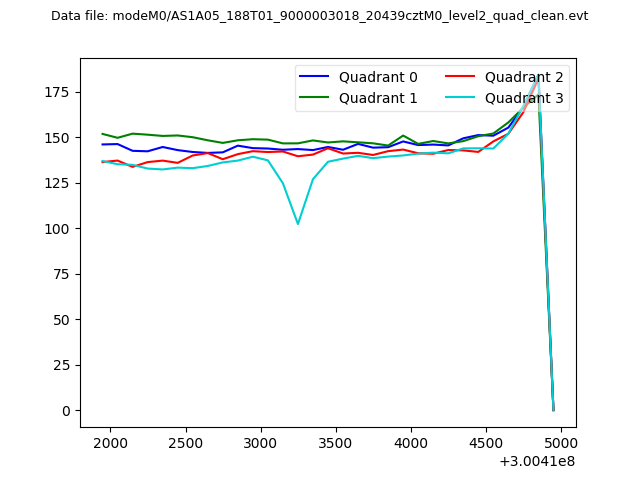 |
|
| Module-wise count rates for Quadrant A Data is divided into 100 sec bins |
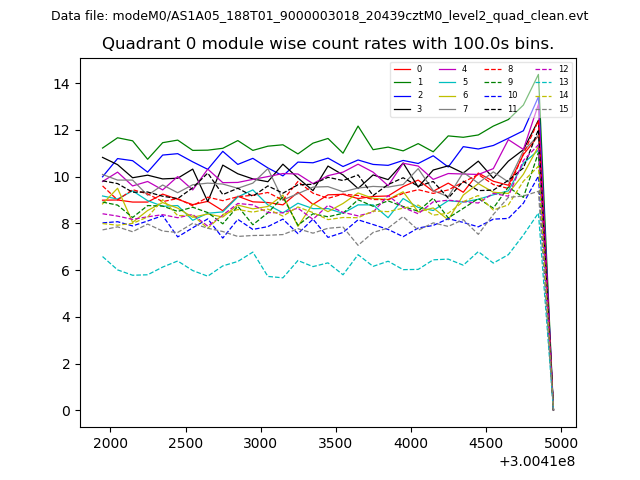 |
 |
| Module-wise count rates for Quadrant B Data is divided into 100 sec bins |
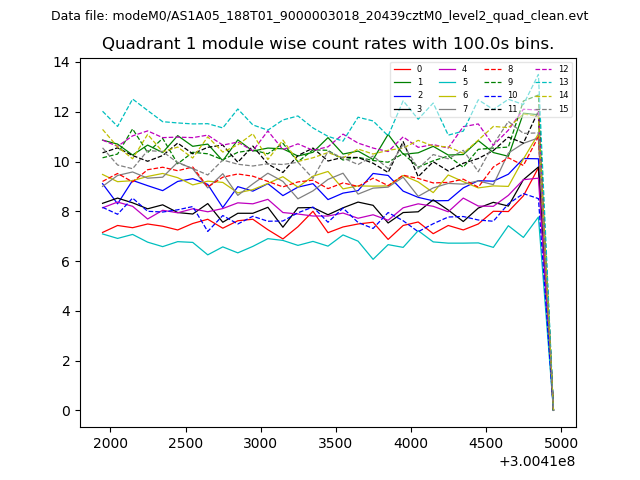 |
 |
| Module-wise count rates for Quadrant C Data is divided into 100 sec bins |
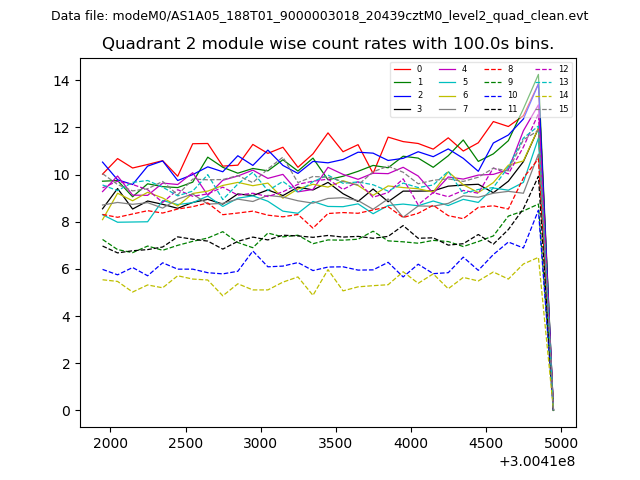 |
 |
| Module-wise count rates for Quadrant D Data is divided into 100 sec bins |
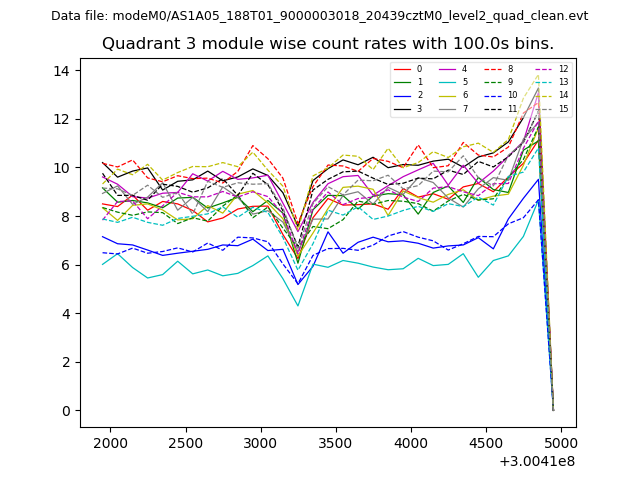 |
 |
| Parameter | Plot |
|---|---|
| CZT HV Monitor | 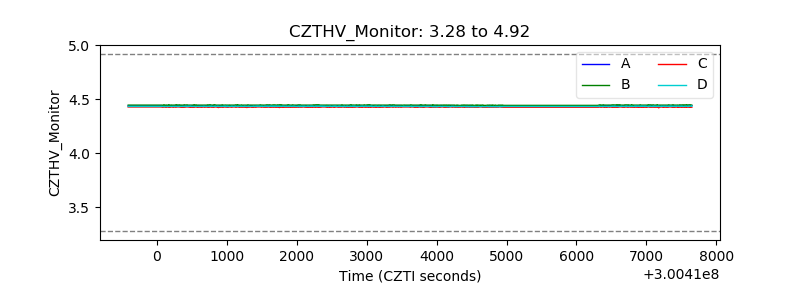 |
| D_VDD | 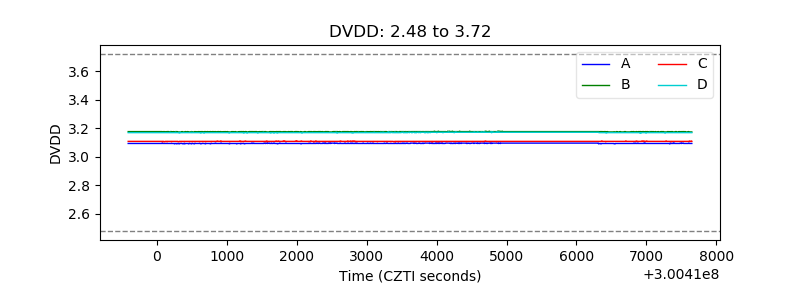 |
| Temperature 1 | 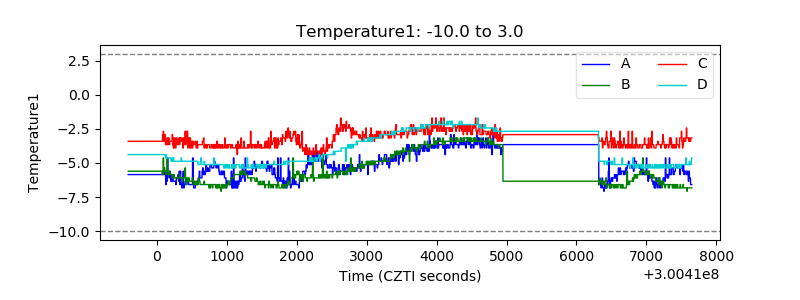 |
| Veto HV Monitor |  |
| Veto LLD | 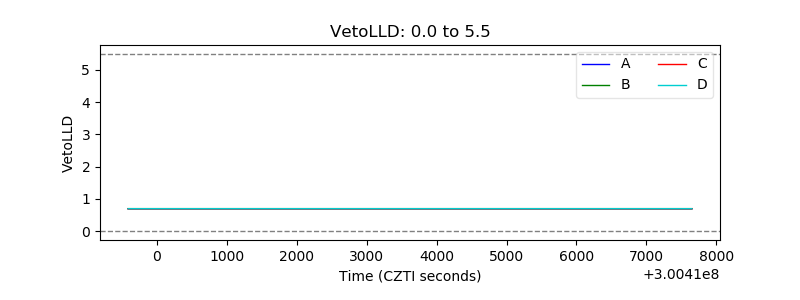 |
| Alpha Counter | 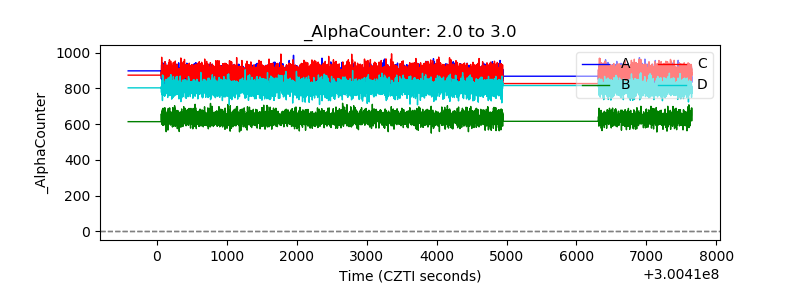 |
| _CPM_Rate | 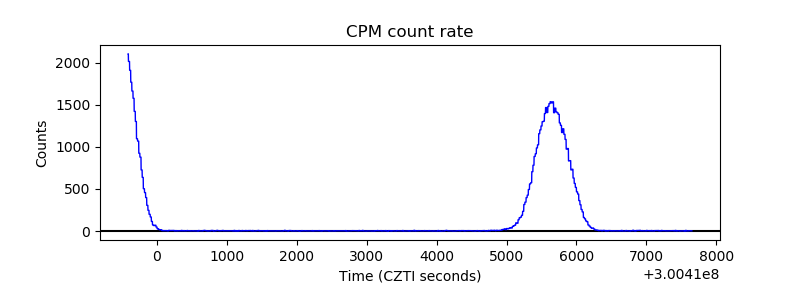 |
| CZT Counter | 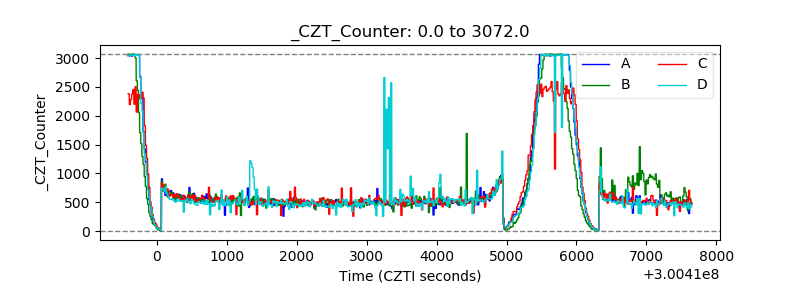 |
| +2.5 Volts monitor |  |
| +5 Volts monitor |  |
| _ROLL_ROT | 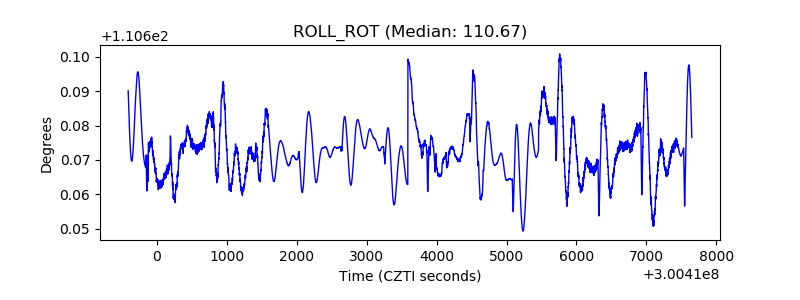 |
| _Roll_DEC |  |
| _Roll_RA | 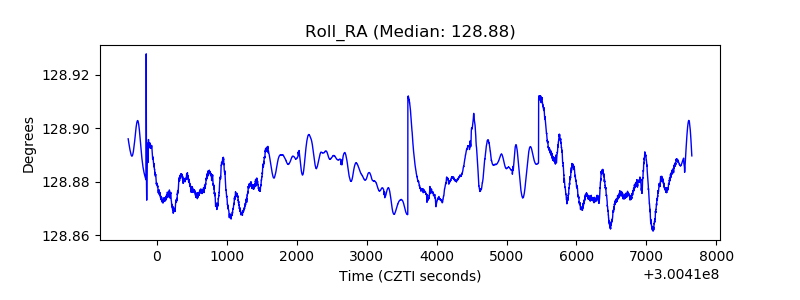 |
| Veto Counter | 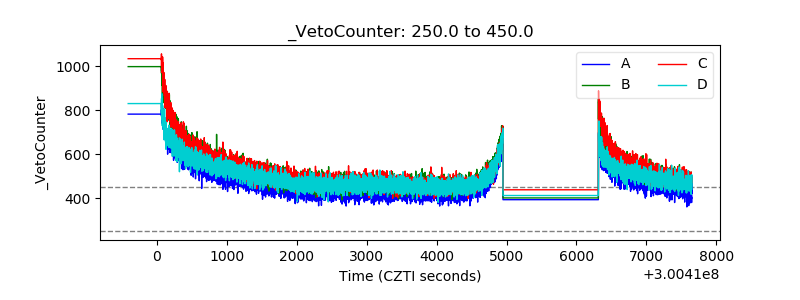 |