| Param | Original file | Final file |
|---|---|---|
| Filename | modeM0/AS1A05_188T01_9000003018_20440cztM0_level2.evt | modeM0/AS1A05_188T01_9000003018_20440cztM0_level2_quad_clean.evt |
| Size (bytes) | 365,143,680 | 78,785,280 |
| Size | 348.2 MB | 75.1 MB |
| Events in quadrant A | 2,545,045 | 515,181 |
| Events in quadrant B | 2,909,682 | 517,923 |
| Events in quadrant C | 2,632,025 | 501,741 |
| Events in quadrant D | 2,624,412 | 493,379 |
| Mode SS | |||
|---|---|---|---|
| Quadrant | BADHDUFLAG | Total packets | Discarded packets |
| A | 0 | 104 | 0 |
| B | 0 | 104 | 0 |
| C | 0 | 104 | 0 |
| D | 0 | 104 | 0 |
| Mode M9 | |||
|---|---|---|---|
| Quadrant | BADHDUFLAG | Total packets | Discarded packets |
| A | 0 | 11 | 0 |
| B | 0 | 12 | 0 |
| C | 0 | 12 | 0 |
| D | 0 | 12 | 0 |
| Mode M0 | |||
|---|---|---|---|
| Quadrant | BADHDUFLAG | Total packets | Discarded packets |
| A | 0 | 10533 | 1 |
| B | 0 | 11578 | 1 |
| C | 0 | 10642 | 1 |
| D | 0 | 10977 | 1 |
| Quadrant | Total seconds | Saturated seconds | Saturation percentage |
|---|---|---|---|
| A | 5100 | 23 | 0.450980% |
| B | 5100 | 68 | 1.333333% |
| C | 5100 | 61 | 1.196078% |
| D | 5100 | 41 | 0.803922% |
Noise dominated data is calculated using 1-second bins in cleaned event files. If a bin has >2000 counts, and if more than 50% of those come from <1% of pixels, then it is considered to be noise-dominated and hence unusable.
| Quadrant | # 1 sec bins | Bins with >0 counts | Bins with >2000 counts | High rate bins dominated by noise | Noise dominated (total time) | Noise dominated (detector-on time) | Marked lightcurve |
|---|---|---|---|---|---|---|---|
| A | 5100 | 5100 | 0 | 0 | 0.00% | 0.00% | 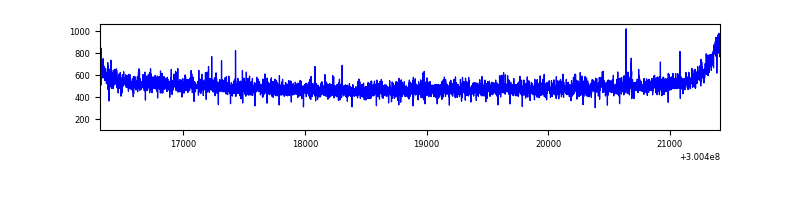 |
| B | 5099 | 5099 | 5 | 5 | 0.10% | 0.10% | 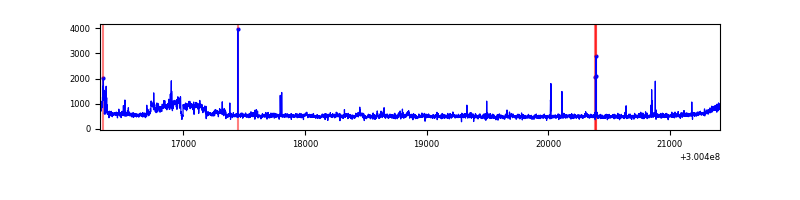 |
| C | 5100 | 5100 | 0 | 0 | 0.00% | 0.00% |  |
| D | 5100 | 5100 | 24 | 24 | 0.47% | 0.47% | 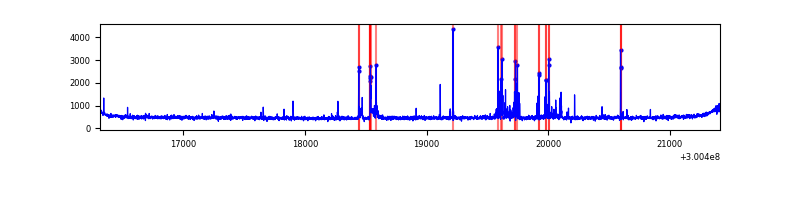 |
Top three noisy pixels from each quadrant. If the there are fewer than three noisy pixels in the level2.evt file, extra rows are filled as -1
| Pixel properties | Quadrant properties | ||||||
|---|---|---|---|---|---|---|---|
| Quadrant | DetID | PixID | Counts | Sigma | Mean | Median | Sigma |
| A | 0 | 226 | 5731 | 39.26 | 658 | 646 | 129.5 |
| A | 10 | 253 | 5585 | 38.13 | 658 | 646 | 129.5 |
| A | 3 | 137 | 5110 | 34.47 | 658 | 646 | 129.5 |
| B | 10 | 245 | 262975 | 2136.26 | 653 | 639 | 122.8 |
| B | 0 | 198 | 57710 | 464.74 | 653 | 639 | 122.8 |
| B | 12 | 111 | 14375 | 111.86 | 653 | 639 | 122.8 |
| C | 14 | 238 | 101380 | 688.13 | 634 | 639 | 146.4 |
| C | 3 | 233 | 26628 | 177.52 | 634 | 639 | 146.4 |
| C | 3 | 247 | 18297 | 120.62 | 634 | 639 | 146.4 |
| D | 13 | 153 | 178791 | 1151.35 | 642 | 625 | 154.7 |
| D | 2 | 234 | 23609 | 148.53 | 642 | 625 | 154.7 |
| D | 2 | 120 | 13155 | 80.97 | 642 | 625 | 154.7 |
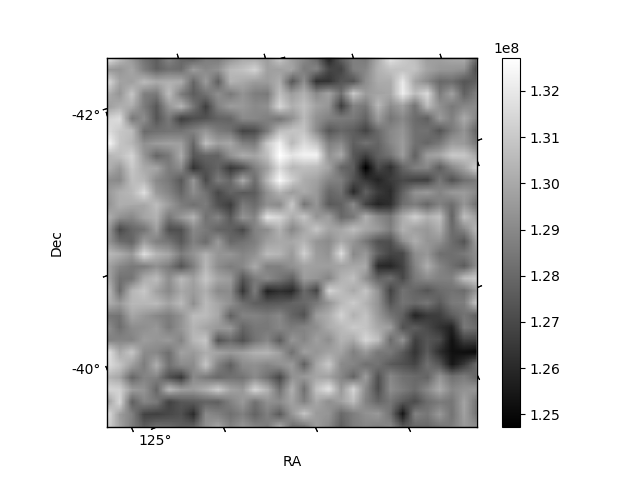
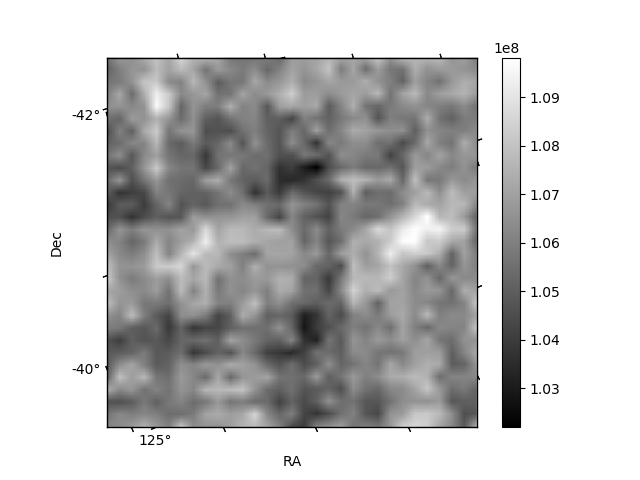
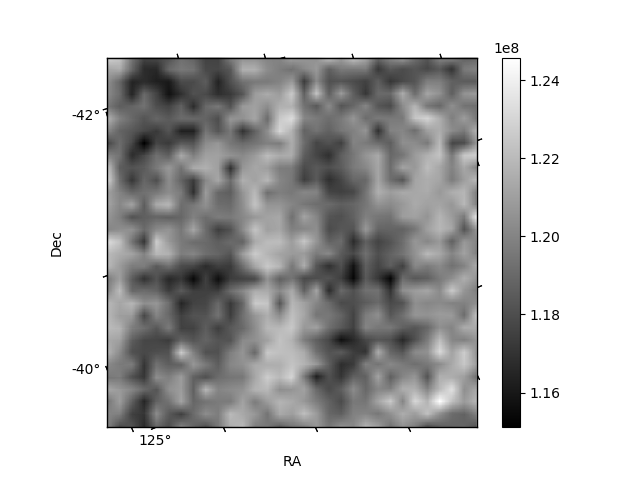
Histogram calculated using DETX and DETY for each event in the final _common_clean file
| Quadrant A | 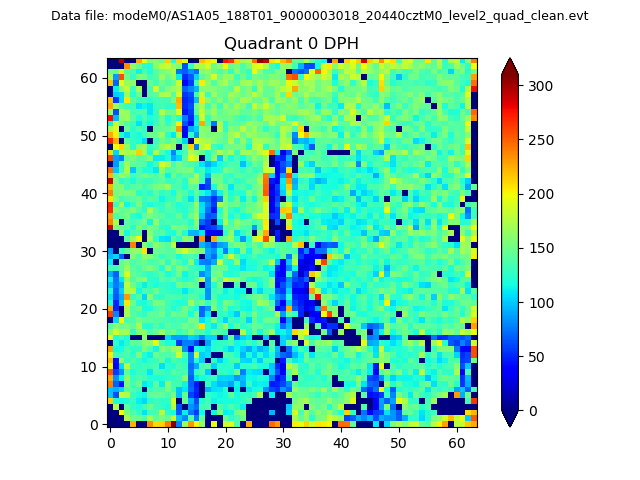 |
 |
Quadrant B |
|---|---|---|---|
| Quadrant D |  |
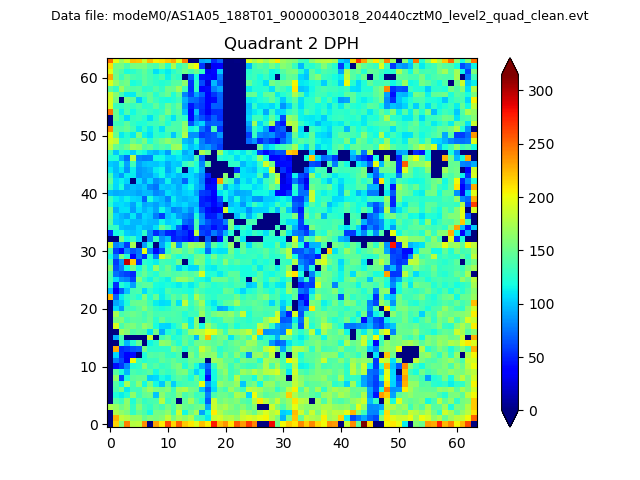 |
Quadrant C |
| Plot type | Count rate plots | Images |
|---|---|---|
| Comparison with Poisson distribution Blue bars denote a histogram of data divided into 1 sec bins. Red curve is a Poisson curve with rate = median count rate of data. |
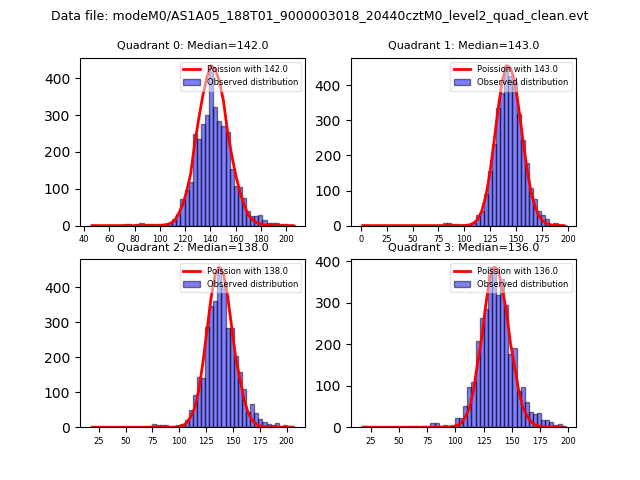 |
 |
| Quadrant-wise count rates Data is divided into 100 sec bins |
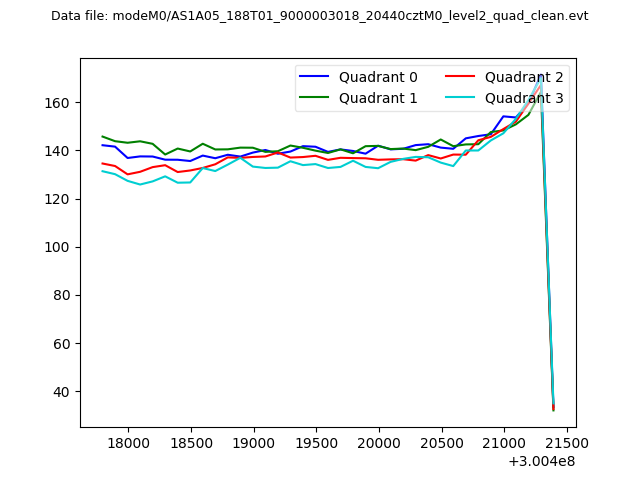 |
|
| Module-wise count rates for Quadrant A Data is divided into 100 sec bins |
 |
 |
| Module-wise count rates for Quadrant B Data is divided into 100 sec bins |
 |
 |
| Module-wise count rates for Quadrant C Data is divided into 100 sec bins |
 |
 |
| Module-wise count rates for Quadrant D Data is divided into 100 sec bins |
 |
 |
| Parameter | Plot |
|---|---|
| CZT HV Monitor |  |
| D_VDD | 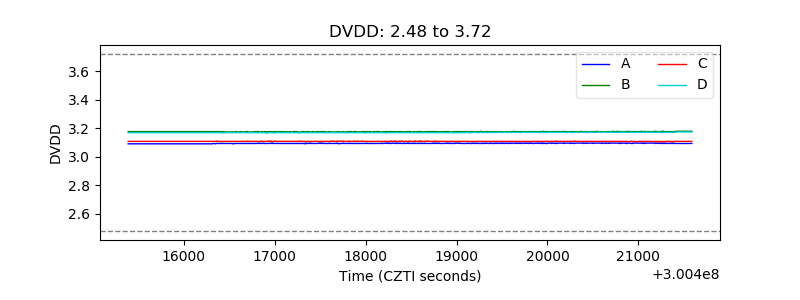 |
| Temperature 1 | 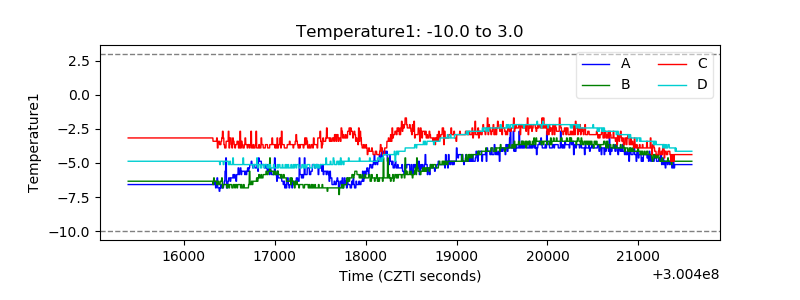 |
| Veto HV Monitor | 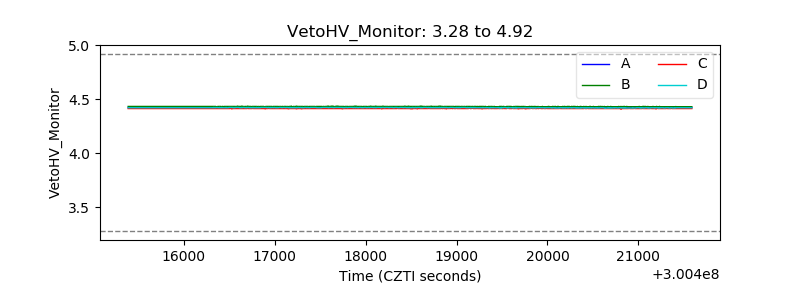 |
| Veto LLD |  |
| Alpha Counter | 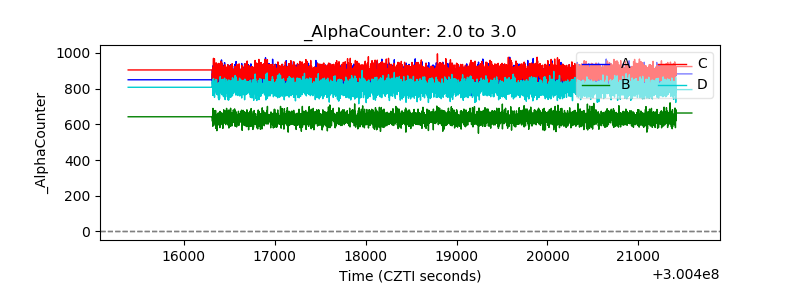 |
| _CPM_Rate | 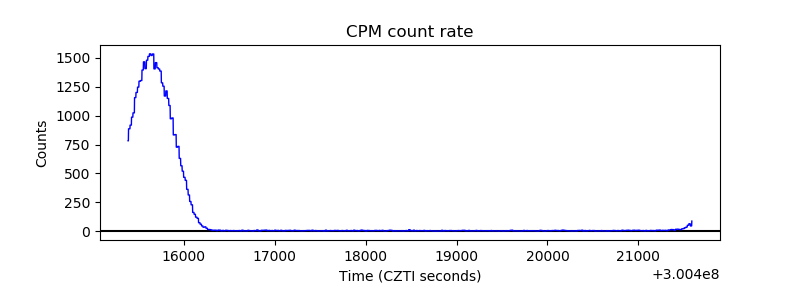 |
| CZT Counter | 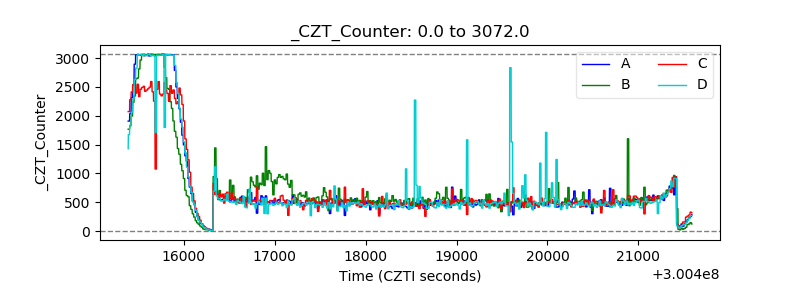 |
| +2.5 Volts monitor |  |
| +5 Volts monitor |  |
| _ROLL_ROT |  |
| _Roll_DEC | 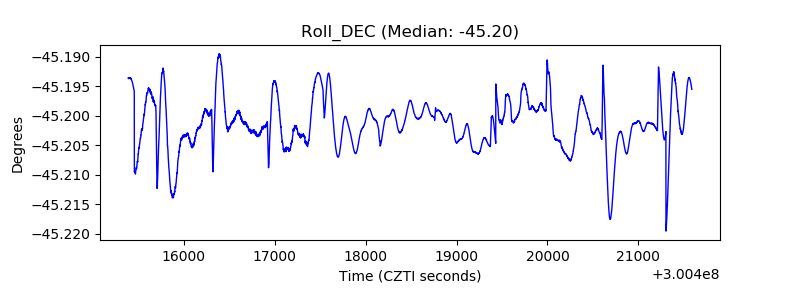 |
| _Roll_RA | 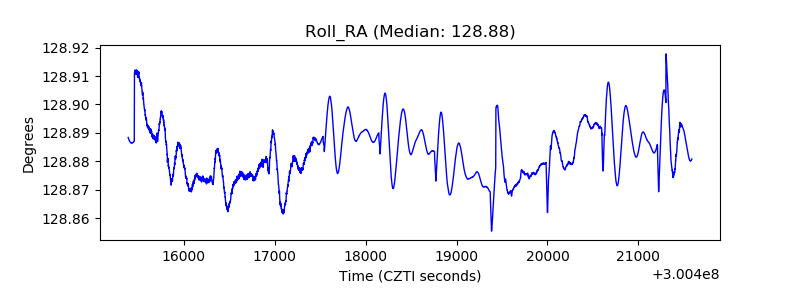 |
| Veto Counter | 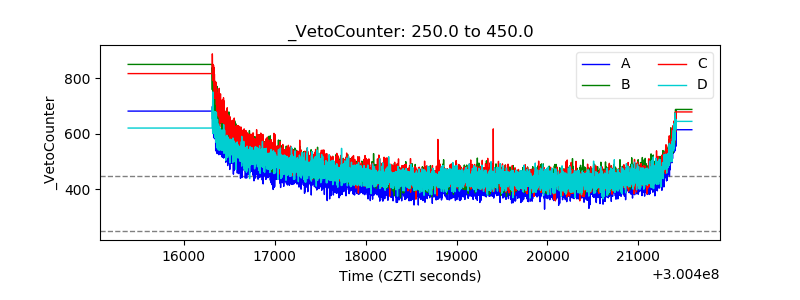 |