| Param | Original file | Final file |
|---|---|---|
| Filename | modeM0/AS1A05_160T02_9000003022cztM0_level2.fits | modeM0/AS1A05_160T02_9000003022cztM0_level2_quad_clean.evt |
| Size (bytes) | 564,937,920 | 390,237,120 |
| Size | 538.8 MB | 372.2 MB |
| Events in quadrant A | 3,509,164 | 2,099,542 |
| Events in quadrant B | 3,384,878 | 2,086,830 |
| Events in quadrant C | 3,412,148 | 1,977,525 |
| Events in quadrant D | 2,878,108 | 1,728,012 |
| Mode SS | |||
|---|---|---|---|
| Quadrant | BADHDUFLAG | Total packets | Discarded packets |
| A | 0 | 1160 | 0 |
| B | 0 | 1162 | 0 |
| C | 0 | 1162 | 0 |
| D | 0 | 1162 | 0 |
| Mode M0 | |||
|---|---|---|---|
| Quadrant | BADHDUFLAG | Total packets | Discarded packets |
| A | 0 | 122756 | 0 |
| B | 0 | 130423 | 0 |
| C | 0 | 122210 | 0 |
| D | 0 | 154226 | 0 |
| Mode M9 | |||
|---|---|---|---|
| Quadrant | BADHDUFLAG | Total packets | Discarded packets |
| A | 0 | 104 | 0 |
| B | 0 | 104 | 0 |
| C | 0 | 104 | 0 |
| D | 0 | 104 | 0 |
| Quadrant | Total seconds | Saturated seconds | Saturation percentage |
|---|---|---|---|
| A | 57197 | 998 | 1.744847% |
| B | 57192 | 1269 | 2.218842% |
| C | 57210 | 1064 | 1.859815% |
| D | 57200 | 3027 | 5.291958% |
Noise dominated data is calculated using 1-second bins in cleaned event files. If a bin has >2000 counts, and if more than 50% of those come from <1% of pixels, then it is considered to be noise-dominated and hence unusable.
| Quadrant | # 1 sec bins | Bins with >0 counts | Bins with >2000 counts | High rate bins dominated by noise | Noise dominated (total time) | Noise dominated (detector-on time) | Marked lightcurve |
|---|---|---|---|---|---|---|---|
| A | 67576 | 57188 | 0 | 0 | 0.00% | 0.00% | 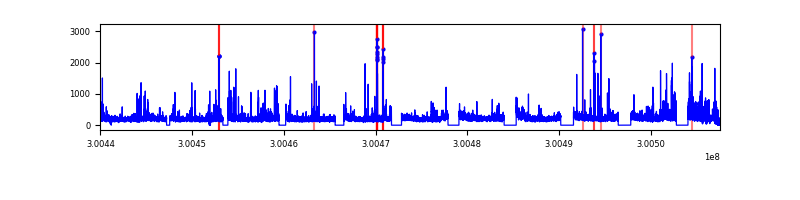 |
| B | 67551 | 57253 | 0 | 0 | 0.00% | 0.00% |  |
| C | 67590 | 57269 | 0 | 0 | 0.00% | 0.00% | 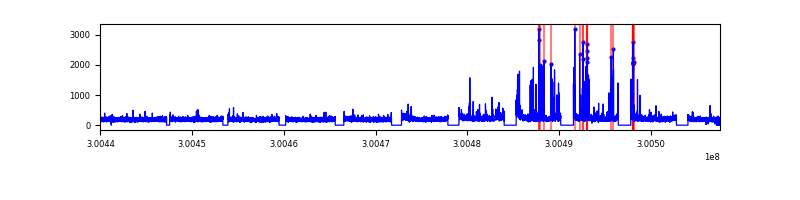 |
| D | 67548 | 57211 | 0 | 0 | 0.00% | 0.00% |  |
Top three noisy pixels from each quadrant. If the there are fewer than three noisy pixels in the level2.evt file, extra rows are filled as -1
| Pixel properties | Quadrant properties | ||||||
|---|---|---|---|---|---|---|---|
| Quadrant | DetID | PixID | Counts | Sigma | Mean | Median | Sigma |
| A | 0 | 29 | 3316 | 10.83 | 915 | 860 | 226.7 |
| A | 7 | 110 | 2784 | 8.49 | 915 | 860 | 226.7 |
| A | 9 | 19 | 2702 | 8.13 | 915 | 860 | 226.7 |
| B | 2 | 9 | 2704 | 10.52 | 896 | 856 | 175.7 |
| B | 2 | 8 | 2309 | 8.27 | 896 | 856 | 175.7 |
| B | 5 | 225 | 2255 | 7.96 | 896 | 856 | 175.7 |
| C | 12 | 241 | 2363 | 6.62 | 900 | 842 | 229.5 |
| C | 9 | 209 | 2337 | 6.51 | 900 | 842 | 229.5 |
| C | 9 | 233 | 2289 | 6.3 | 900 | 842 | 229.5 |
| D | 3 | 14 | 2119 | 6.23 | 824 | 751 | 219.8 |
| D | 7 | 3 | 2090 | 6.09 | 824 | 751 | 219.8 |
| D | 6 | 231 | 2056 | 5.94 | 824 | 751 | 219.8 |
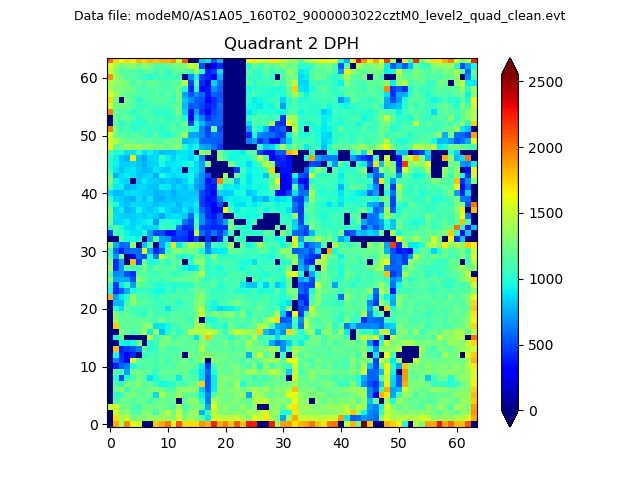
Histogram calculated using DETX and DETY for each event in the final _common_clean file
| Quadrant A | 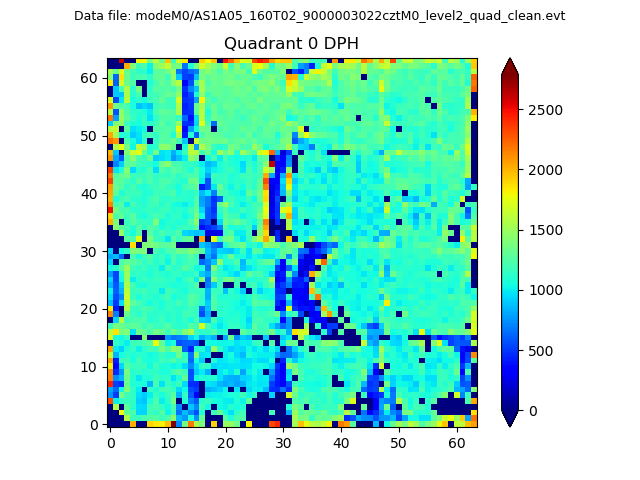 |
 |
Quadrant B |
|---|---|---|---|
| Quadrant D | 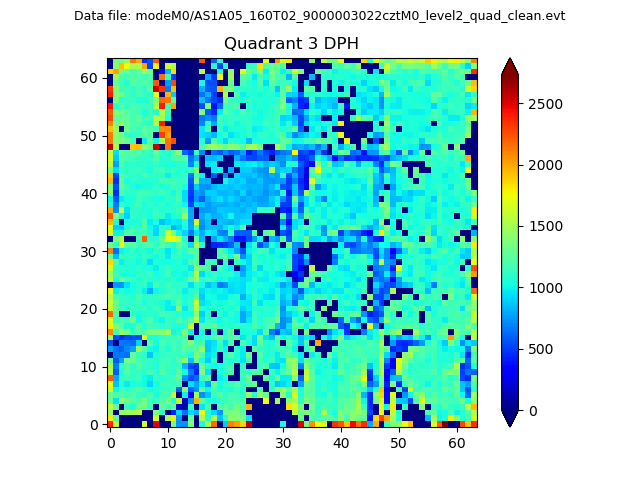 |
 |
Quadrant C |
| Plot type | Count rate plots | Images |
|---|---|---|
| Comparison with Poisson distribution Blue bars denote a histogram of data divided into 1 sec bins. Red curve is a Poisson curve with rate = median count rate of data. |
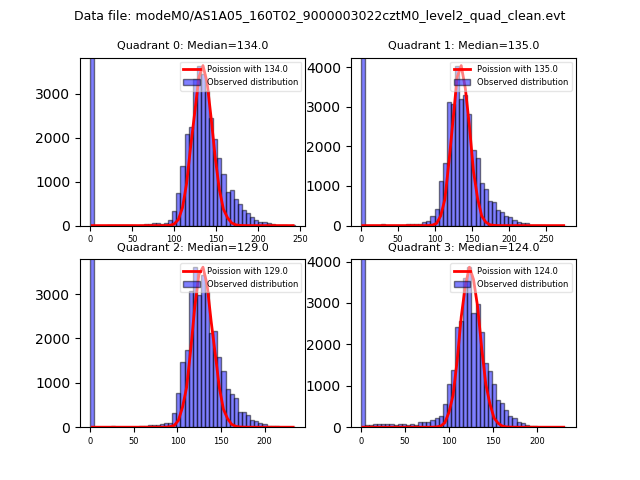 |
 |
| Quadrant-wise count rates Data is divided into 100 sec bins |
 |
|
| Module-wise count rates for Quadrant A Data is divided into 100 sec bins |
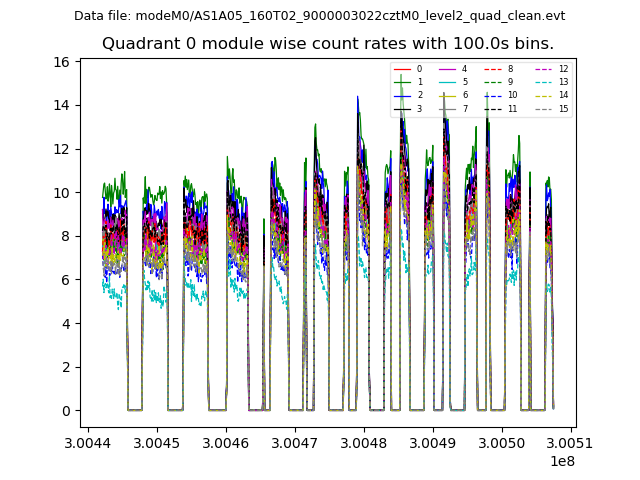 |
 |
| Module-wise count rates for Quadrant B Data is divided into 100 sec bins |
 |
 |
| Module-wise count rates for Quadrant C Data is divided into 100 sec bins |
 |
 |
| Module-wise count rates for Quadrant D Data is divided into 100 sec bins |
 |
 |
| Parameter | Plot |
|---|---|
| CZT HV Monitor |  |
| D_VDD | 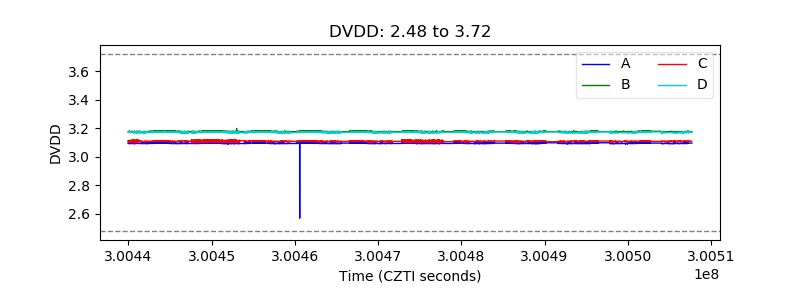 |
| Temperature 1 |  |
| Veto HV Monitor | 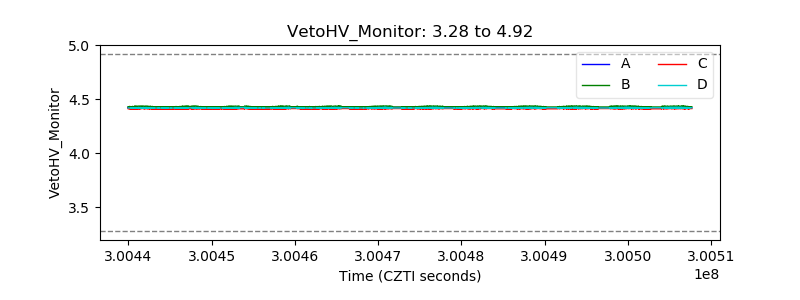 |
| Veto LLD |  |
| Alpha Counter |  |
| _CPM_Rate |  |
| CZT Counter |  |
| +2.5 Volts monitor |  |
| +5 Volts monitor |  |
| _ROLL_ROT |  |
| _Roll_DEC |  |
| _Roll_RA |  |
| Veto Counter | 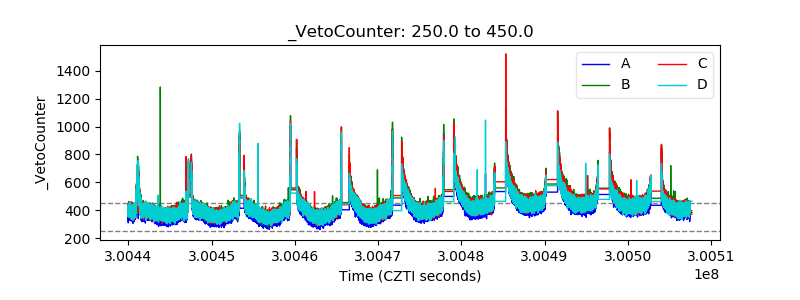 |