| Param | Original file | Final file |
|---|---|---|
| Filename | modeM0/AS1A05_160T02_9000003022_20443cztM0_level2.evt | modeM0/AS1A05_160T02_9000003022_20443cztM0_level2_quad_clean.evt |
| Size (bytes) | 229,037,760 | 20,577,600 |
| Size | 218.4 MB | 19.6 MB |
| Events in quadrant A | 1,556,073 | 103,795 |
| Events in quadrant B | 1,640,791 | 106,830 |
| Events in quadrant C | 1,563,619 | 100,999 |
| Events in quadrant D | 1,971,725 | 98,629 |
| Mode SS | |||
|---|---|---|---|
| Quadrant | BADHDUFLAG | Total packets | Discarded packets |
| A | 0 | 60 | 0 |
| B | 0 | 60 | 0 |
| C | 0 | 60 | 0 |
| D | 0 | 60 | 0 |
| Mode M0 | |||
|---|---|---|---|
| Quadrant | BADHDUFLAG | Total packets | Discarded packets |
| A | 0 | 6447 | 1 |
| B | 0 | 6636 | 1 |
| C | 0 | 6408 | 2 |
| D | 0 | 7797 | 1 |
| Quadrant | Total seconds | Saturated seconds | Saturation percentage |
|---|---|---|---|
| A | 2971 | 273 | 9.188825% |
| B | 2971 | 283 | 9.525412% |
| C | 2970 | 277 | 9.326599% |
| D | 2970 | 318 | 10.707071% |
Noise dominated data is calculated using 1-second bins in cleaned event files. If a bin has >2000 counts, and if more than 50% of those come from <1% of pixels, then it is considered to be noise-dominated and hence unusable.
| Quadrant | # 1 sec bins | Bins with >0 counts | Bins with >2000 counts | High rate bins dominated by noise | Noise dominated (total time) | Noise dominated (detector-on time) | Marked lightcurve |
|---|---|---|---|---|---|---|---|
| A | 2986 | 2971 | 1 | 1 | 0.03% | 0.03% | 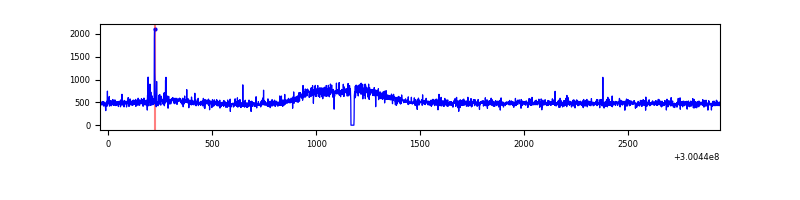 |
| B | 2986 | 2972 | 5 | 5 | 0.17% | 0.17% | 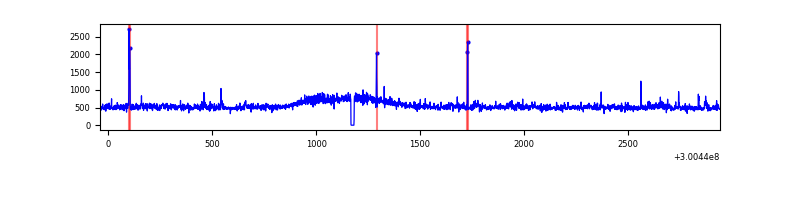 |
| C | 2985 | 2971 | 0 | 0 | 0.00% | 0.00% | 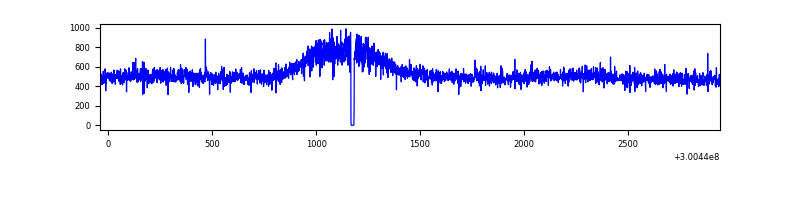 |
| D | 2985 | 2970 | 106 | 106 | 3.55% | 3.57% | 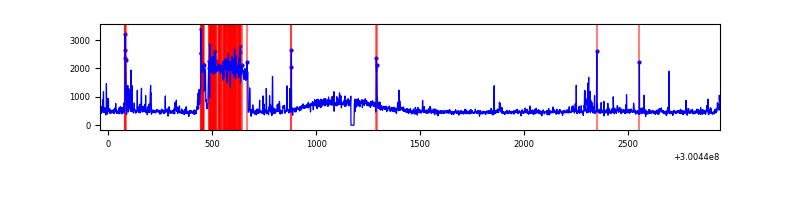 |
Top three noisy pixels from each quadrant. If the there are fewer than three noisy pixels in the level2.evt file, extra rows are filled as -1
| Pixel properties | Quadrant properties | ||||||
|---|---|---|---|---|---|---|---|
| Quadrant | DetID | PixID | Counts | Sigma | Mean | Median | Sigma |
| A | 12 | 16 | 18439 | 219.6 | 397 | 387 | 82.2 |
| A | 12 | 194 | 5828 | 66.19 | 397 | 387 | 82.2 |
| A | 5 | 16 | 5360 | 60.5 | 397 | 387 | 82.2 |
| B | 0 | 219 | 24200 | 303.72 | 394 | 381 | 78.4 |
| B | 10 | 245 | 21392 | 267.91 | 394 | 381 | 78.4 |
| B | 0 | 189 | 17287 | 215.57 | 394 | 381 | 78.4 |
| C | 14 | 238 | 60050 | 656.44 | 378 | 379 | 90.9 |
| C | 9 | 54 | 14600 | 156.45 | 378 | 379 | 90.9 |
| C | 3 | 233 | 9781 | 103.43 | 378 | 379 | 90.9 |
| D | 1 | 52 | 462330 | 4760.0 | 387 | 372 | 97.0 |
| D | 12 | 218 | 20746 | 209.93 | 387 | 372 | 97.0 |
| D | 2 | 234 | 14262 | 143.12 | 387 | 372 | 97.0 |
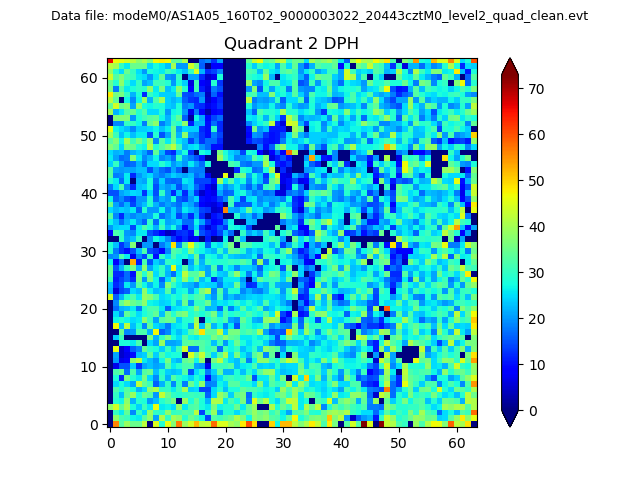
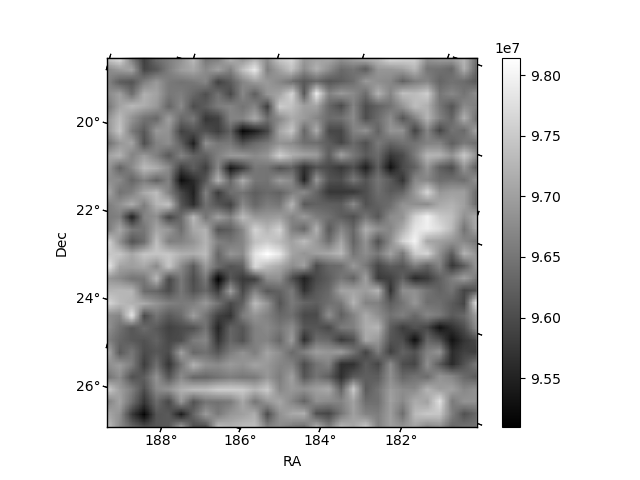
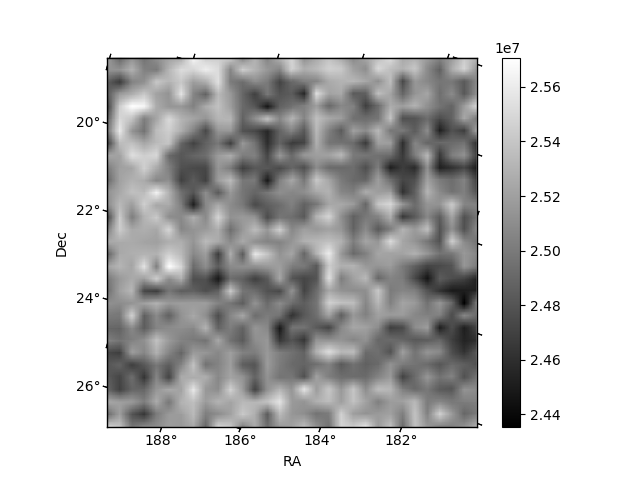
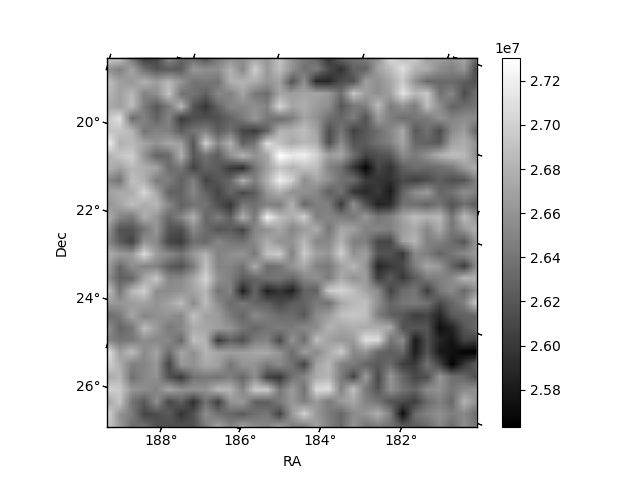
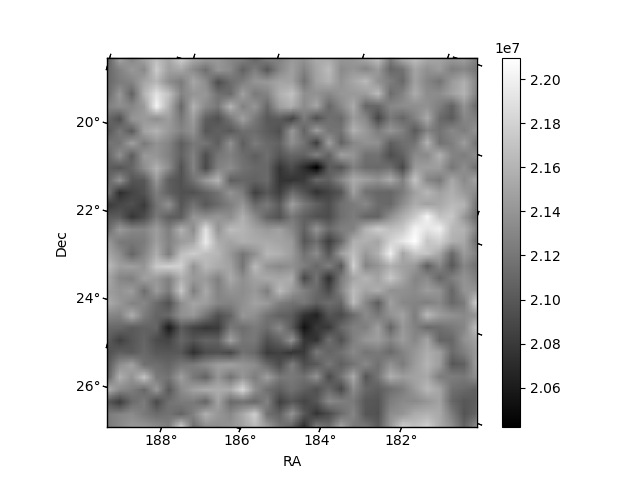
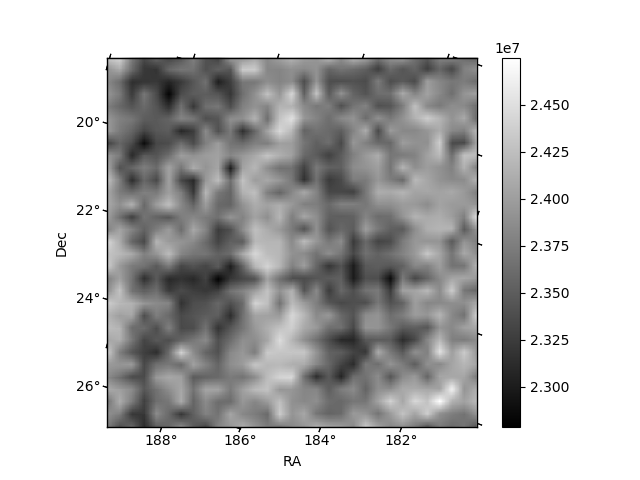
Histogram calculated using DETX and DETY for each event in the final _common_clean file
| Quadrant A | 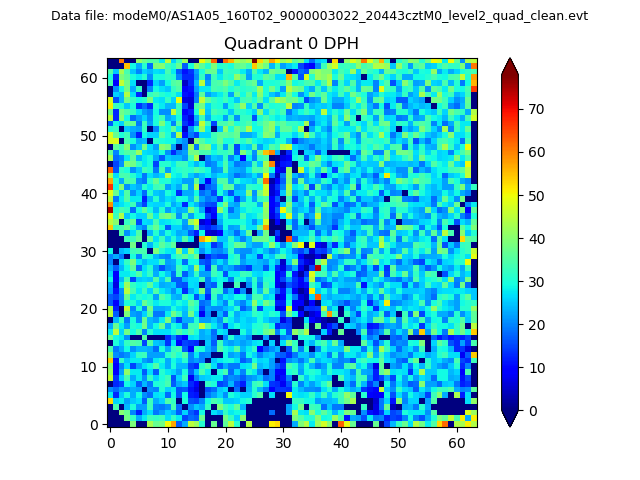 |
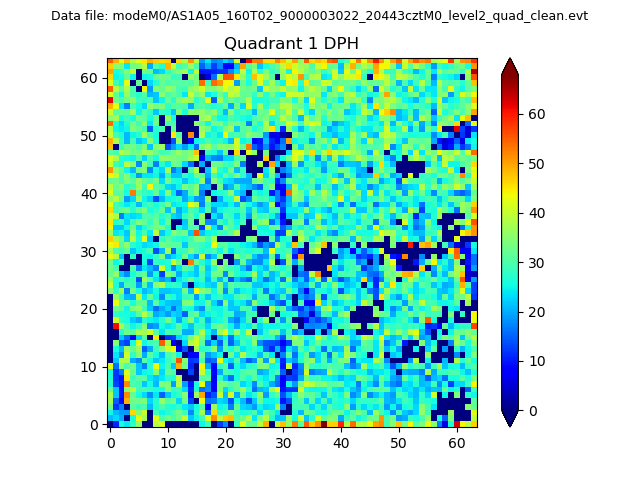 |
Quadrant B |
|---|---|---|---|
| Quadrant D | 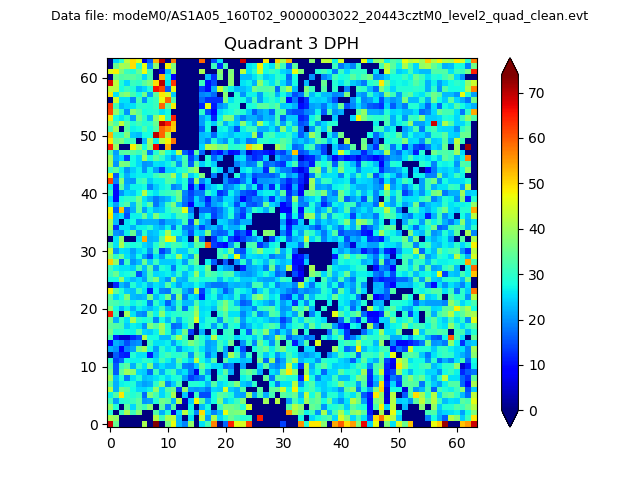 |
 |
Quadrant C |
| Plot type | Count rate plots | Images |
|---|---|---|
| Comparison with Poisson distribution Blue bars denote a histogram of data divided into 1 sec bins. Red curve is a Poisson curve with rate = median count rate of data. |
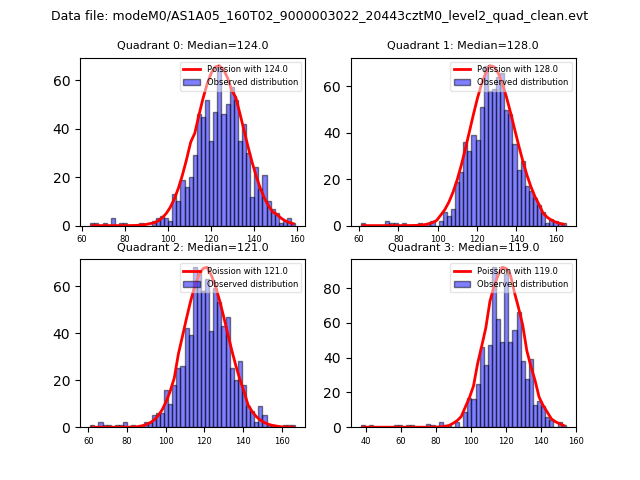 |
 |
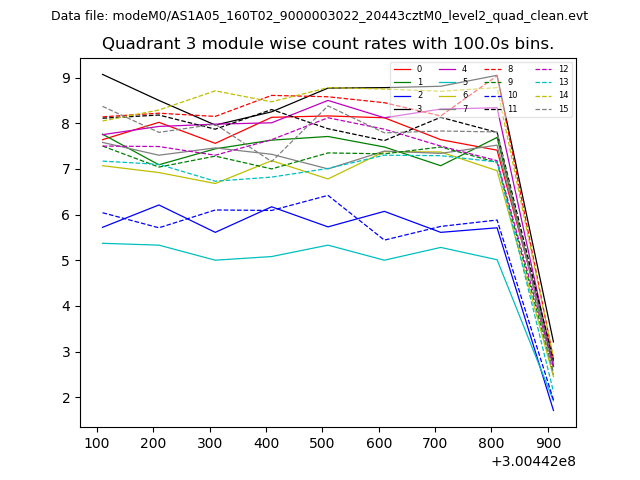
| Quadrant-wise count rates Data is divided into 100 sec bins |
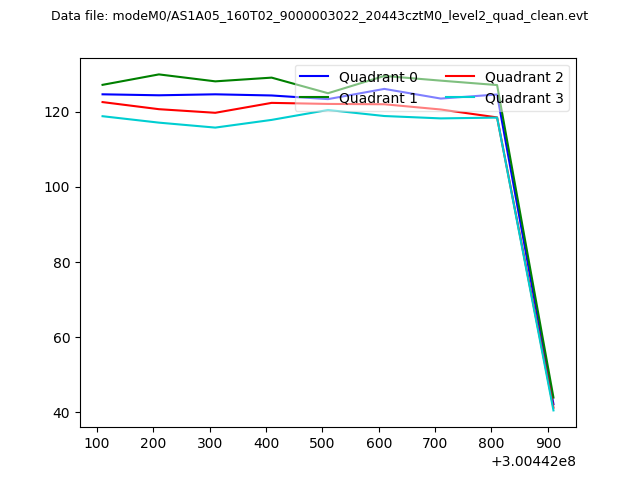 |
|
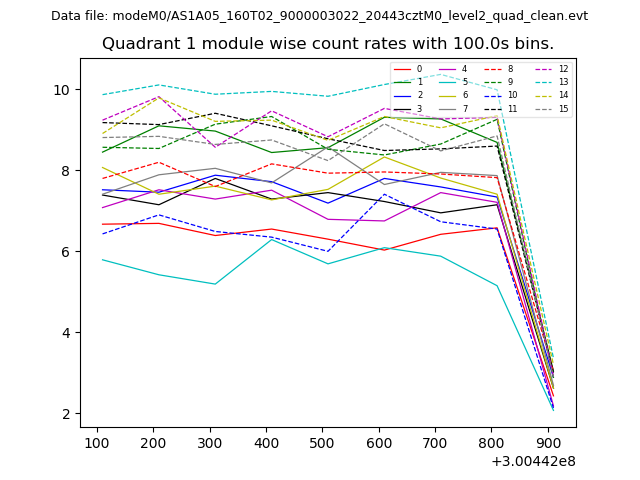
| Module-wise count rates for Quadrant A Data is divided into 100 sec bins |
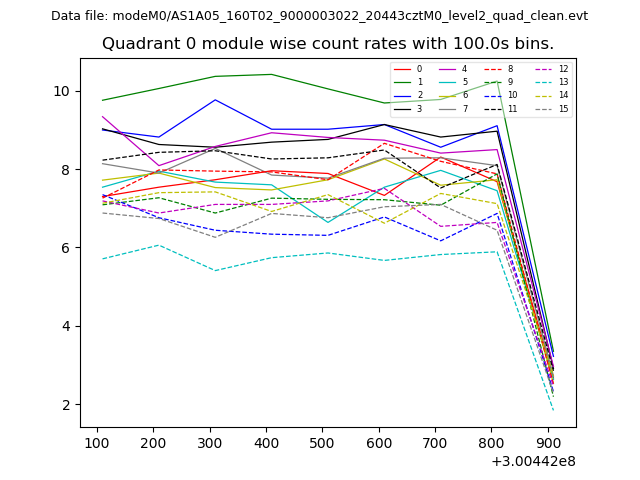 |
 |
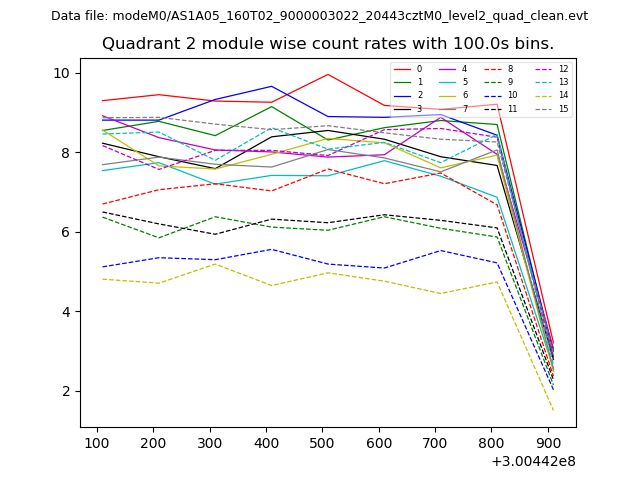
| Module-wise count rates for Quadrant B Data is divided into 100 sec bins |
 |
 |
| Module-wise count rates for Quadrant C Data is divided into 100 sec bins |
 |
 |
| Module-wise count rates for Quadrant D Data is divided into 100 sec bins |
 |
 |
| Parameter | Plot |
|---|---|
| CZT HV Monitor | 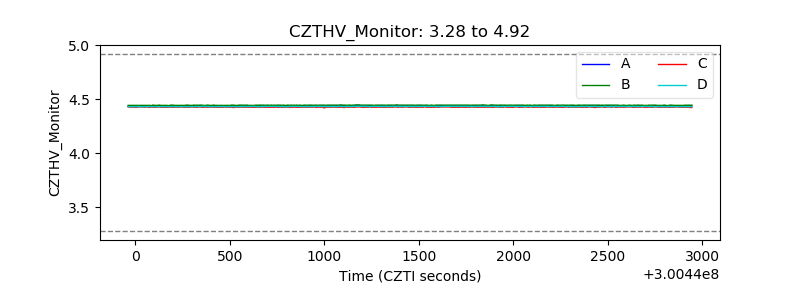 |
| D_VDD | 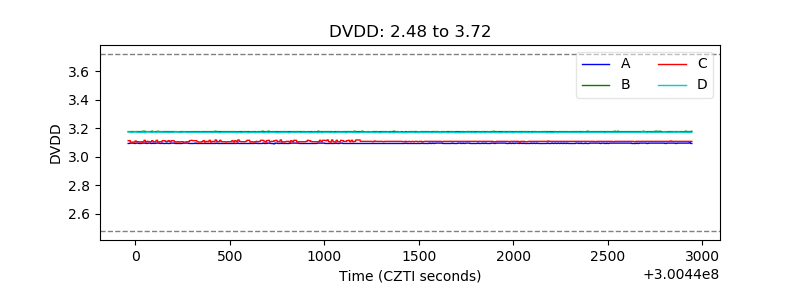 |
| Temperature 1 | 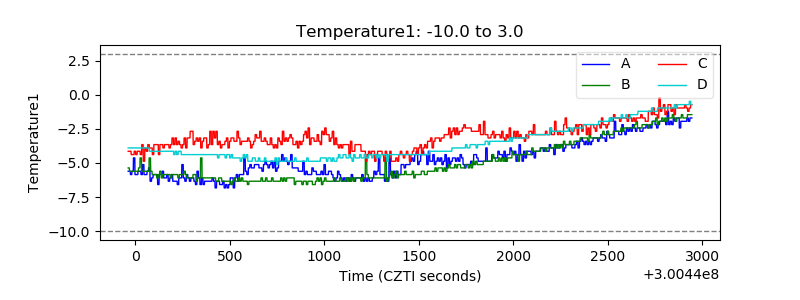 |
| Veto HV Monitor | 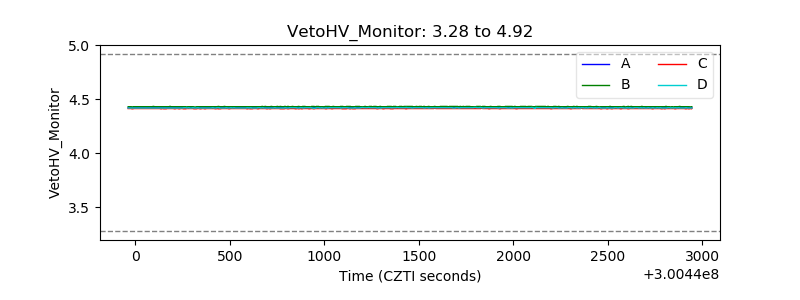 |
| Veto LLD | 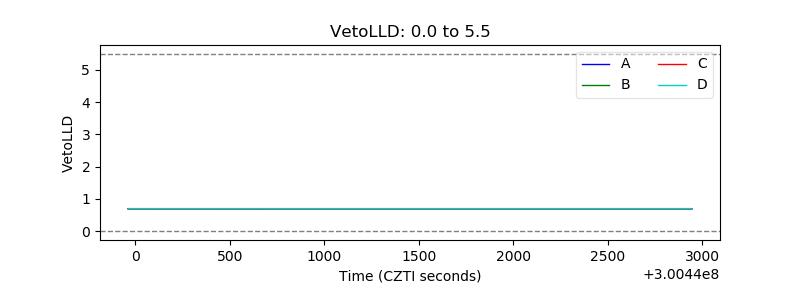 |
| Alpha Counter | 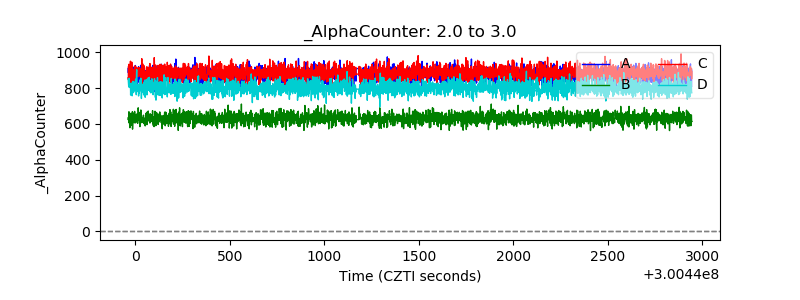 |
| _CPM_Rate | 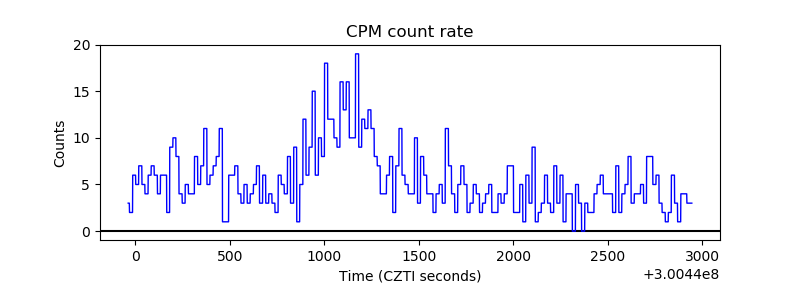 |
| CZT Counter | 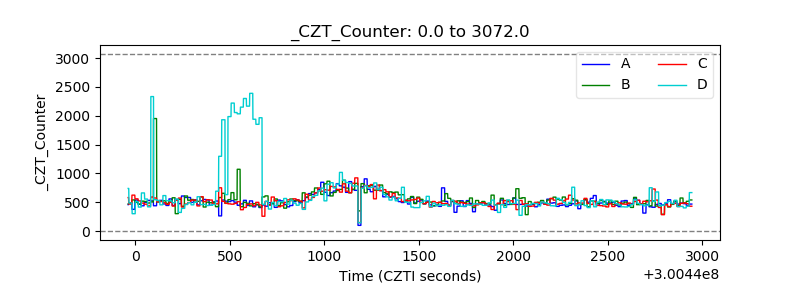 |
| +2.5 Volts monitor |  |
| +5 Volts monitor |  |
| _ROLL_ROT | 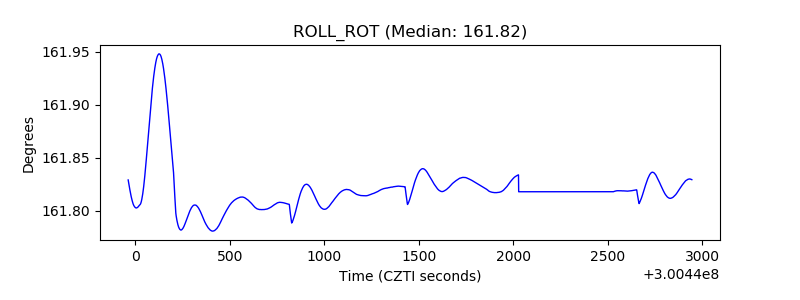 |
| _Roll_DEC | 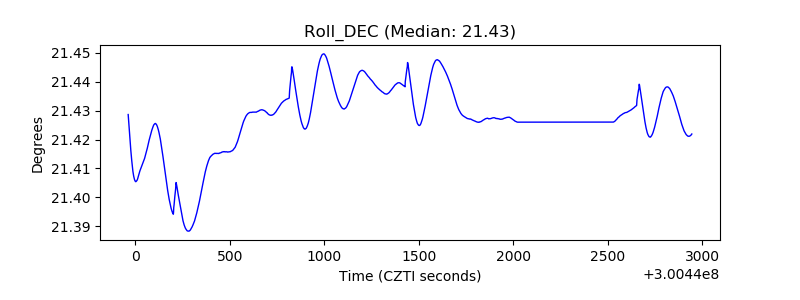 |
| _Roll_RA | 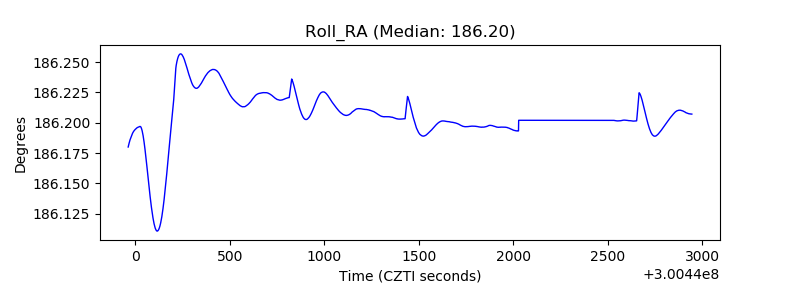 |
| Veto Counter | 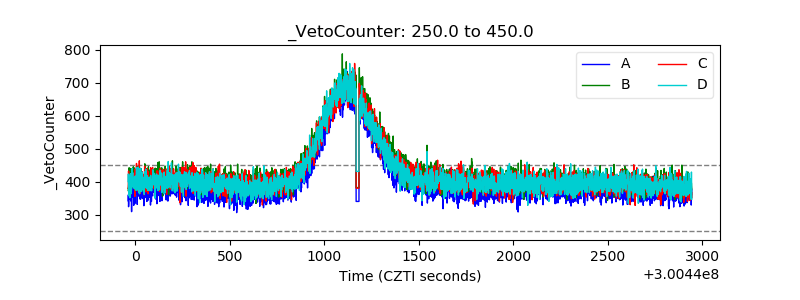 |