| Param | Original file | Final file |
|---|---|---|
| Filename | modeM0/AS1A05_160T02_9000003022_20444cztM0_level2.evt | modeM0/AS1A05_160T02_9000003022_20444cztM0_level2_quad_clean.evt |
| Size (bytes) | 573,960,960 | 96,065,280 |
| Size | 547.4 MB | 91.6 MB |
| Events in quadrant A | 3,826,933 | 610,618 |
| Events in quadrant B | 4,374,459 | 613,106 |
| Events in quadrant C | 3,791,683 | 588,338 |
| Events in quadrant D | 4,863,003 | 557,821 |
| Mode SS | |||
|---|---|---|---|
| Quadrant | BADHDUFLAG | Total packets | Discarded packets |
| A | 0 | 158 | 0 |
| B | 0 | 158 | 0 |
| C | 0 | 158 | 0 |
| D | 0 | 158 | 0 |
| Mode M0 | |||
|---|---|---|---|
| Quadrant | BADHDUFLAG | Total packets | Discarded packets |
| A | 0 | 16291 | 2 |
| B | 0 | 17763 | 2 |
| C | 0 | 16069 | 2 |
| D | 0 | 19552 | 2 |
| Mode M9 | |||
|---|---|---|---|
| Quadrant | BADHDUFLAG | Total packets | Discarded packets |
| A | 0 | 3 | 0 |
| B | 0 | 3 | 0 |
| C | 0 | 3 | 0 |
| D | 0 | 3 | 0 |
| Quadrant | Total seconds | Saturated seconds | Saturation percentage |
|---|---|---|---|
| A | 7750 | 247 | 3.187097% |
| B | 7750 | 312 | 4.025806% |
| C | 7750 | 260 | 3.354839% |
| D | 7751 | 505 | 6.515288% |
Noise dominated data is calculated using 1-second bins in cleaned event files. If a bin has >2000 counts, and if more than 50% of those come from <1% of pixels, then it is considered to be noise-dominated and hence unusable.
| Quadrant | # 1 sec bins | Bins with >0 counts | Bins with >2000 counts | High rate bins dominated by noise | Noise dominated (total time) | Noise dominated (detector-on time) | Marked lightcurve |
|---|---|---|---|---|---|---|---|
| A | 8105 | 7750 | 0 | 0 | 0.00% | 0.00% | 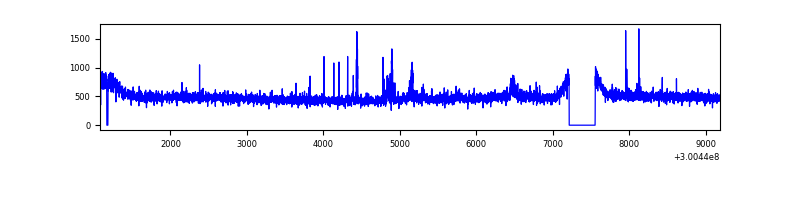 |
| B | 8105 | 7751 | 37 | 37 | 0.46% | 0.48% | 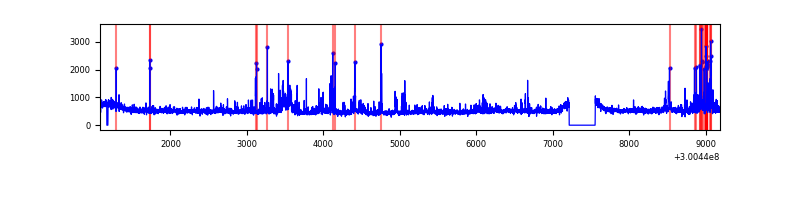 |
| C | 8105 | 7751 | 0 | 0 | 0.00% | 0.00% | 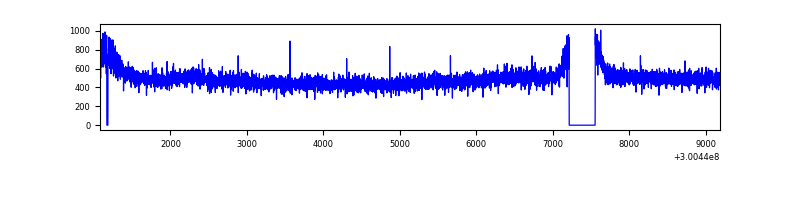 |
| D | 8106 | 7751 | 301 | 301 | 3.71% | 3.88% | 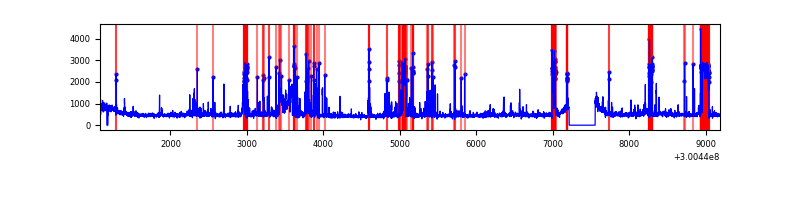 |
Top three noisy pixels from each quadrant. If the there are fewer than three noisy pixels in the level2.evt file, extra rows are filled as -1
| Pixel properties | Quadrant properties | ||||||
|---|---|---|---|---|---|---|---|
| Quadrant | DetID | PixID | Counts | Sigma | Mean | Median | Sigma |
| A | 12 | 16 | 79753 | 401.74 | 965 | 941 | 196.2 |
| A | 12 | 194 | 19293 | 93.55 | 965 | 941 | 196.2 |
| A | 15 | 222 | 12095 | 56.86 | 965 | 941 | 196.2 |
| B | 0 | 189 | 128480 | 690.63 | 956 | 929 | 184.7 |
| B | 0 | 197 | 122059 | 655.86 | 956 | 929 | 184.7 |
| B | 10 | 245 | 96778 | 518.98 | 956 | 929 | 184.7 |
| C | 14 | 238 | 143455 | 654.96 | 921 | 925 | 217.6 |
| C | 3 | 233 | 29690 | 132.18 | 921 | 925 | 217.6 |
| C | 9 | 54 | 13931 | 59.77 | 921 | 925 | 217.6 |
| D | 1 | 52 | 638422 | 2772.44 | 924 | 896 | 230.0 |
| D | 7 | 38 | 278400 | 1206.8 | 924 | 896 | 230.0 |
| D | 12 | 218 | 135498 | 585.35 | 924 | 896 | 230.0 |
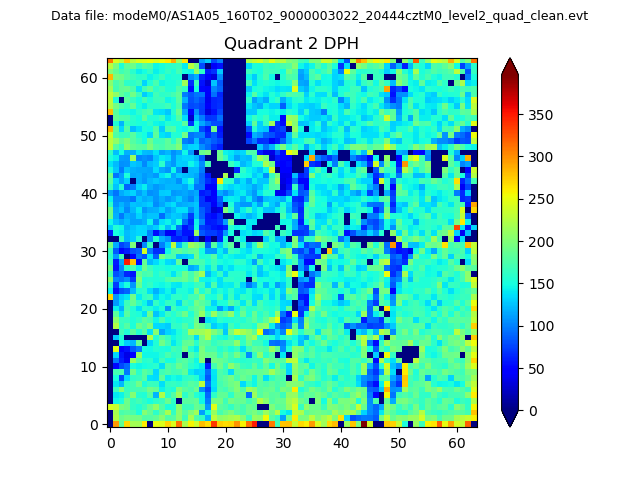
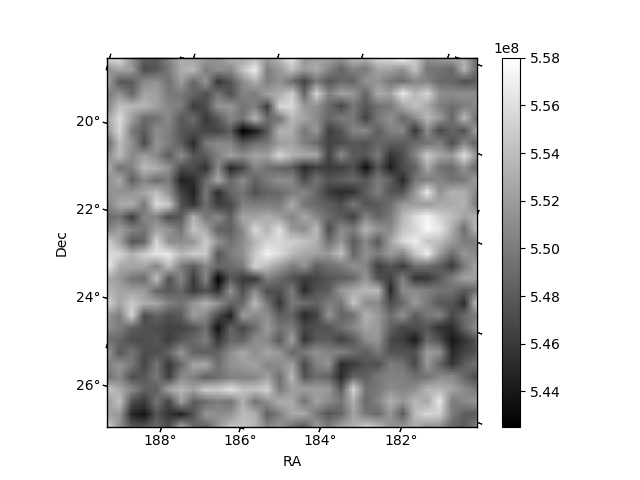
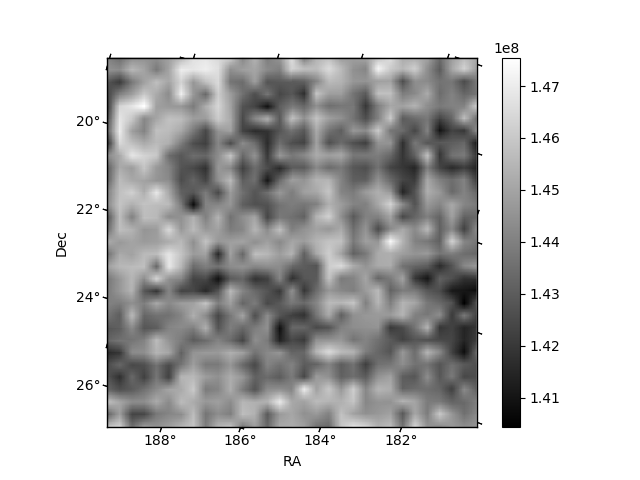
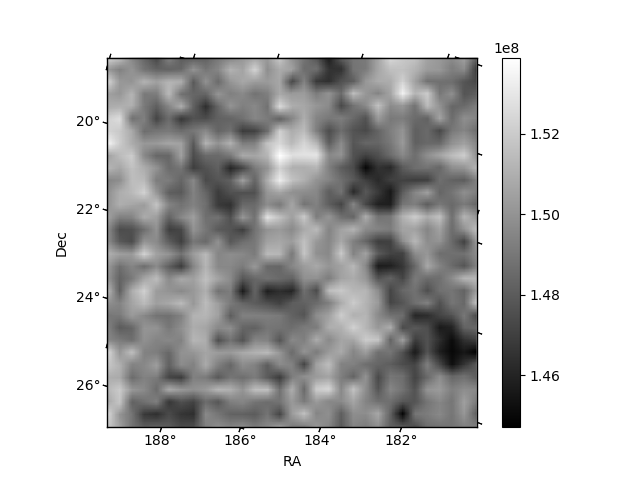
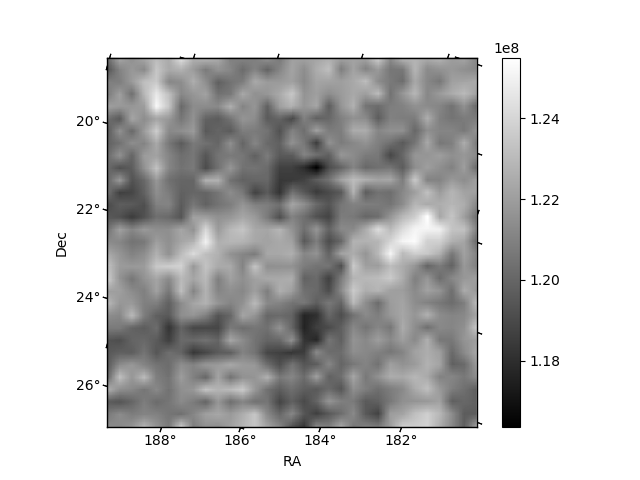
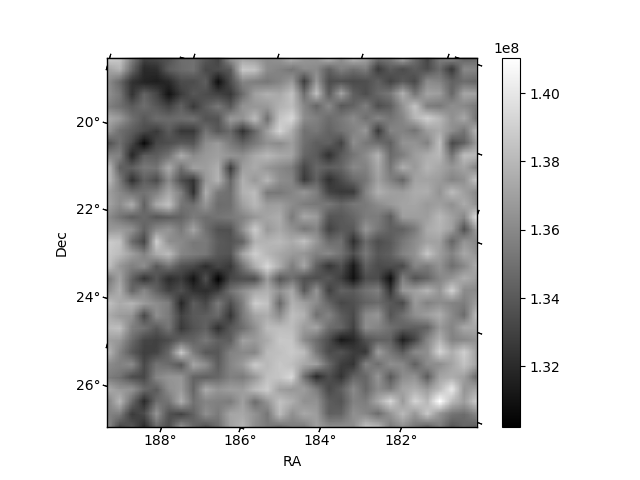
Histogram calculated using DETX and DETY for each event in the final _common_clean file
| Quadrant A | 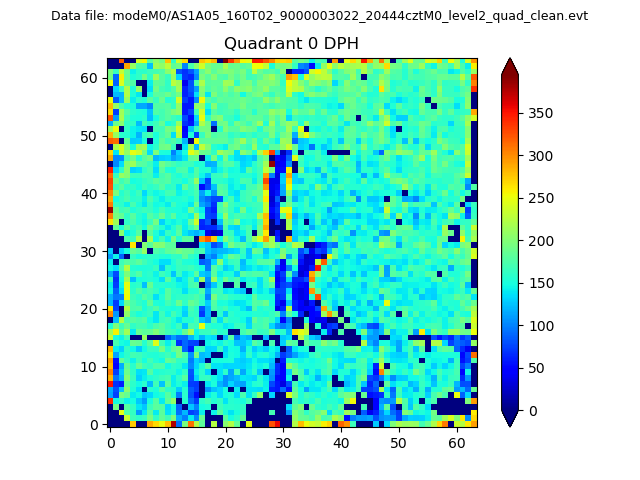 |
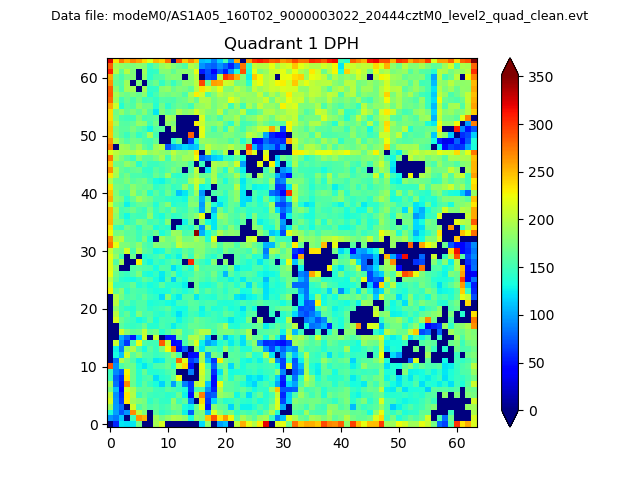 |
Quadrant B |
|---|---|---|---|
| Quadrant D | 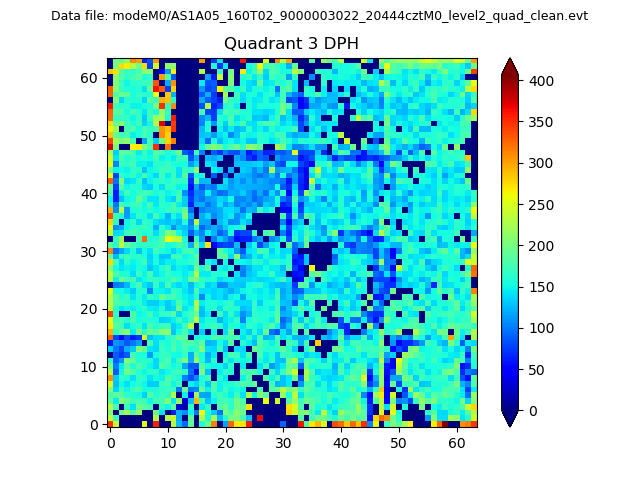 |
 |
Quadrant C |
| Plot type | Count rate plots | Images |
|---|---|---|
| Comparison with Poisson distribution Blue bars denote a histogram of data divided into 1 sec bins. Red curve is a Poisson curve with rate = median count rate of data. |
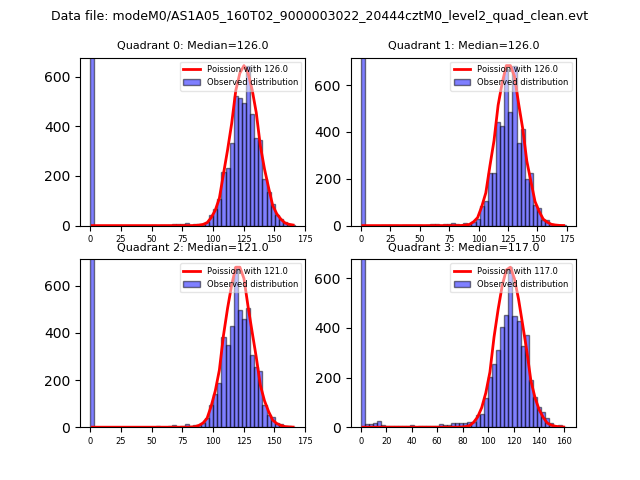 |
 |
| Quadrant-wise count rates Data is divided into 100 sec bins |
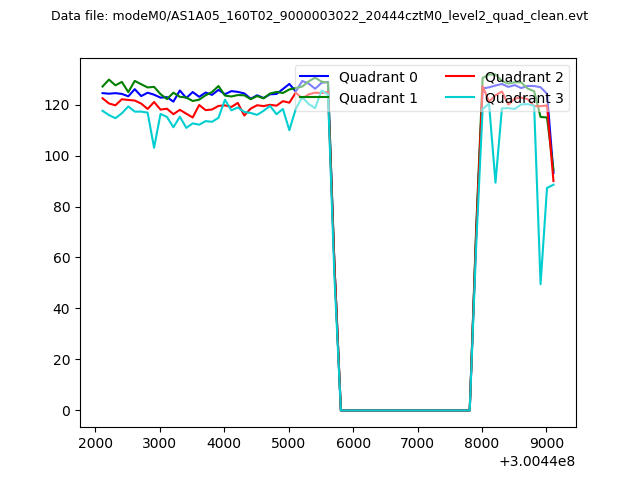 |
|
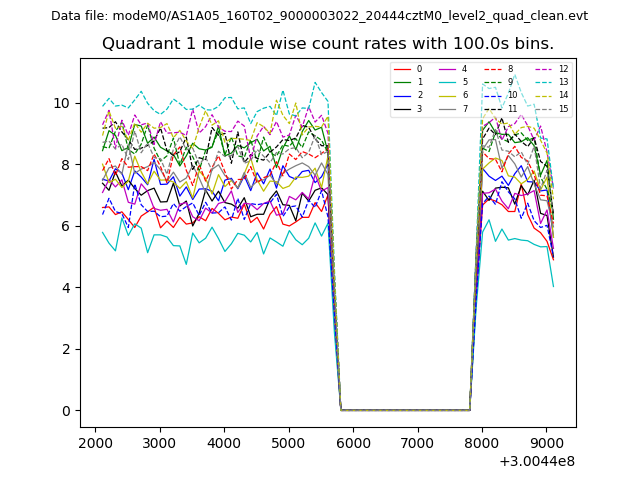
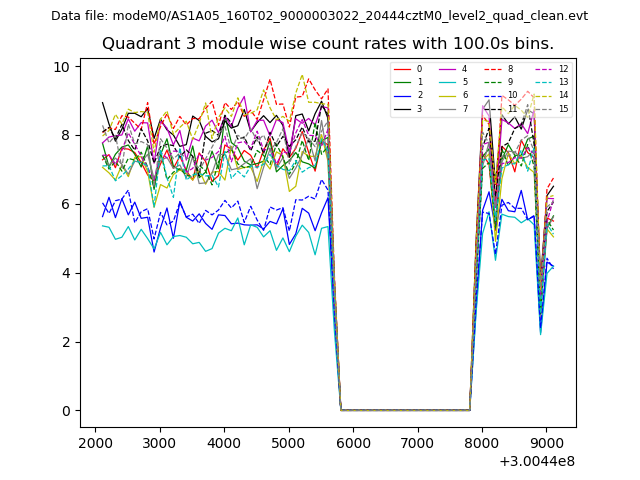
| Module-wise count rates for Quadrant A Data is divided into 100 sec bins |
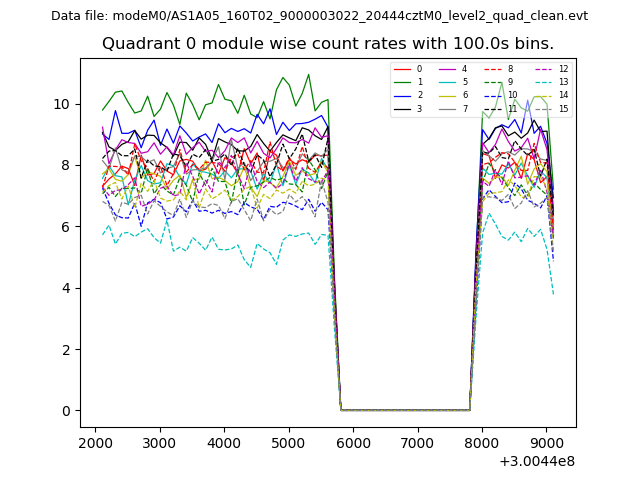 |
 |
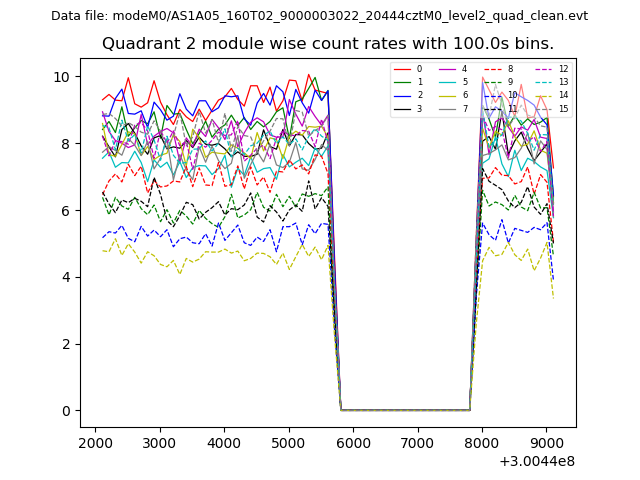
| Module-wise count rates for Quadrant B Data is divided into 100 sec bins |
 |
 |
| Module-wise count rates for Quadrant C Data is divided into 100 sec bins |
 |
 |
| Module-wise count rates for Quadrant D Data is divided into 100 sec bins |
 |
 |
| Parameter | Plot |
|---|---|
| CZT HV Monitor | 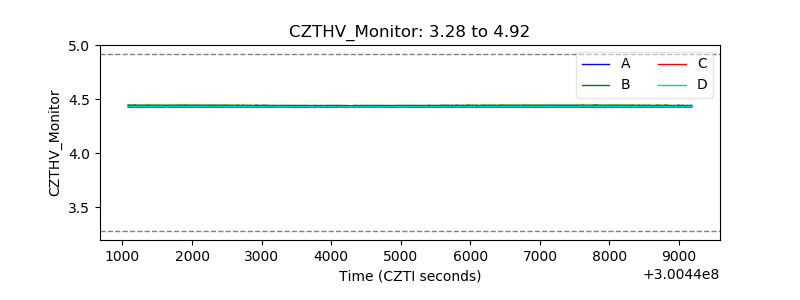 |
| D_VDD | 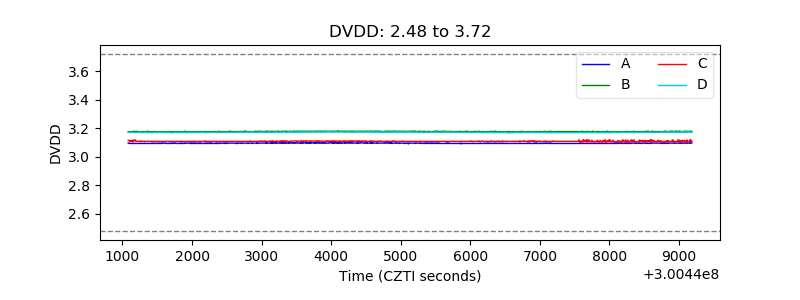 |
| Temperature 1 | 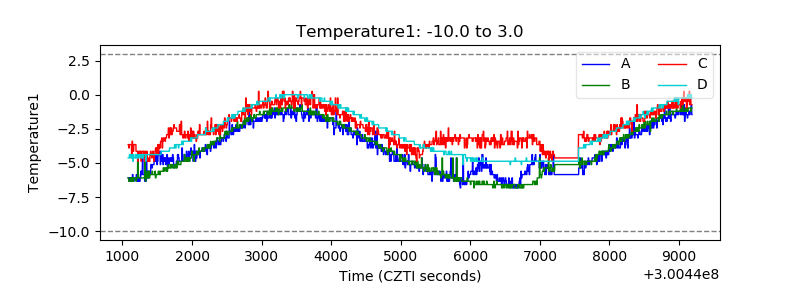 |
| Veto HV Monitor | 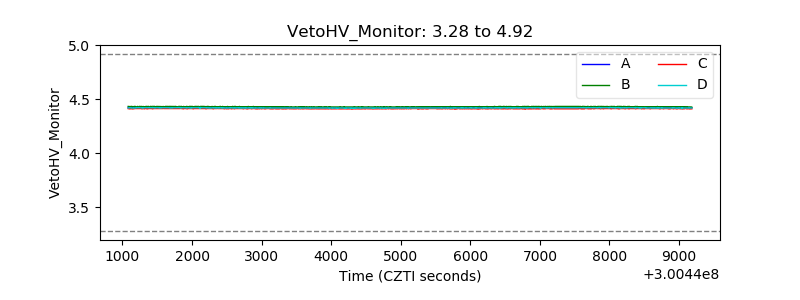 |
| Veto LLD | 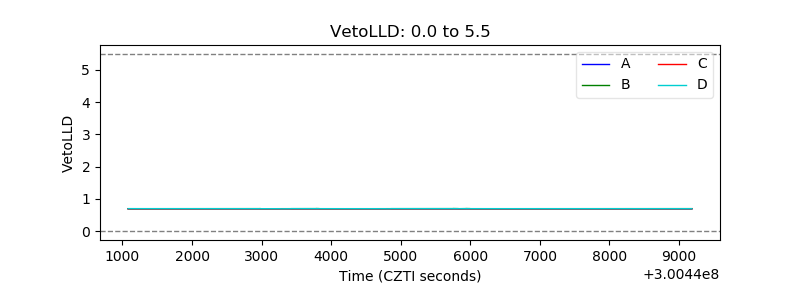 |
| Alpha Counter | 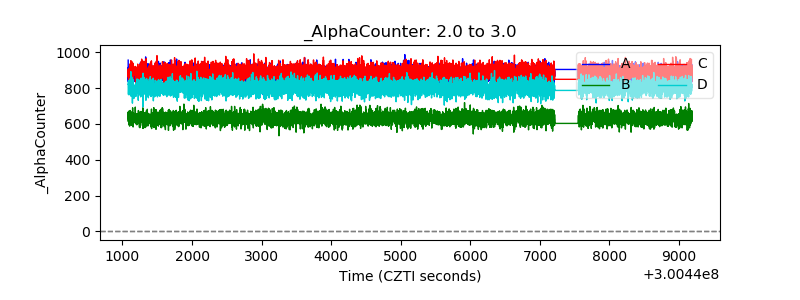 |
| _CPM_Rate | 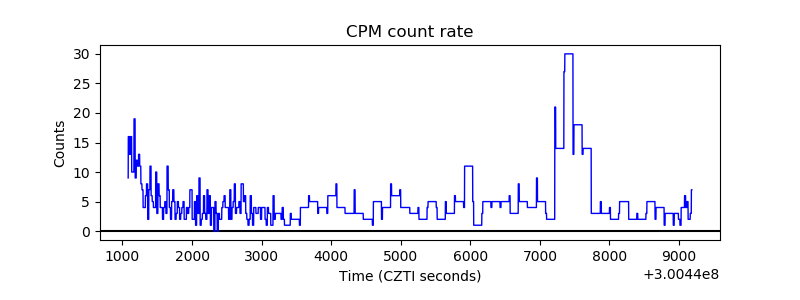 |
| CZT Counter | 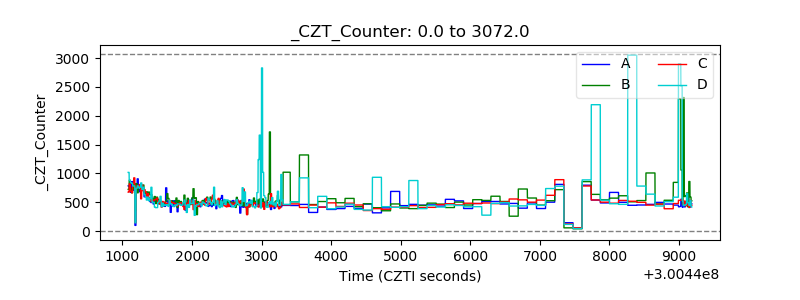 |
| +2.5 Volts monitor |  |
| +5 Volts monitor |  |
| _ROLL_ROT | 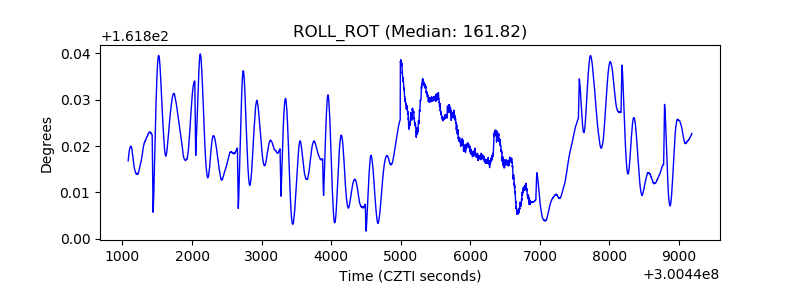 |
| _Roll_DEC | 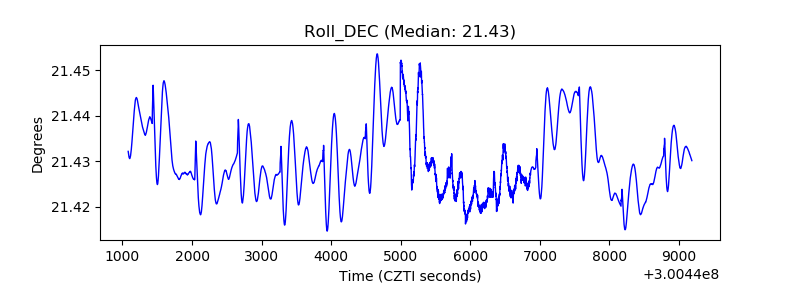 |
| _Roll_RA | 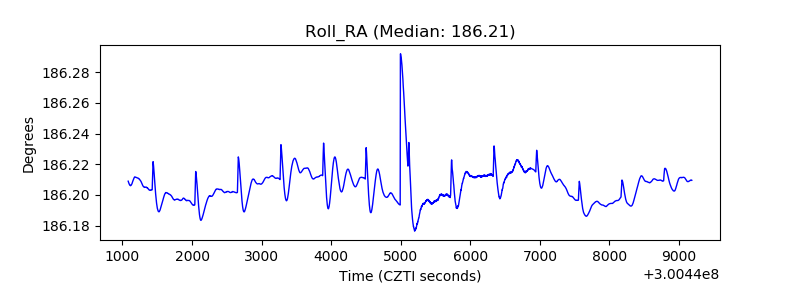 |
| Veto Counter | 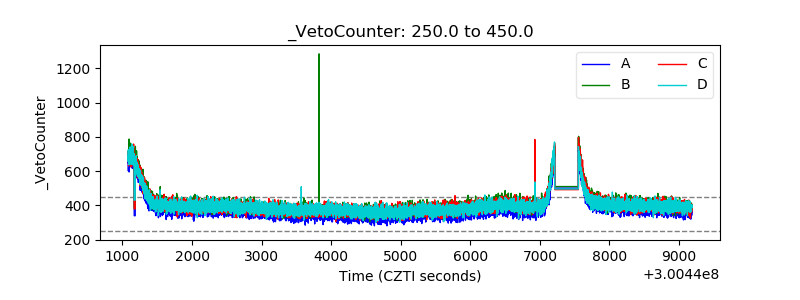 |