| Param | Original file | Final file |
|---|---|---|
| Filename | modeM0/AS1A05_160T02_9000003022_20446cztM0_level2.evt | modeM0/AS1A05_160T02_9000003022_20446cztM0_level2_quad_clean.evt |
| Size (bytes) | 980,887,680 | 170,118,720 |
| Size | 935.4 MB | 162.2 MB |
| Events in quadrant A | 6,477,379 | 1,104,734 |
| Events in quadrant B | 7,198,524 | 1,105,587 |
| Events in quadrant C | 6,254,035 | 1,062,847 |
| Events in quadrant D | 8,902,189 | 985,749 |
| Mode SS | |||
|---|---|---|---|
| Quadrant | BADHDUFLAG | Total packets | Discarded packets |
| A | 0 | 260 | 0 |
| B | 0 | 260 | 0 |
| C | 0 | 260 | 0 |
| D | 0 | 260 | 0 |
| Mode M0 | |||
|---|---|---|---|
| Quadrant | BADHDUFLAG | Total packets | Discarded packets |
| A | 0 | 27577 | 3 |
| B | 0 | 29621 | 3 |
| C | 0 | 26590 | 3 |
| D | 0 | 35149 | 3 |
| Mode M9 | |||
|---|---|---|---|
| Quadrant | BADHDUFLAG | Total packets | Discarded packets |
| A | 0 | 14 | 0 |
| B | 0 | 14 | 0 |
| C | 0 | 14 | 0 |
| D | 0 | 14 | 0 |
| Quadrant | Total seconds | Saturated seconds | Saturation percentage |
|---|---|---|---|
| A | 12931 | 323 | 2.497873% |
| B | 12932 | 278 | 2.149706% |
| C | 12931 | 194 | 1.500271% |
| D | 12931 | 938 | 7.253886% |
Noise dominated data is calculated using 1-second bins in cleaned event files. If a bin has >2000 counts, and if more than 50% of those come from <1% of pixels, then it is considered to be noise-dominated and hence unusable.
| Quadrant | # 1 sec bins | Bins with >0 counts | Bins with >2000 counts | High rate bins dominated by noise | Noise dominated (total time) | Noise dominated (detector-on time) | Marked lightcurve |
|---|---|---|---|---|---|---|---|
| A | 14201 | 12931 | 18 | 18 | 0.13% | 0.14% | 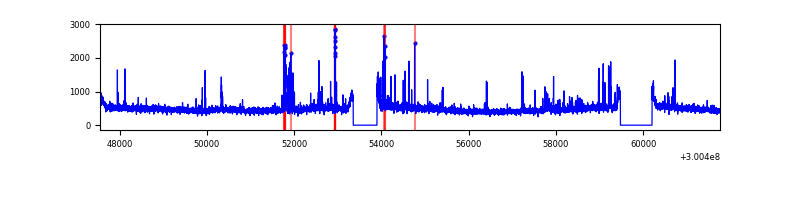 |
| B | 14202 | 12932 | 66 | 66 | 0.46% | 0.51% | 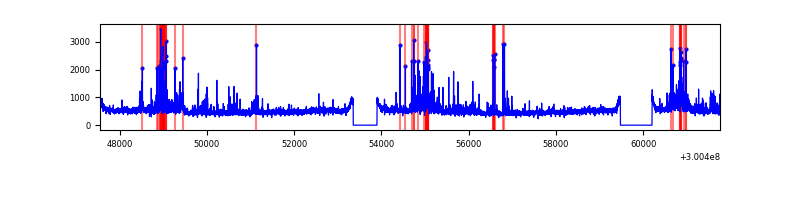 |
| C | 14201 | 12931 | 0 | 0 | 0.00% | 0.00% | 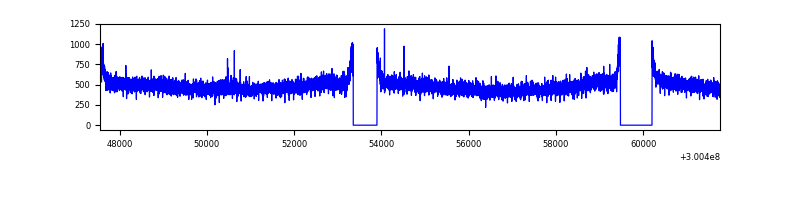 |
| D | 14201 | 12931 | 718 | 718 | 5.06% | 5.55% | 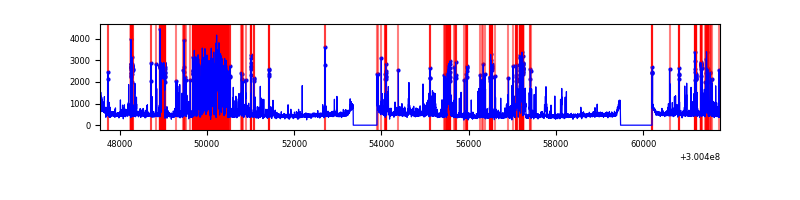 |
Top three noisy pixels from each quadrant. If the there are fewer than three noisy pixels in the level2.evt file, extra rows are filled as -1
| Pixel properties | Quadrant properties | ||||||
|---|---|---|---|---|---|---|---|
| Quadrant | DetID | PixID | Counts | Sigma | Mean | Median | Sigma |
| A | 15 | 222 | 258897 | 809.87 | 1563 | 1531 | 317.8 |
| A | 5 | 16 | 145871 | 454.21 | 1563 | 1531 | 317.8 |
| A | 14 | 111 | 43968 | 133.54 | 1563 | 1531 | 317.8 |
| B | 7 | 220 | 336406 | 1109.73 | 1568 | 1527 | 301.8 |
| B | 0 | 189 | 265233 | 873.88 | 1568 | 1527 | 301.8 |
| B | 0 | 197 | 146298 | 479.75 | 1568 | 1527 | 301.8 |
| C | 14 | 238 | 232903 | 653.76 | 1510 | 1517 | 353.9 |
| C | 3 | 233 | 104644 | 291.38 | 1510 | 1517 | 353.9 |
| C | 8 | 128 | 10734 | 26.04 | 1510 | 1517 | 353.9 |
| D | 12 | 218 | 1201246 | 3281.96 | 1494 | 1451 | 365.6 |
| D | 1 | 52 | 814157 | 2223.11 | 1494 | 1451 | 365.6 |
| D | 7 | 38 | 326531 | 889.24 | 1494 | 1451 | 365.6 |
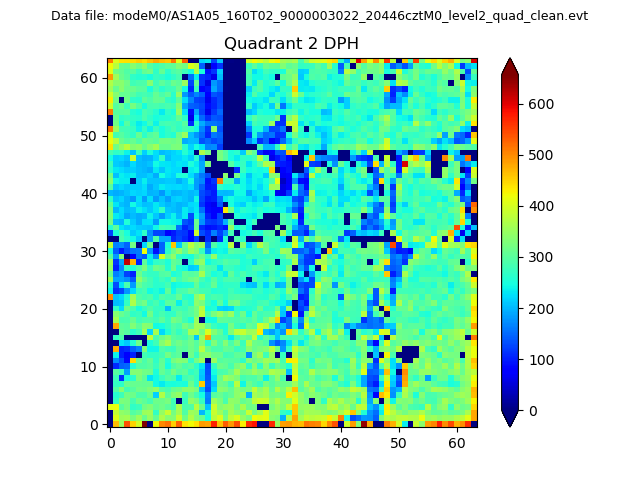
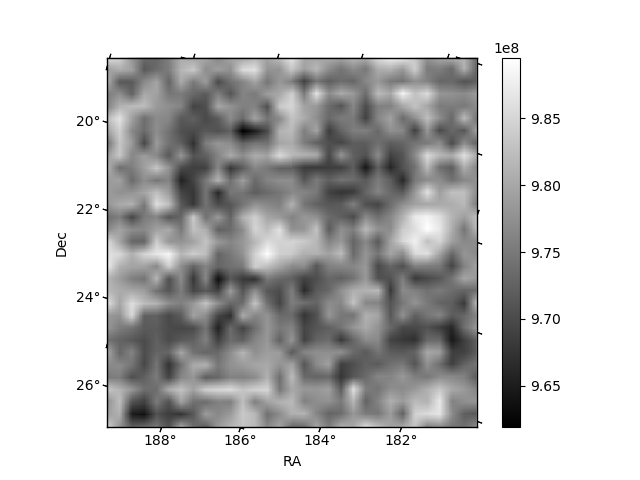
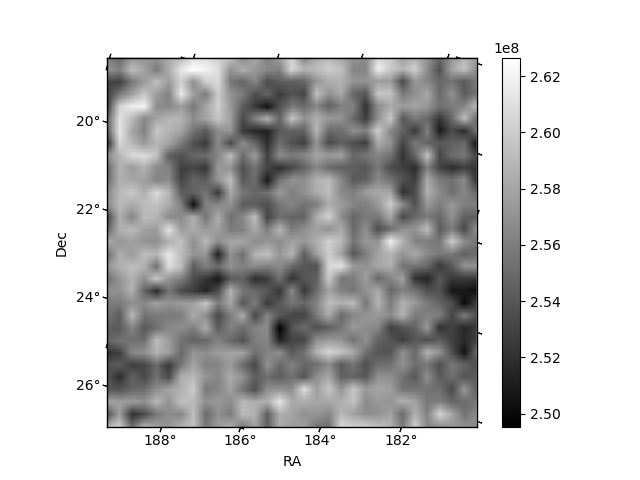
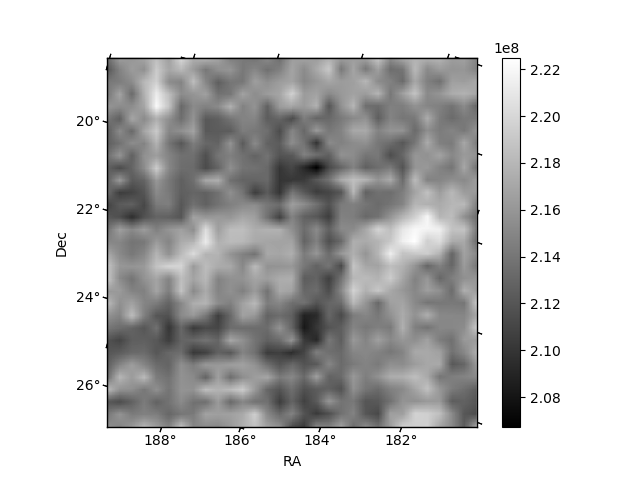
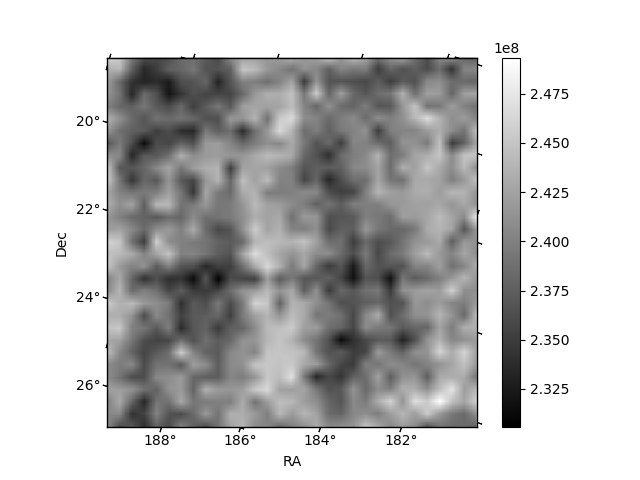
Histogram calculated using DETX and DETY for each event in the final _common_clean file
| Quadrant A | 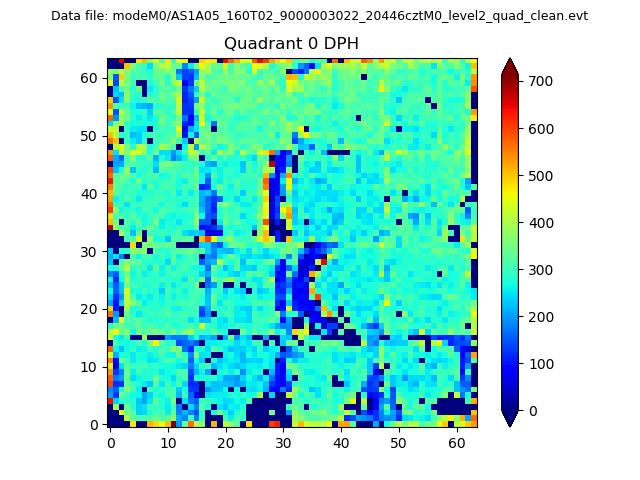 |
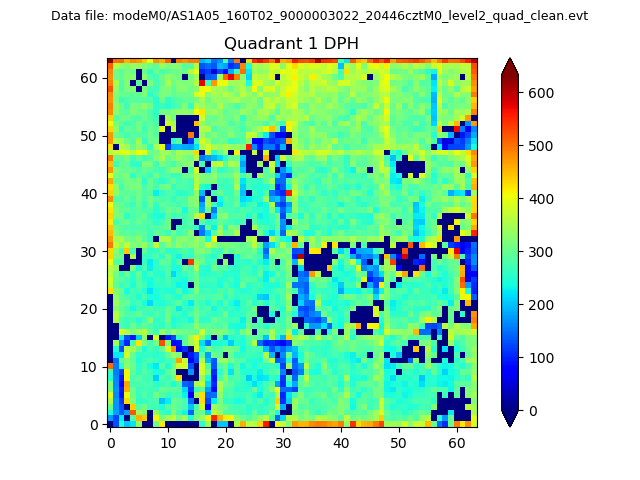 |
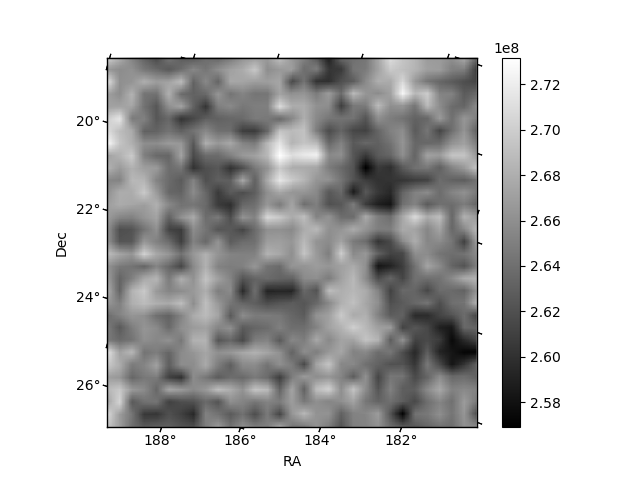
Quadrant B |
|---|---|---|---|
| Quadrant D | 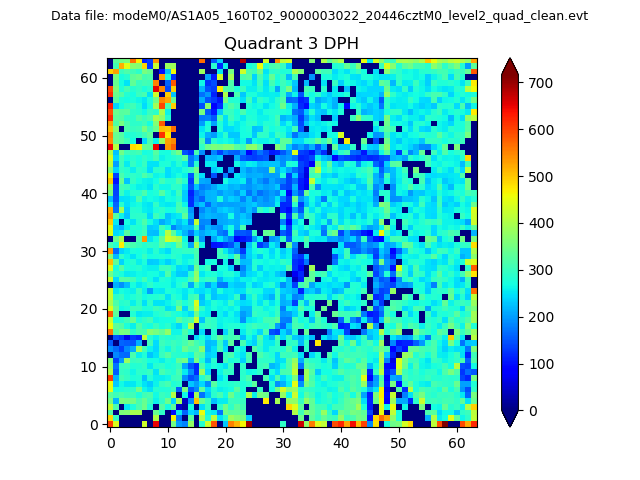 |
 |
Quadrant C |
| Plot type | Count rate plots | Images |
|---|---|---|
| Comparison with Poisson distribution Blue bars denote a histogram of data divided into 1 sec bins. Red curve is a Poisson curve with rate = median count rate of data. |
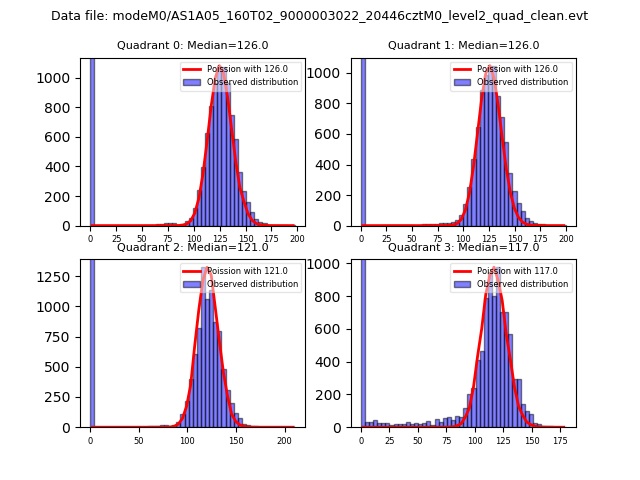 |
 |
| Quadrant-wise count rates Data is divided into 100 sec bins |
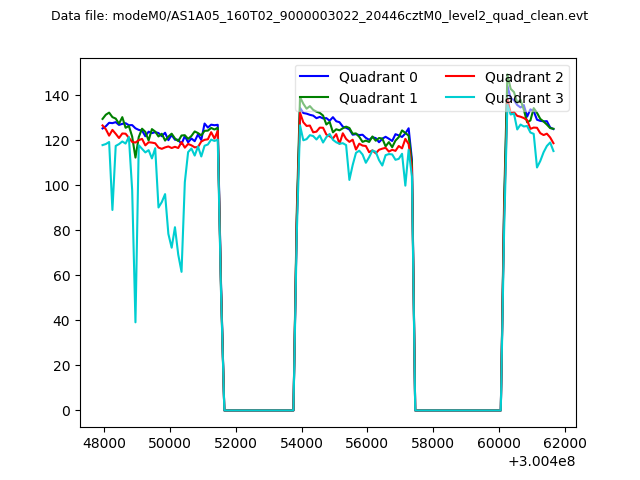 |
|
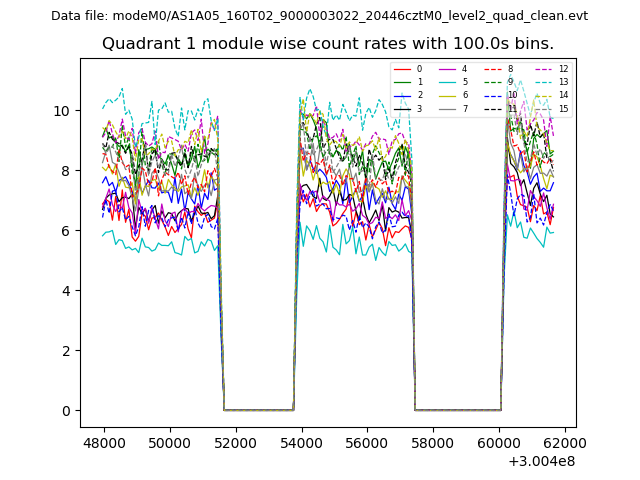
| Module-wise count rates for Quadrant A Data is divided into 100 sec bins |
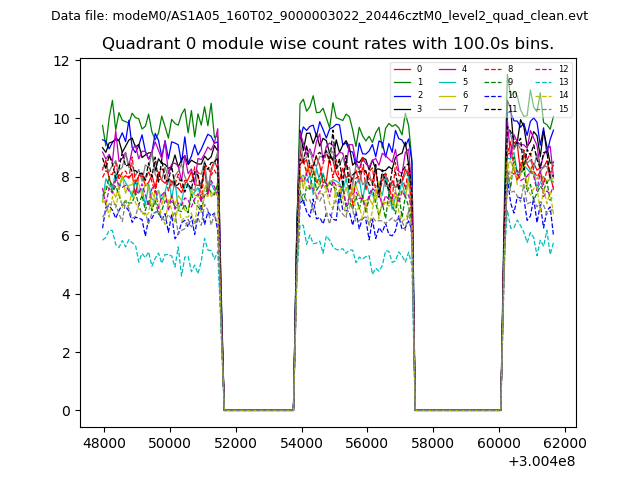 |
 |
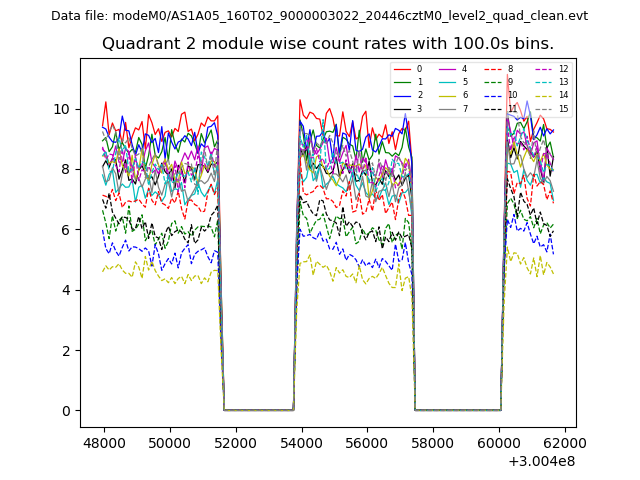
| Module-wise count rates for Quadrant B Data is divided into 100 sec bins |
 |
 |
| Module-wise count rates for Quadrant C Data is divided into 100 sec bins |
 |
 |
| Module-wise count rates for Quadrant D Data is divided into 100 sec bins |
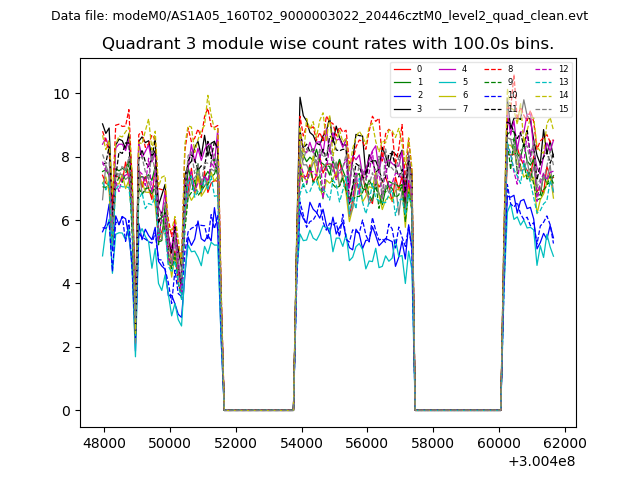 |
 |
| Parameter | Plot |
|---|---|
| CZT HV Monitor | 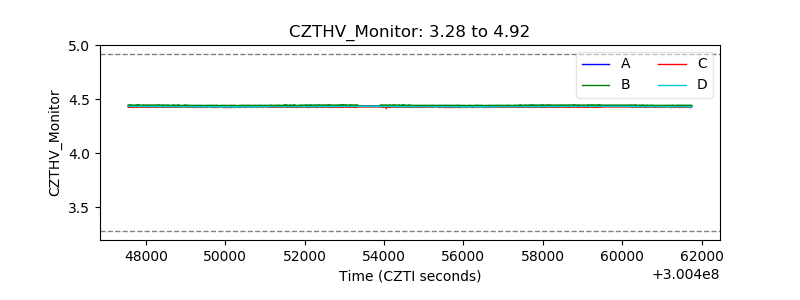 |
| D_VDD | 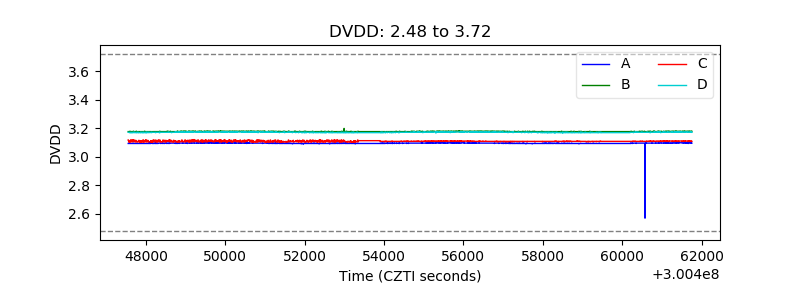 |
| Temperature 1 | 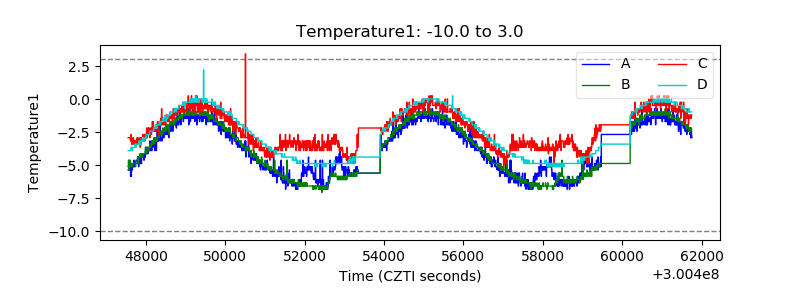 |
| Veto HV Monitor |  |
| Veto LLD | 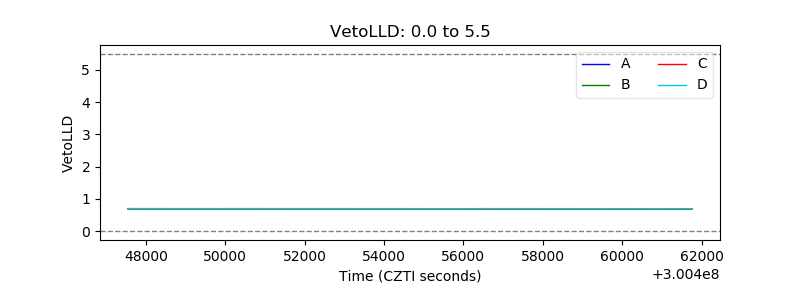 |
| Alpha Counter | 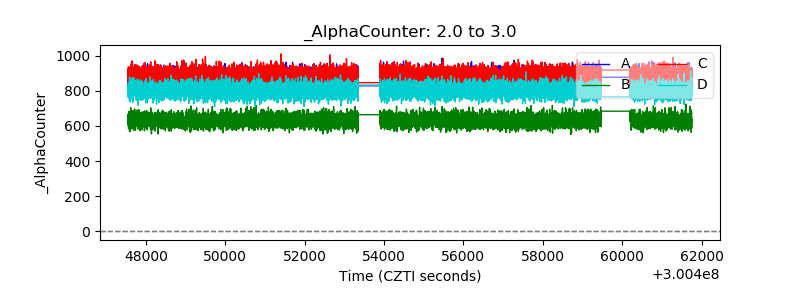 |
| _CPM_Rate | 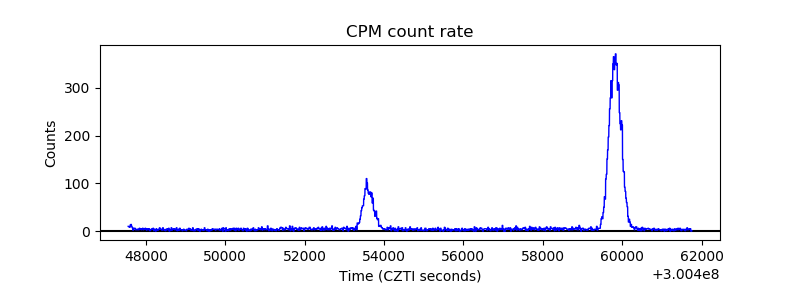 |
| CZT Counter | 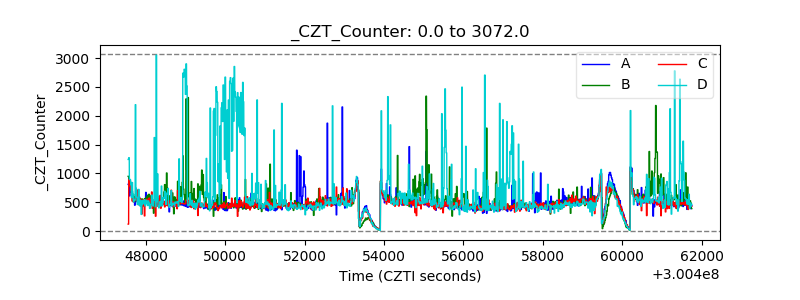 |
| +2.5 Volts monitor |  |
| +5 Volts monitor | 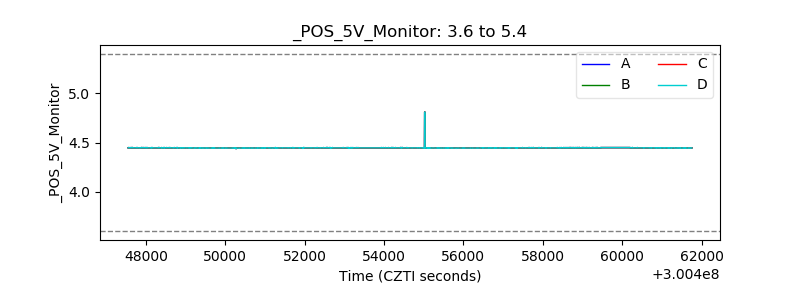 |
| _ROLL_ROT | 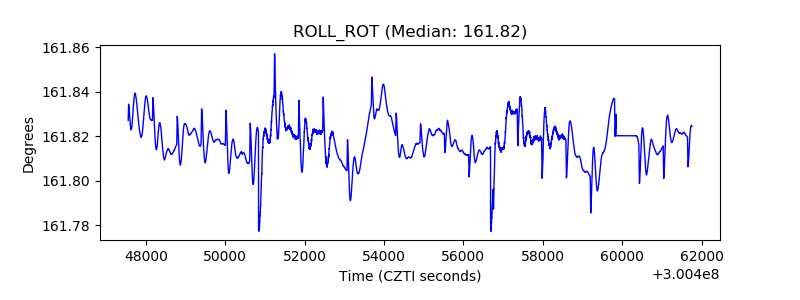 |
| _Roll_DEC | 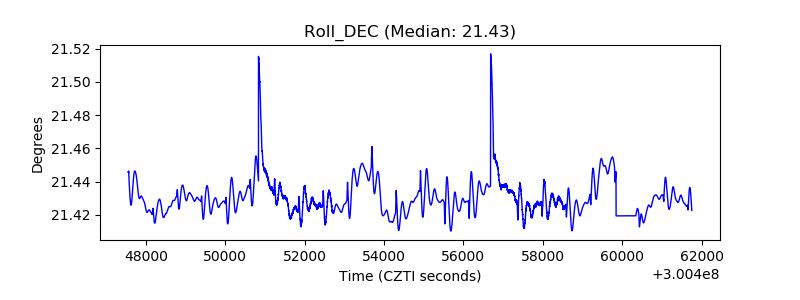 |
| _Roll_RA | 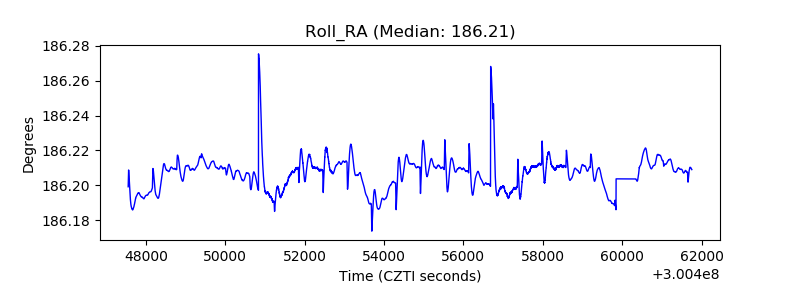 |
| Veto Counter | 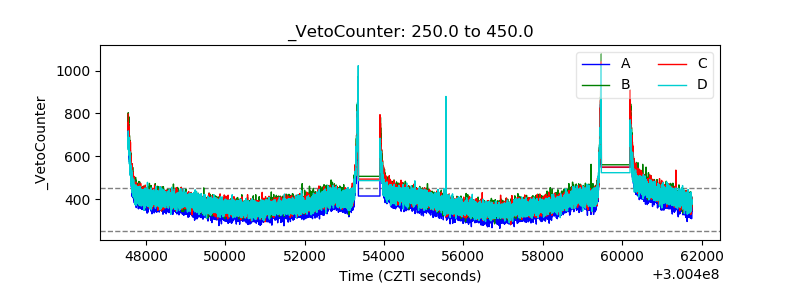 |