| Param | Original file | Final file |
|---|---|---|
| Filename | modeM0/AS1A05_160T02_9000003022_20451cztM0_level2.evt | modeM0/AS1A05_160T02_9000003022_20451cztM0_level2_quad_clean.evt |
| Size (bytes) | 1,176,615,360 | 203,477,760 |
| Size | 1.1 GB | 194.1 MB |
| Events in quadrant A | 7,795,374 | 1,305,024 |
| Events in quadrant B | 8,380,594 | 1,335,220 |
| Events in quadrant C | 8,101,845 | 1,253,620 |
| Events in quadrant D | 10,299,028 | 1,188,895 |
| Mode SS | |||
|---|---|---|---|
| Quadrant | BADHDUFLAG | Total packets | Discarded packets |
| A | 0 | 318 | 0 |
| B | 0 | 318 | 0 |
| C | 0 | 318 | 0 |
| D | 0 | 318 | 0 |
| Mode M0 | |||
|---|---|---|---|
| Quadrant | BADHDUFLAG | Total packets | Discarded packets |
| A | 0 | 33441 | 2 |
| B | 0 | 34887 | 2 |
| C | 0 | 34014 | 2 |
| D | 0 | 41303 | 2 |
| Mode M9 | |||
|---|---|---|---|
| Quadrant | BADHDUFLAG | Total packets | Discarded packets |
| A | 0 | 37 | 0 |
| B | 0 | 37 | 0 |
| C | 0 | 37 | 0 |
| D | 0 | 37 | 0 |
| Quadrant | Total seconds | Saturated seconds | Saturation percentage |
|---|---|---|---|
| A | 15654 | 138 | 0.881564% |
| B | 15654 | 157 | 1.002939% |
| C | 15654 | 185 | 1.181807% |
| D | 15655 | 552 | 3.526030% |
Noise dominated data is calculated using 1-second bins in cleaned event files. If a bin has >2000 counts, and if more than 50% of those come from <1% of pixels, then it is considered to be noise-dominated and hence unusable.
| Quadrant | # 1 sec bins | Bins with >0 counts | Bins with >2000 counts | High rate bins dominated by noise | Noise dominated (total time) | Noise dominated (detector-on time) | Marked lightcurve |
|---|---|---|---|---|---|---|---|
| A | 19275 | 15655 | 24 | 24 | 0.12% | 0.15% |  |
| B | 19275 | 15655 | 14 | 14 | 0.07% | 0.09% | 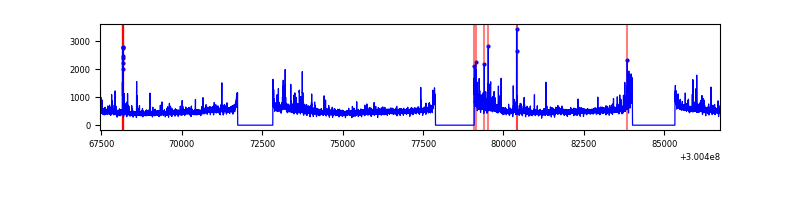 |
| C | 19275 | 15655 | 10 | 10 | 0.05% | 0.06% | 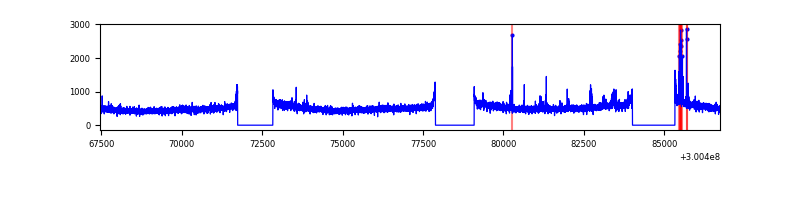 |
| D | 19276 | 15656 | 449 | 449 | 2.33% | 2.87% | 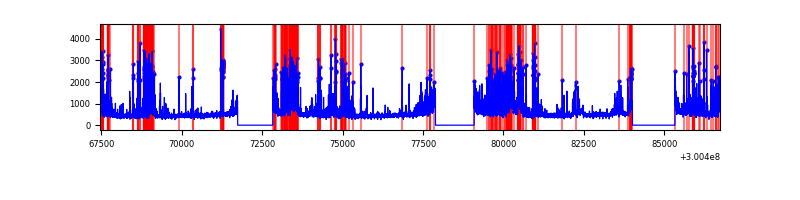 |
Top three noisy pixels from each quadrant. If the there are fewer than three noisy pixels in the level2.evt file, extra rows are filled as -1
| Pixel properties | Quadrant properties | ||||||
|---|---|---|---|---|---|---|---|
| Quadrant | DetID | PixID | Counts | Sigma | Mean | Median | Sigma |
| A | 15 | 222 | 123622 | 311.82 | 1943 | 1903 | 390.4 |
| A | 5 | 16 | 98804 | 248.24 | 1943 | 1903 | 390.4 |
| A | 12 | 16 | 56575 | 140.06 | 1943 | 1903 | 390.4 |
| B | 0 | 189 | 295891 | 806.29 | 1958 | 1914 | 364.6 |
| B | 7 | 220 | 71192 | 190.01 | 1958 | 1914 | 364.6 |
| B | 0 | 198 | 62397 | 165.89 | 1958 | 1914 | 364.6 |
| C | 14 | 238 | 293575 | 672.32 | 1870 | 1885 | 433.9 |
| C | 9 | 221 | 261714 | 598.89 | 1870 | 1885 | 433.9 |
| C | 3 | 233 | 239264 | 547.14 | 1870 | 1885 | 433.9 |
| D | 12 | 218 | 963517 | 2139.94 | 1857 | 1806 | 449.4 |
| D | 15 | 0 | 621371 | 1378.62 | 1857 | 1806 | 449.4 |
| D | 1 | 52 | 574824 | 1275.05 | 1857 | 1806 | 449.4 |
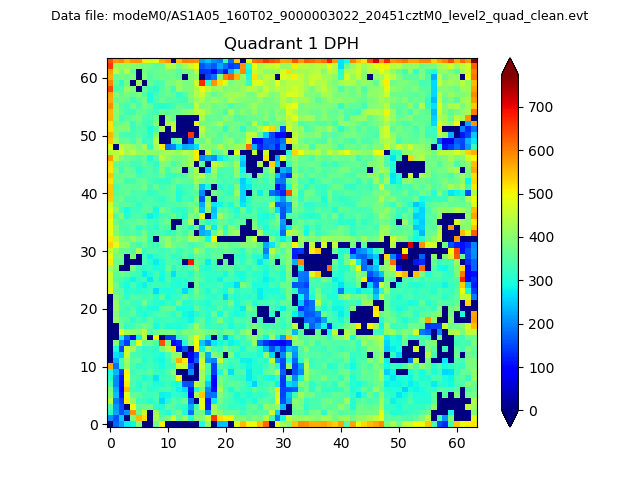
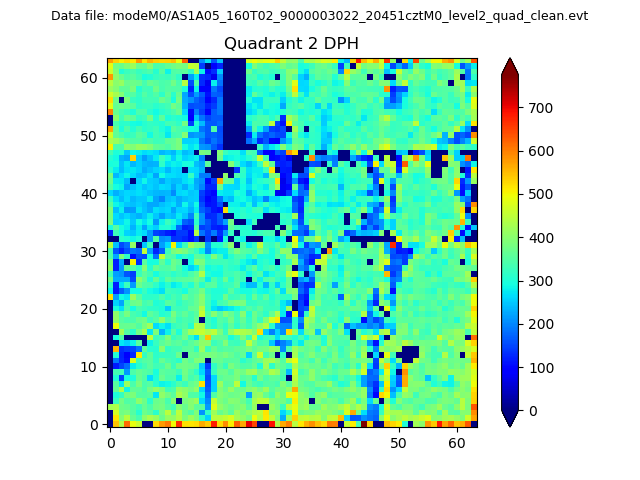
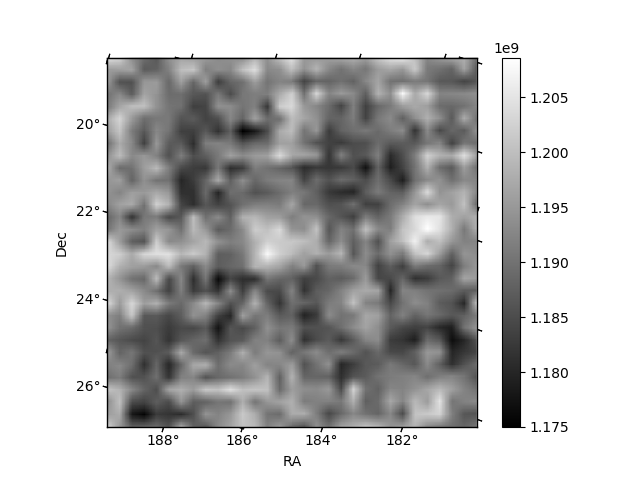
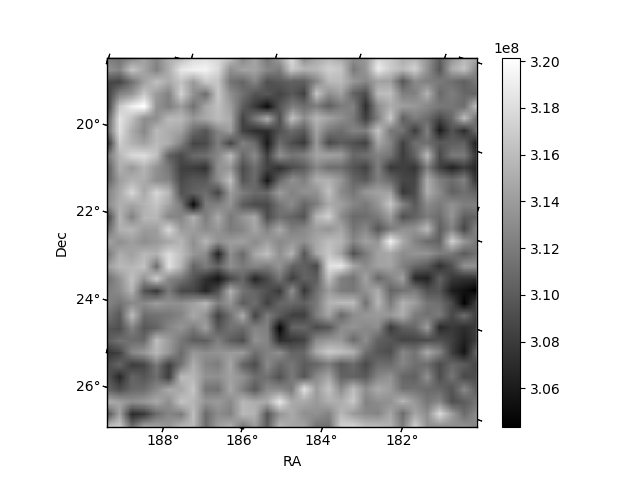
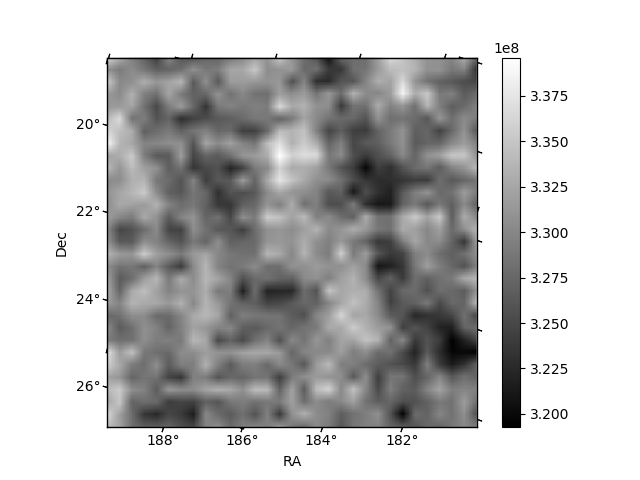
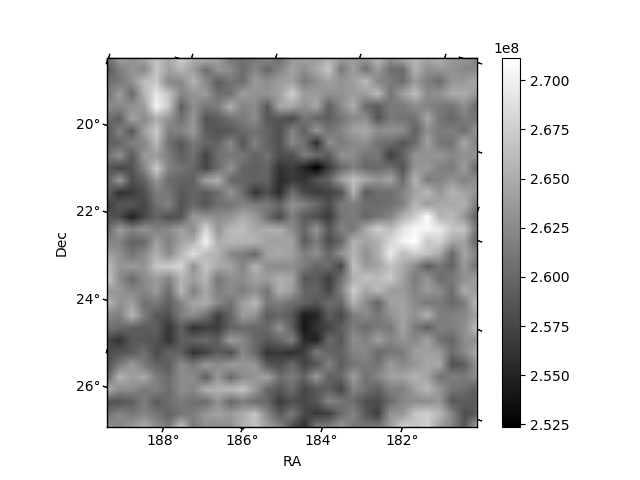
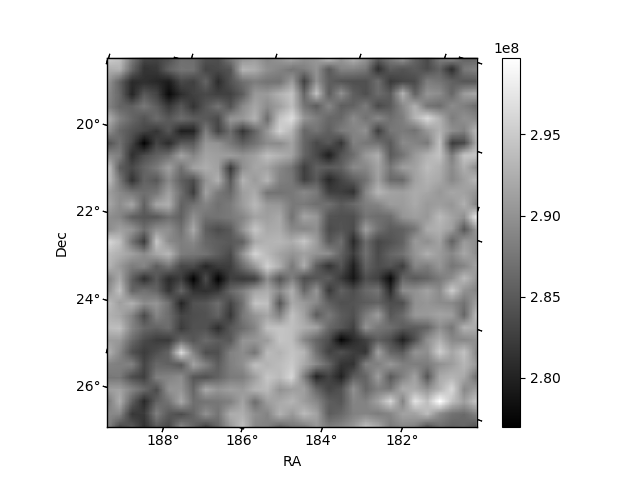
Histogram calculated using DETX and DETY for each event in the final _common_clean file
| Quadrant A | 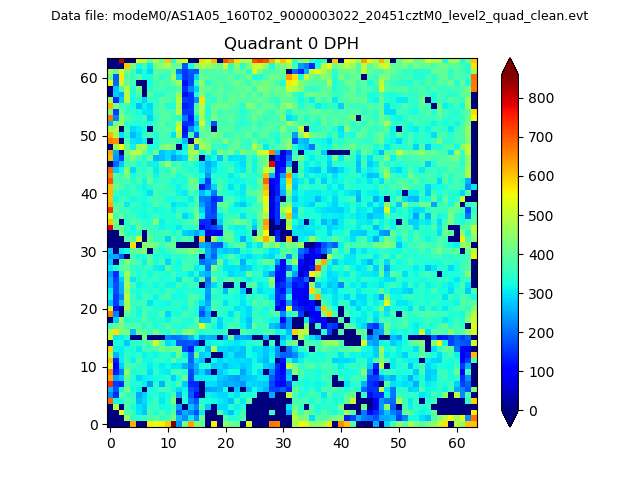 |
 |
Quadrant B |
|---|---|---|---|
| Quadrant D | 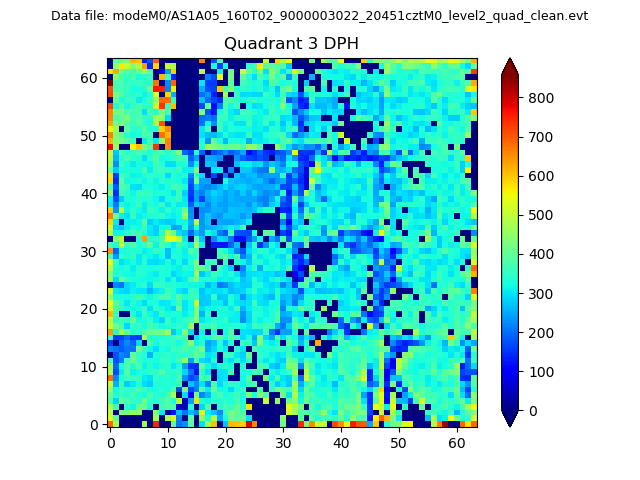 |
 |
Quadrant C |
| Plot type | Count rate plots | Images |
|---|---|---|
| Comparison with Poisson distribution Blue bars denote a histogram of data divided into 1 sec bins. Red curve is a Poisson curve with rate = median count rate of data. |
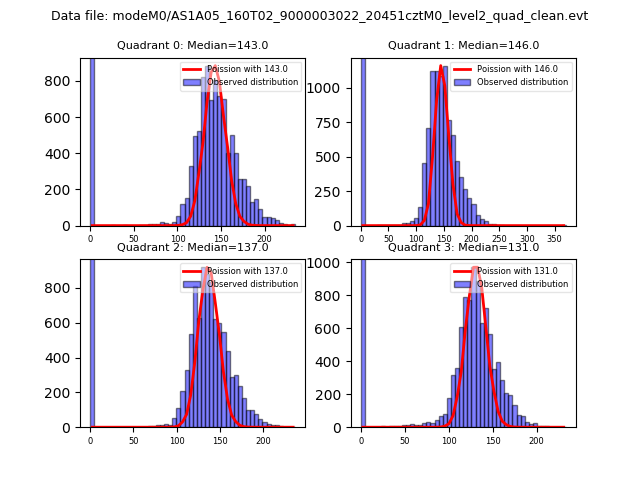 |
 |
| Quadrant-wise count rates Data is divided into 100 sec bins |
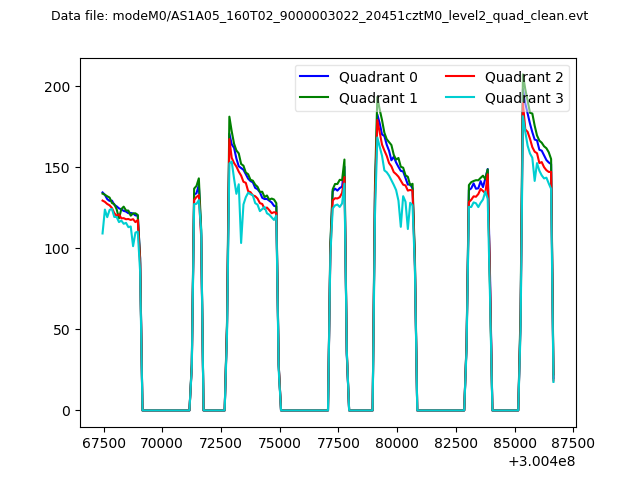 |
|
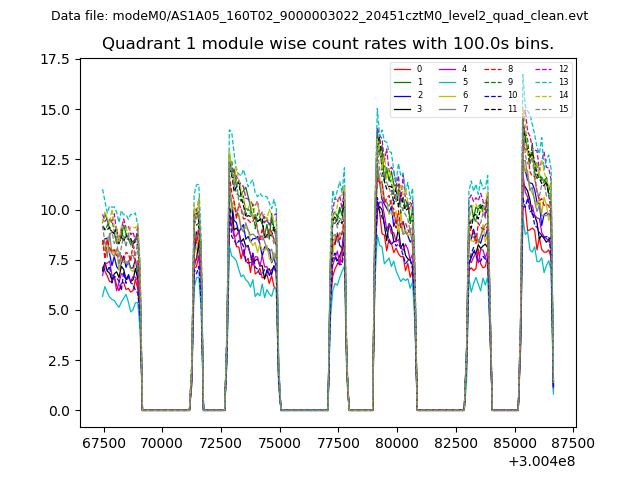
| Module-wise count rates for Quadrant A Data is divided into 100 sec bins |
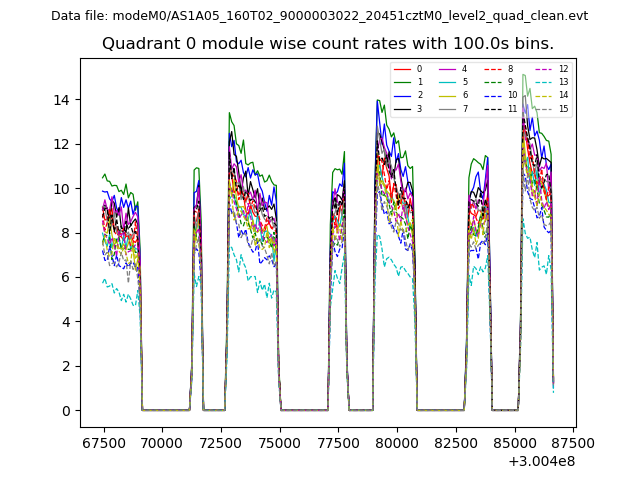 |
 |
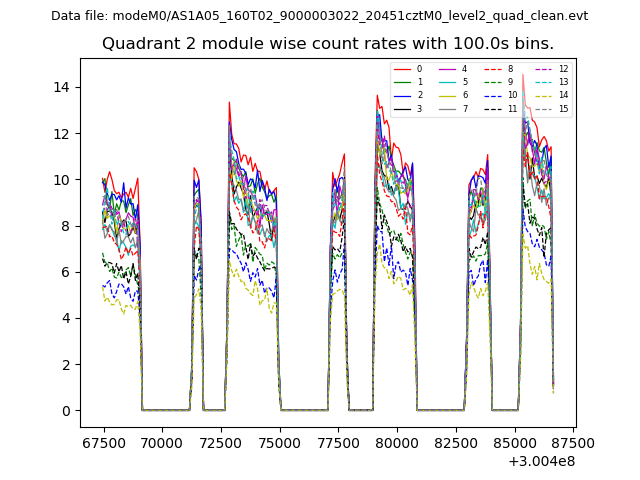
| Module-wise count rates for Quadrant B Data is divided into 100 sec bins |
 |
 |
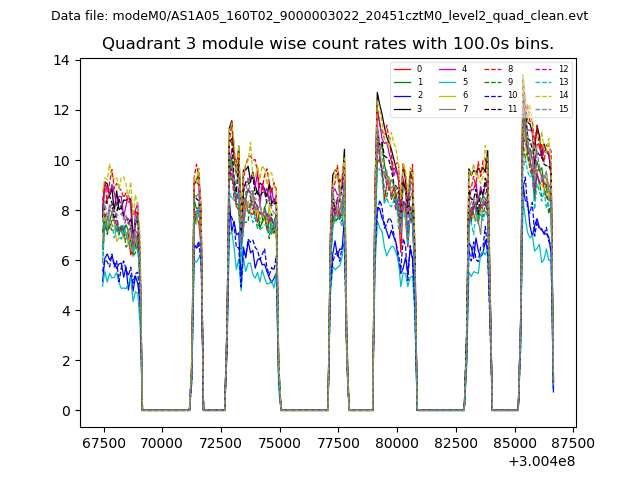
| Module-wise count rates for Quadrant C Data is divided into 100 sec bins |
 |
 |
| Module-wise count rates for Quadrant D Data is divided into 100 sec bins |
 |
 |
| Parameter | Plot |
|---|---|
| CZT HV Monitor | 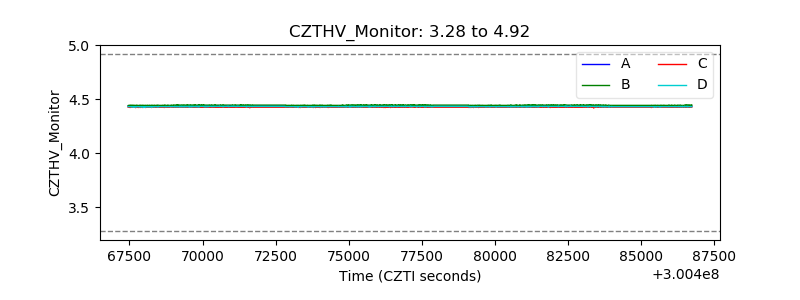 |
| D_VDD | 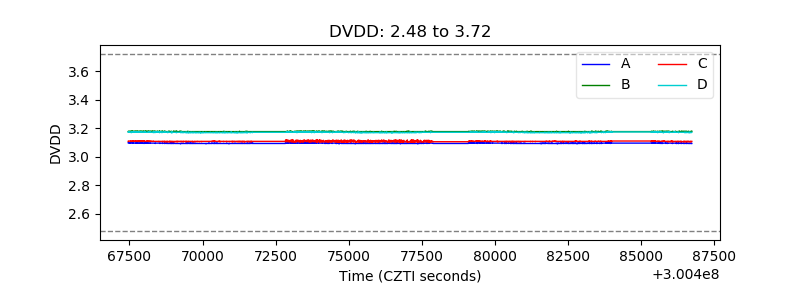 |
| Temperature 1 | 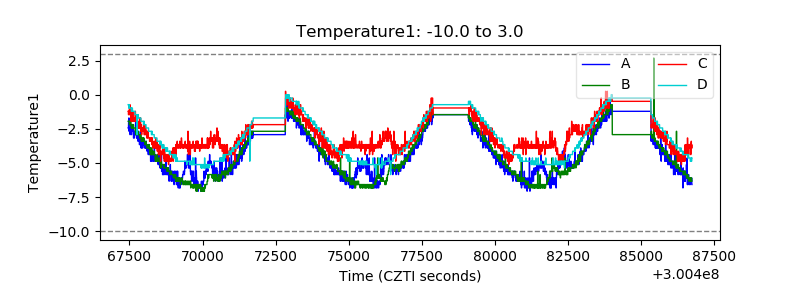 |
| Veto HV Monitor | 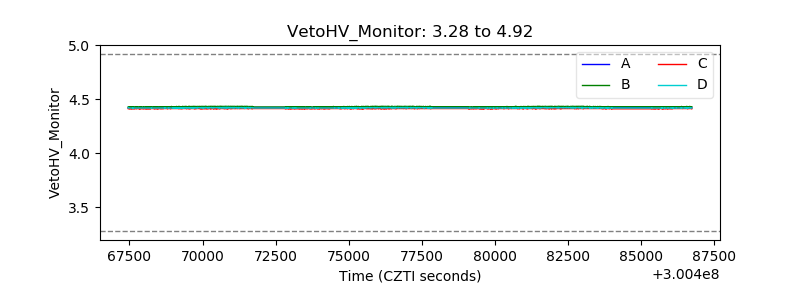 |
| Veto LLD | 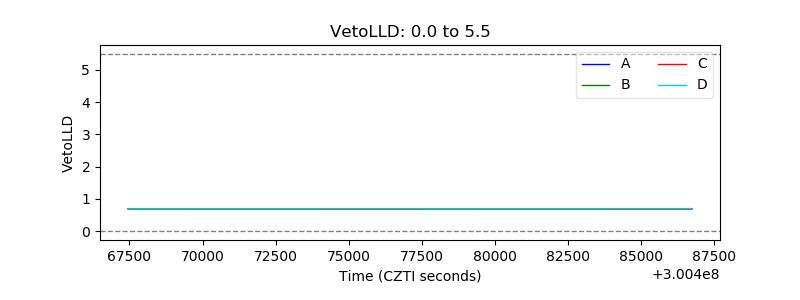 |
| Alpha Counter | 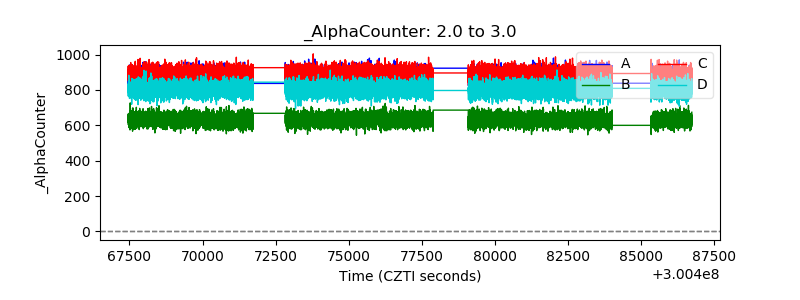 |
| _CPM_Rate | 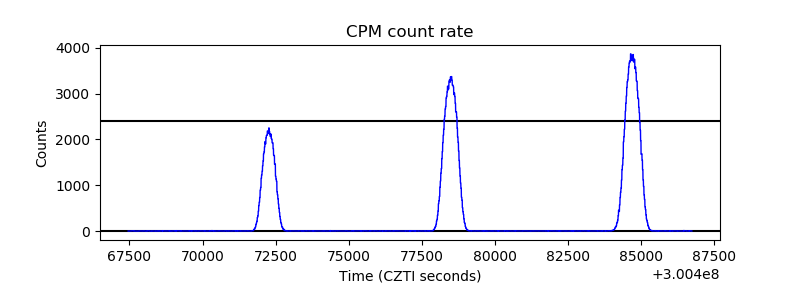 |
| CZT Counter | 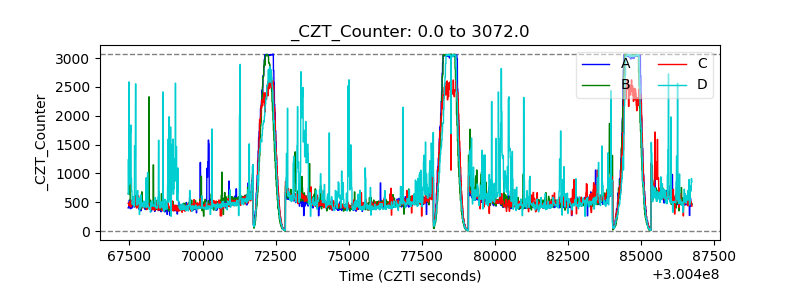 |
| +2.5 Volts monitor |  |
| +5 Volts monitor | 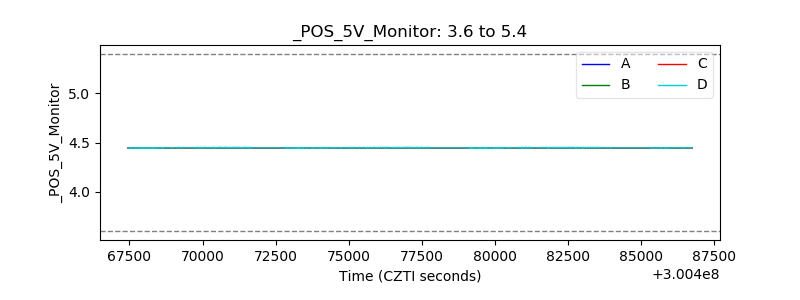 |
| _ROLL_ROT | 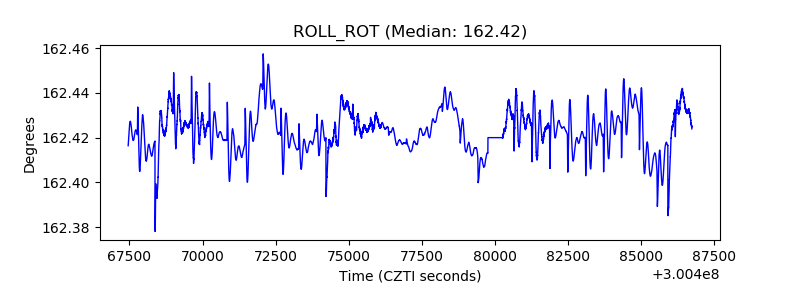 |
| _Roll_DEC | 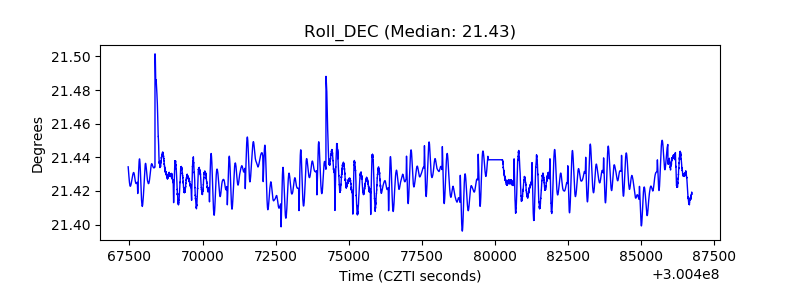 |
| _Roll_RA | 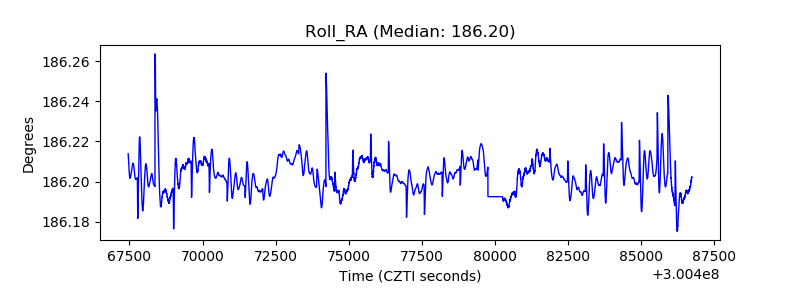 |
| Veto Counter | 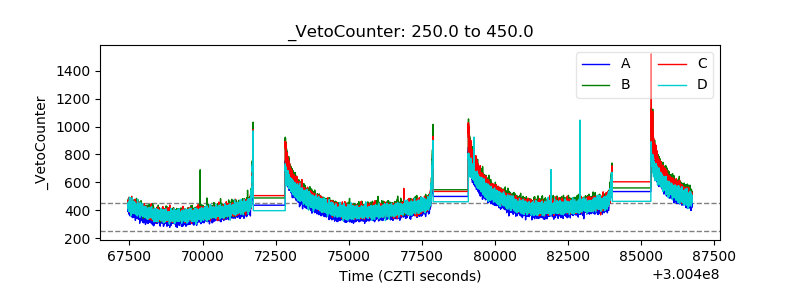 |