| Param | Original file | Final file |
|---|---|---|
| Filename | modeM0/AS1A05_160T02_9000003022_20452cztM0_level2.evt | modeM0/AS1A05_160T02_9000003022_20452cztM0_level2_quad_clean.evt |
| Size (bytes) | 547,004,160 | 87,727,680 |
| Size | 521.7 MB | 83.7 MB |
| Events in quadrant A | 3,180,944 | 581,382 |
| Events in quadrant B | 3,513,720 | 597,749 |
| Events in quadrant C | 3,619,565 | 550,699 |
| Events in quadrant D | 5,844,986 | 507,073 |
| Mode SS | |||
|---|---|---|---|
| Quadrant | BADHDUFLAG | Total packets | Discarded packets |
| A | 0 | 122 | 0 |
| B | 0 | 122 | 0 |
| C | 0 | 122 | 0 |
| D | 0 | 122 | 0 |
| Mode M0 | |||
|---|---|---|---|
| Quadrant | BADHDUFLAG | Total packets | Discarded packets |
| A | 0 | 13129 | 2 |
| B | 0 | 14161 | 2 |
| C | 0 | 14449 | 2 |
| D | 0 | 21466 | 2 |
| Mode M9 | |||
|---|---|---|---|
| Quadrant | BADHDUFLAG | Total packets | Discarded packets |
| A | 0 | 15 | 0 |
| B | 0 | 16 | 0 |
| C | 0 | 16 | 0 |
| D | 0 | 16 | 0 |
| Quadrant | Total seconds | Saturated seconds | Saturation percentage |
|---|---|---|---|
| A | 6008 | 22 | 0.366178% |
| B | 6008 | 103 | 1.714381% |
| C | 6008 | 153 | 2.546605% |
| D | 6007 | 524 | 8.723156% |
Noise dominated data is calculated using 1-second bins in cleaned event files. If a bin has >2000 counts, and if more than 50% of those come from <1% of pixels, then it is considered to be noise-dominated and hence unusable.
| Quadrant | # 1 sec bins | Bins with >0 counts | Bins with >2000 counts | High rate bins dominated by noise | Noise dominated (total time) | Noise dominated (detector-on time) | Marked lightcurve |
|---|---|---|---|---|---|---|---|
| A | 7403 | 6009 | 2 | 2 | 0.03% | 0.03% | 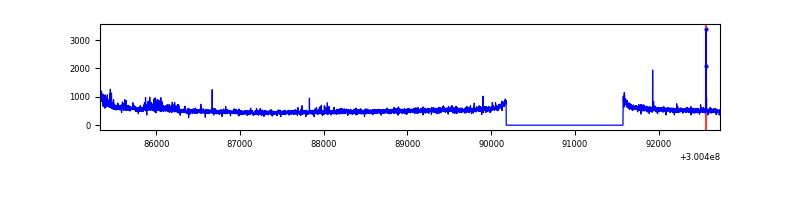 |
| B | 7403 | 6009 | 16 | 16 | 0.22% | 0.27% | 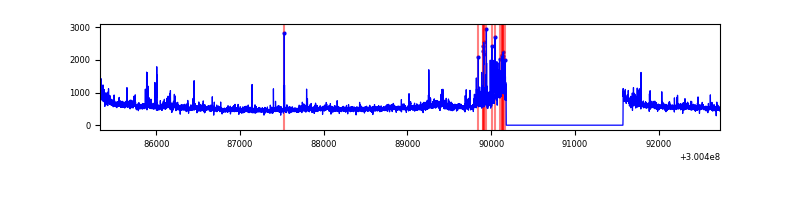 |
| C | 7403 | 6009 | 55 | 55 | 0.74% | 0.92% | 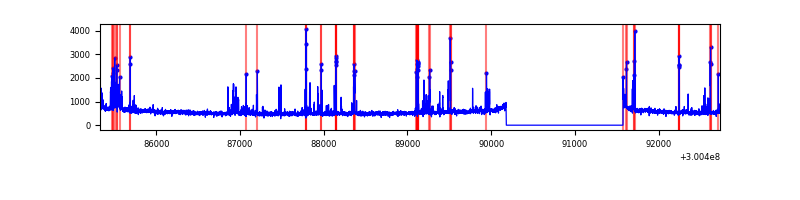 |
| D | 7402 | 6008 | 539 | 539 | 7.28% | 8.97% | 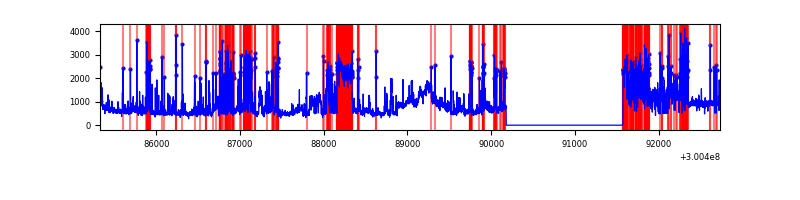 |
Top three noisy pixels from each quadrant. If the there are fewer than three noisy pixels in the level2.evt file, extra rows are filled as -1
| Pixel properties | Quadrant properties | ||||||
|---|---|---|---|---|---|---|---|
| Quadrant | DetID | PixID | Counts | Sigma | Mean | Median | Sigma |
| A | 15 | 222 | 72637 | 449.21 | 802 | 789 | 159.9 |
| A | 6 | 16 | 12005 | 70.13 | 802 | 789 | 159.9 |
| A | 13 | 254 | 7099 | 39.45 | 802 | 789 | 159.9 |
| B | 7 | 220 | 125442 | 828.58 | 807 | 788 | 150.4 |
| B | 0 | 189 | 113864 | 751.62 | 807 | 788 | 150.4 |
| B | 0 | 197 | 36711 | 238.78 | 807 | 788 | 150.4 |
| C | 9 | 221 | 441052 | 2502.32 | 763 | 771 | 175.9 |
| C | 14 | 238 | 120805 | 682.21 | 763 | 771 | 175.9 |
| C | 3 | 233 | 83736 | 471.53 | 763 | 771 | 175.9 |
| D | 15 | 0 | 1292387 | 7194.93 | 738 | 717 | 179.5 |
| D | 7 | 238 | 666947 | 3711.07 | 738 | 717 | 179.5 |
| D | 1 | 52 | 634624 | 3531.02 | 738 | 717 | 179.5 |
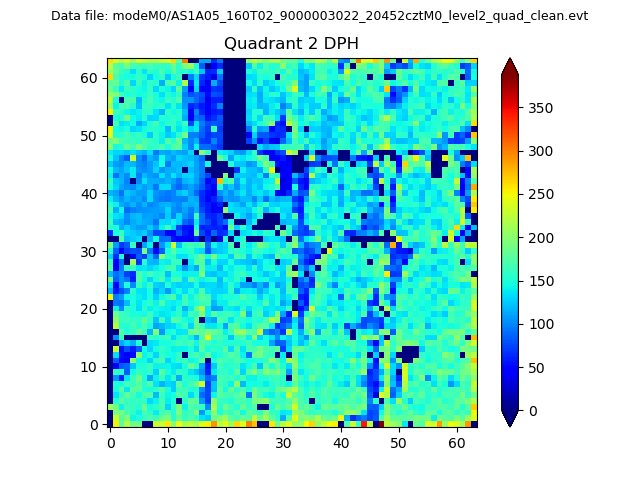
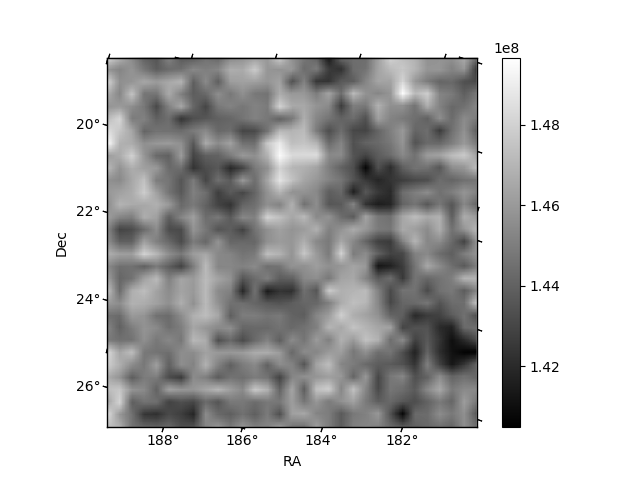
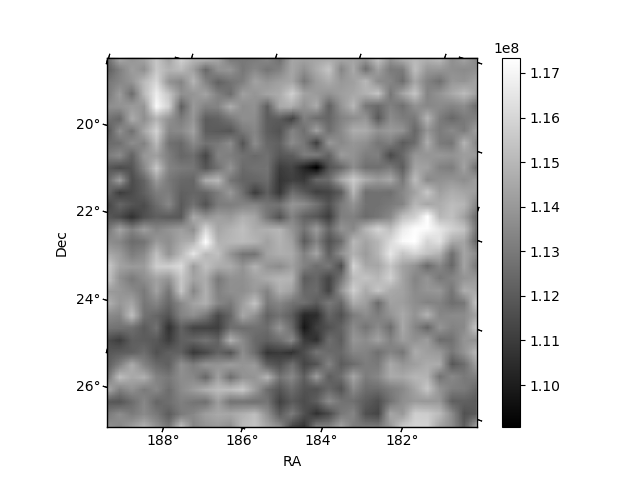
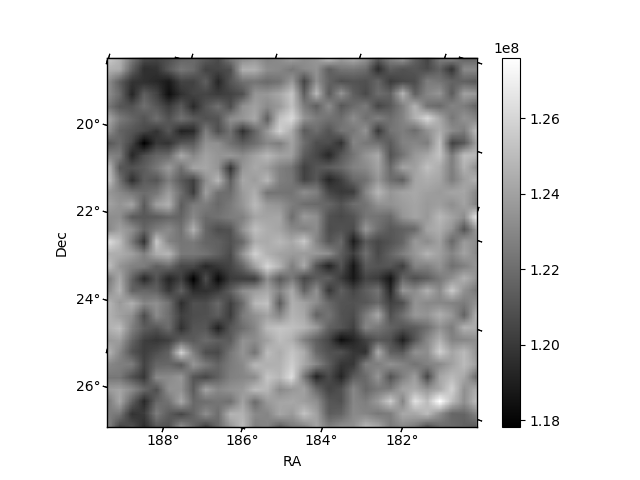
Histogram calculated using DETX and DETY for each event in the final _common_clean file
| Quadrant A | 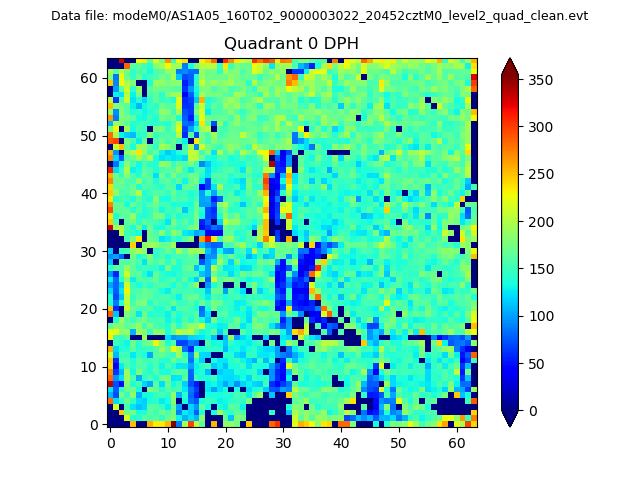 |
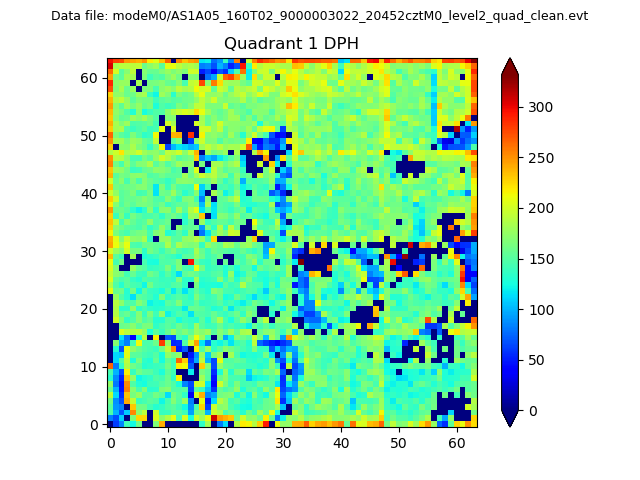 |
Quadrant B |
|---|---|---|---|
| Quadrant D | 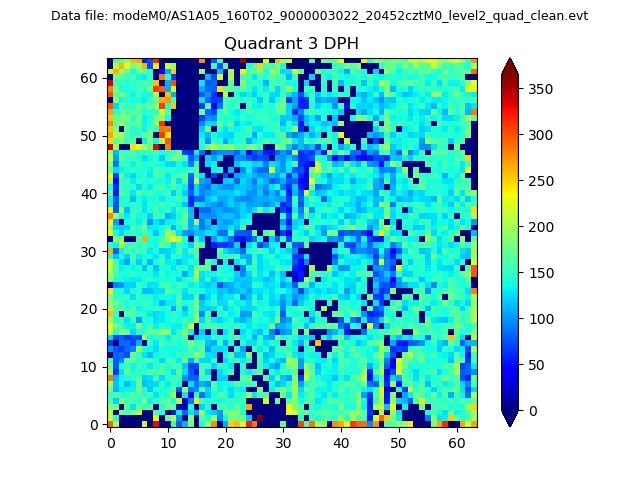 |
 |
Quadrant C |
| Plot type | Count rate plots | Images |
|---|---|---|
| Comparison with Poisson distribution Blue bars denote a histogram of data divided into 1 sec bins. Red curve is a Poisson curve with rate = median count rate of data. |
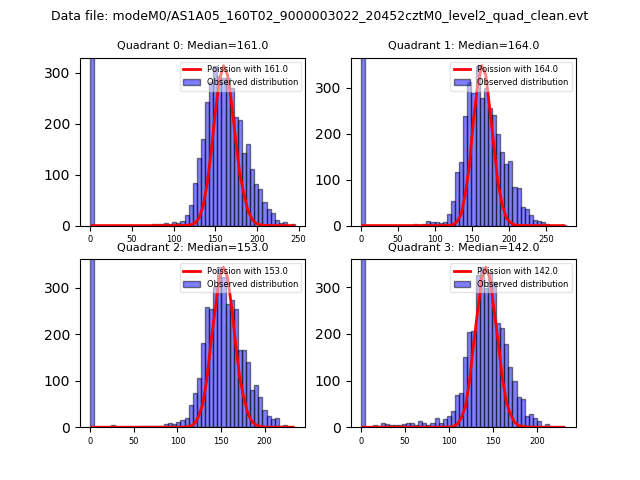 |
 |
| Quadrant-wise count rates Data is divided into 100 sec bins |
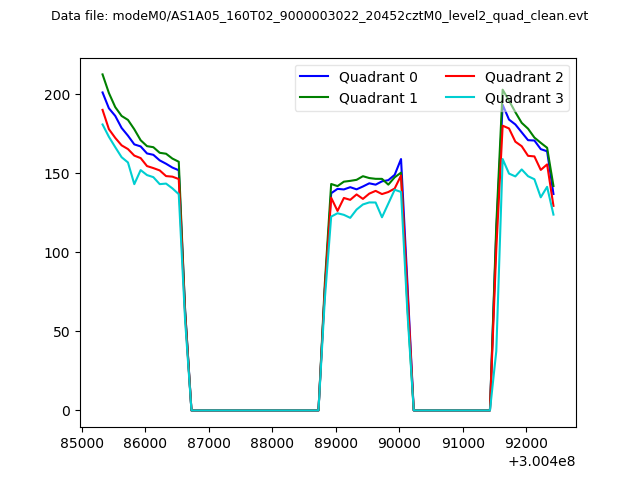 |
|
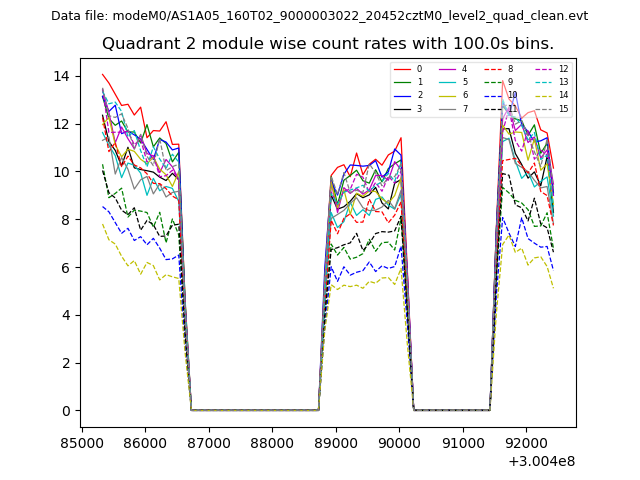
| Module-wise count rates for Quadrant A Data is divided into 100 sec bins |
 |
 |
| Module-wise count rates for Quadrant B Data is divided into 100 sec bins |
 |
 |
| Module-wise count rates for Quadrant C Data is divided into 100 sec bins |
 |
 |
| Module-wise count rates for Quadrant D Data is divided into 100 sec bins |
 |
 |
| Parameter | Plot |
|---|---|
| CZT HV Monitor |  |
| D_VDD | 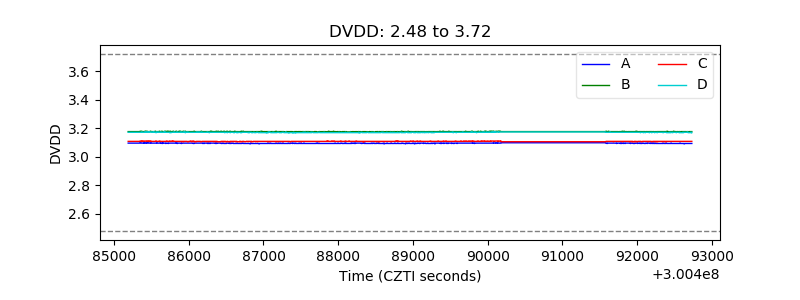 |
| Temperature 1 | 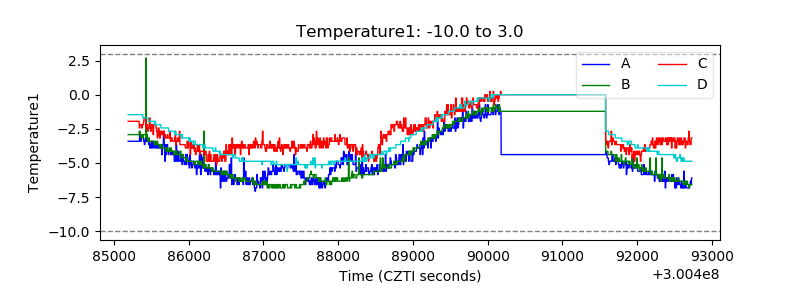 |
| Veto HV Monitor | 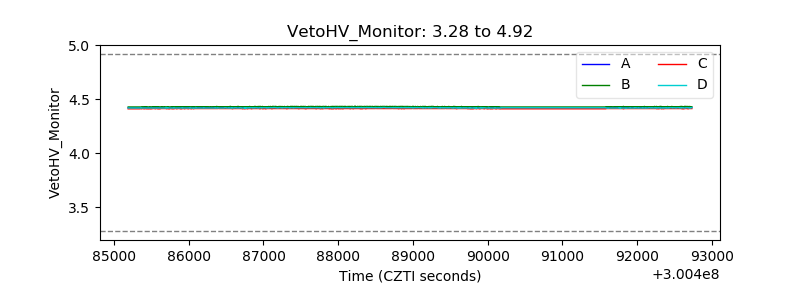 |
| Veto LLD |  |
| Alpha Counter | 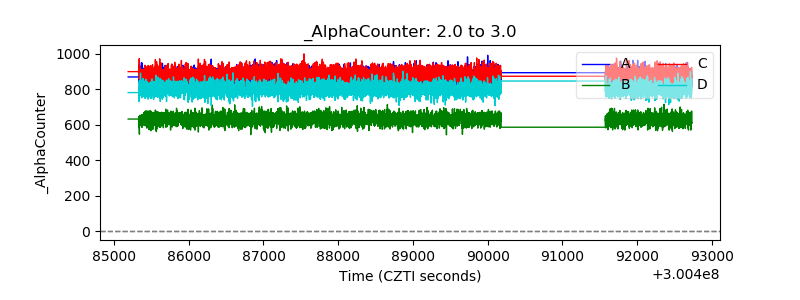 |
| _CPM_Rate | 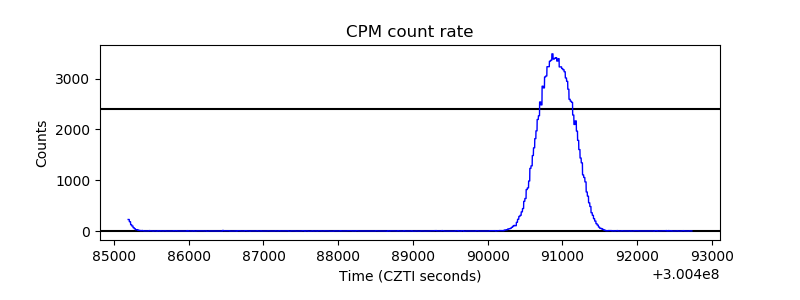 |
| CZT Counter | 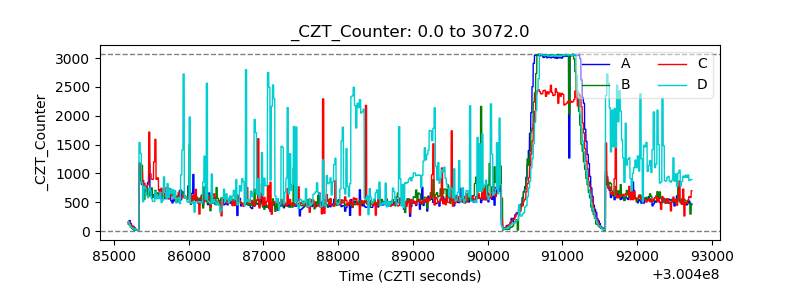 |
| +2.5 Volts monitor |  |
| +5 Volts monitor |  |
| _ROLL_ROT | 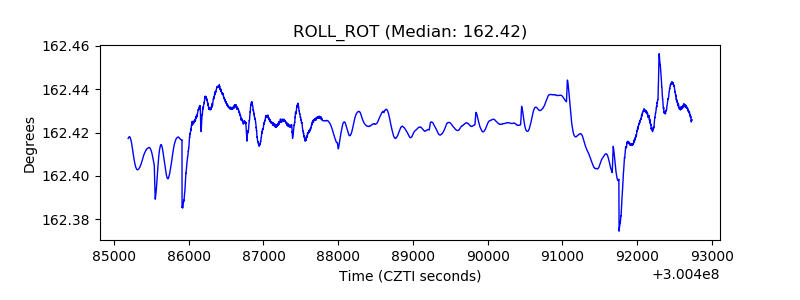 |
| _Roll_DEC |  |
| _Roll_RA | 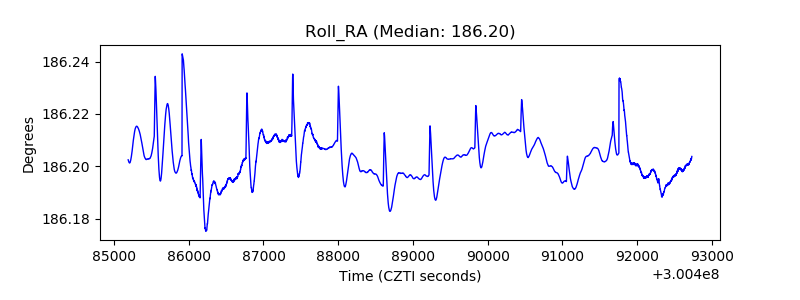 |
| Veto Counter | 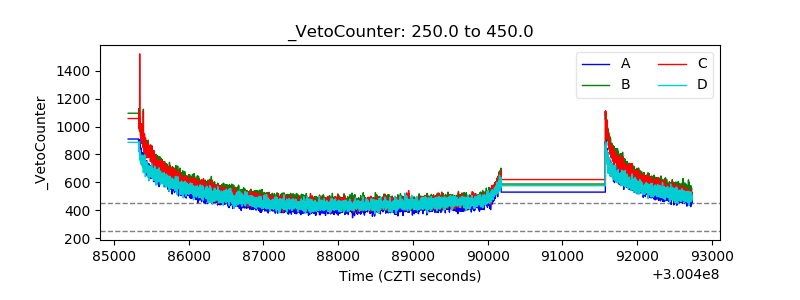 |