| Param | Original file | Final file |
|---|---|---|
| Filename | modeM0/AS1A05_160T02_9000003022_20453cztM0_level2.evt | modeM0/AS1A05_160T02_9000003022_20453cztM0_level2_quad_clean.evt |
| Size (bytes) | 514,071,360 | 78,822,720 |
| Size | 490.3 MB | 75.2 MB |
| Events in quadrant A | 3,253,619 | 511,902 |
| Events in quadrant B | 3,667,460 | 522,649 |
| Events in quadrant C | 3,583,713 | 478,892 |
| Events in quadrant D | 4,647,584 | 444,497 |
| Mode SS | |||
|---|---|---|---|
| Quadrant | BADHDUFLAG | Total packets | Discarded packets |
| A | 0 | 124 | 0 |
| B | 0 | 124 | 0 |
| C | 0 | 124 | 0 |
| D | 0 | 124 | 0 |
| Mode M0 | |||
|---|---|---|---|
| Quadrant | BADHDUFLAG | Total packets | Discarded packets |
| A | 0 | 13262 | 2 |
| B | 0 | 14562 | 3 |
| C | 0 | 14243 | 2 |
| D | 0 | 17931 | 2 |
| Mode M9 | |||
|---|---|---|---|
| Quadrant | BADHDUFLAG | Total packets | Discarded packets |
| A | 0 | 25 | 0 |
| B | 0 | 26 | 0 |
| C | 0 | 26 | 0 |
| D | 0 | 26 | 0 |
| Quadrant | Total seconds | Saturated seconds | Saturation percentage |
|---|---|---|---|
| A | 6144 | 56 | 0.911458% |
| B | 6143 | 141 | 2.295295% |
| C | 6143 | 164 | 2.669705% |
| D | 6143 | 291 | 4.737099% |
Noise dominated data is calculated using 1-second bins in cleaned event files. If a bin has >2000 counts, and if more than 50% of those come from <1% of pixels, then it is considered to be noise-dominated and hence unusable.
| Quadrant | # 1 sec bins | Bins with >0 counts | Bins with >2000 counts | High rate bins dominated by noise | Noise dominated (total time) | Noise dominated (detector-on time) | Marked lightcurve |
|---|---|---|---|---|---|---|---|
| A | 7509 | 6145 | 8 | 8 | 0.11% | 0.13% | 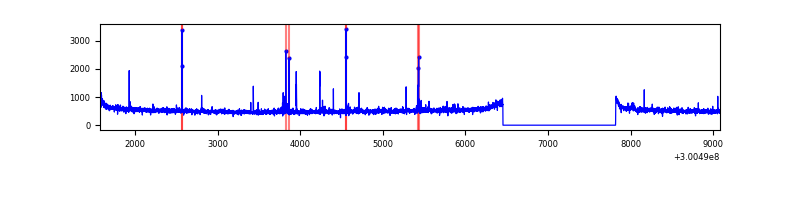 |
| B | 7508 | 6144 | 24 | 24 | 0.32% | 0.39% | 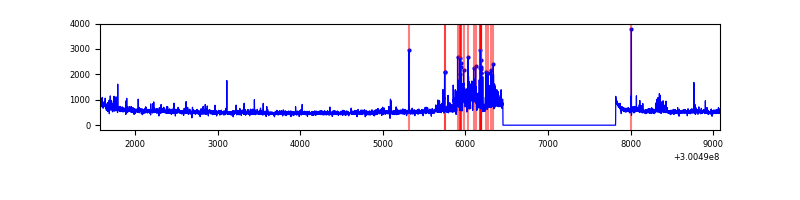 |
| C | 7508 | 6144 | 70 | 70 | 0.93% | 1.14% | 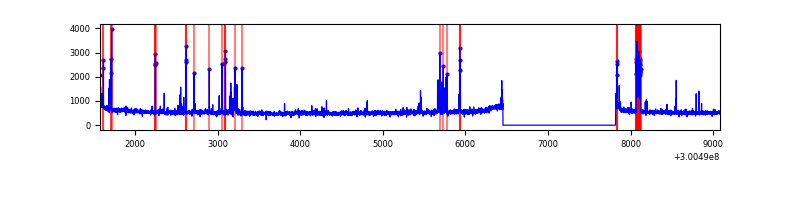 |
| D | 7508 | 6144 | 274 | 274 | 3.65% | 4.46% | 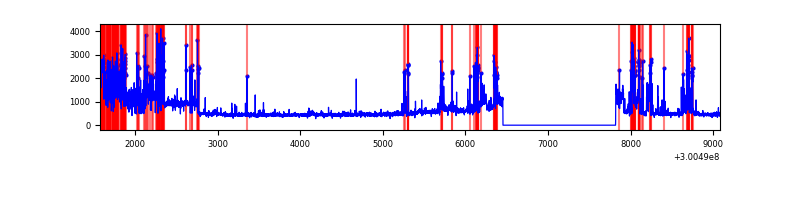 |
Top three noisy pixels from each quadrant. If the there are fewer than three noisy pixels in the level2.evt file, extra rows are filled as -1
| Pixel properties | Quadrant properties | ||||||
|---|---|---|---|---|---|---|---|
| Quadrant | DetID | PixID | Counts | Sigma | Mean | Median | Sigma |
| A | 5 | 16 | 44599 | 267.33 | 820 | 806 | 163.8 |
| A | 6 | 16 | 40102 | 239.88 | 820 | 806 | 163.8 |
| A | 0 | 226 | 7071 | 38.24 | 820 | 806 | 163.8 |
| B | 7 | 220 | 137750 | 892.8 | 824 | 807 | 153.4 |
| B | 0 | 197 | 120662 | 781.39 | 824 | 807 | 153.4 |
| B | 0 | 189 | 95934 | 620.18 | 824 | 807 | 153.4 |
| C | 9 | 221 | 347915 | 1939.06 | 776 | 783 | 179.0 |
| C | 14 | 238 | 123766 | 686.97 | 776 | 783 | 179.0 |
| C | 3 | 233 | 85817 | 474.99 | 776 | 783 | 179.0 |
| D | 7 | 238 | 756204 | 4087.06 | 763 | 744 | 184.8 |
| D | 1 | 52 | 372736 | 2012.49 | 763 | 744 | 184.8 |
| D | 9 | 1 | 188624 | 1016.44 | 763 | 744 | 184.8 |
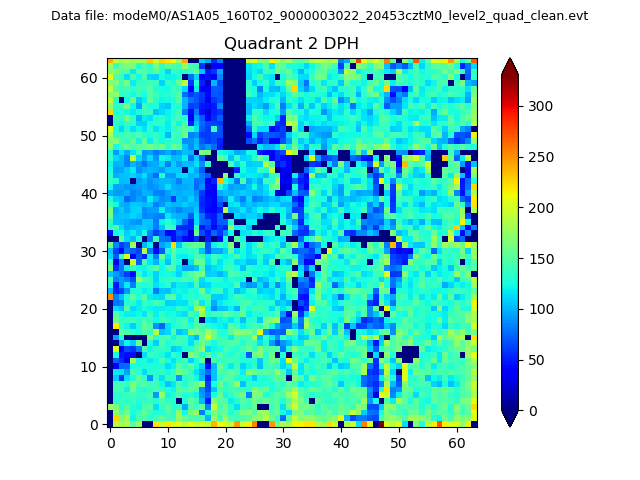
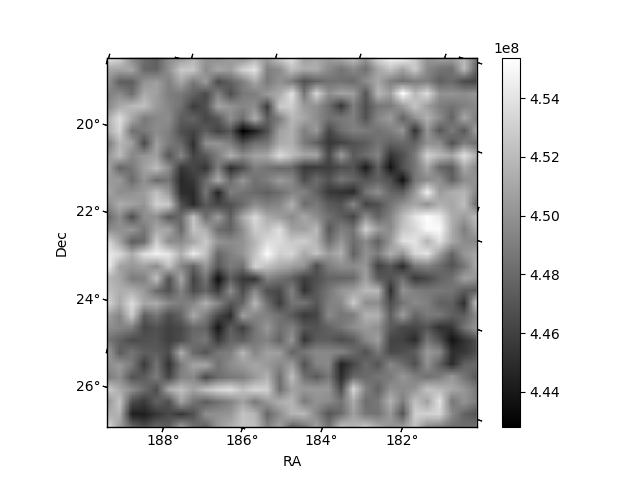
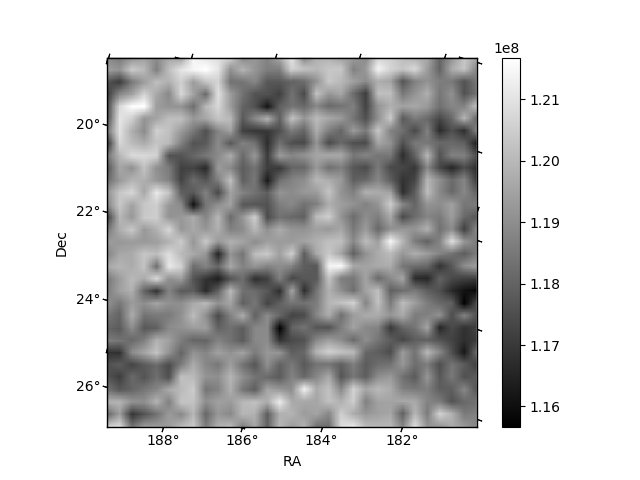
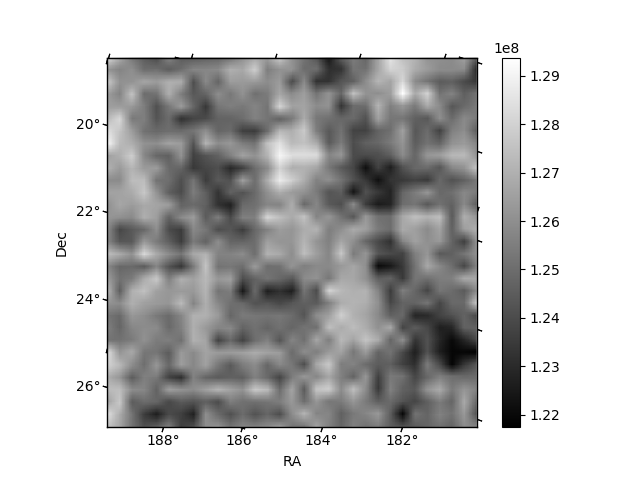
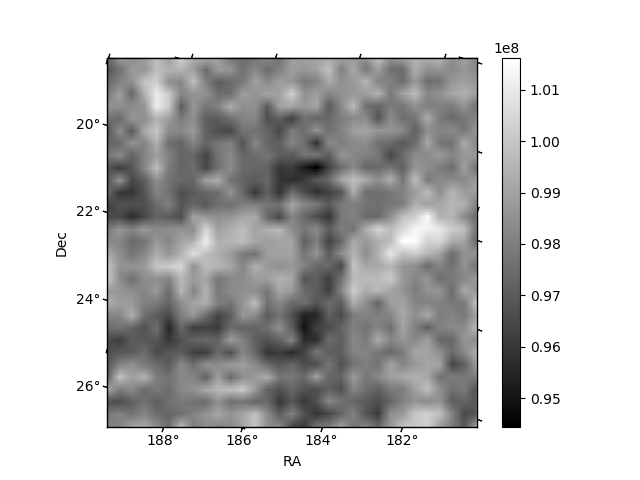
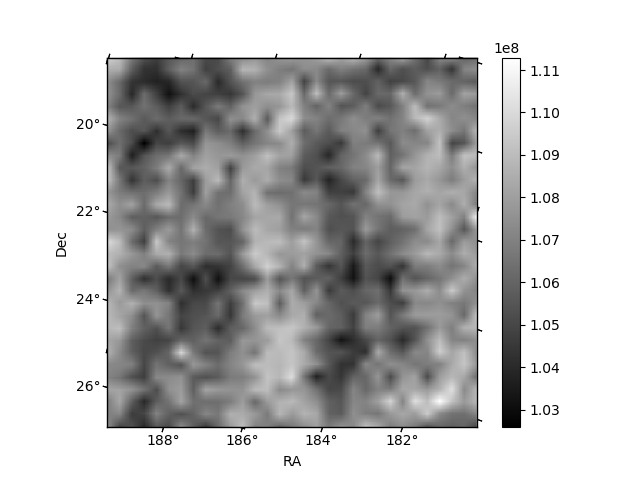
Histogram calculated using DETX and DETY for each event in the final _common_clean file
| Quadrant A | 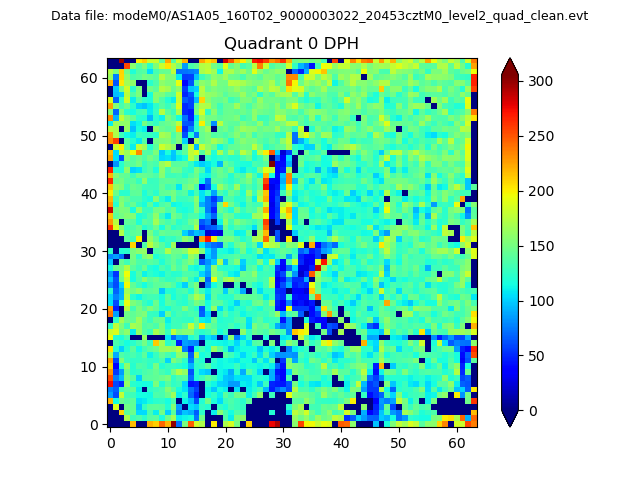 |
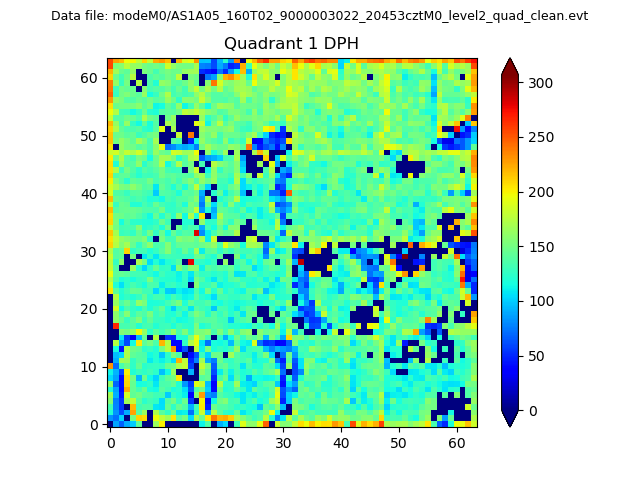 |
Quadrant B |
|---|---|---|---|
| Quadrant D | 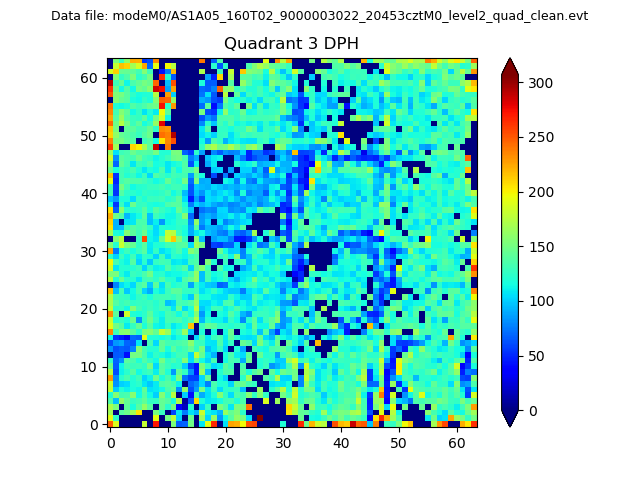 |
 |
Quadrant C |
| Plot type | Count rate plots | Images |
|---|---|---|
| Comparison with Poisson distribution Blue bars denote a histogram of data divided into 1 sec bins. Red curve is a Poisson curve with rate = median count rate of data. |
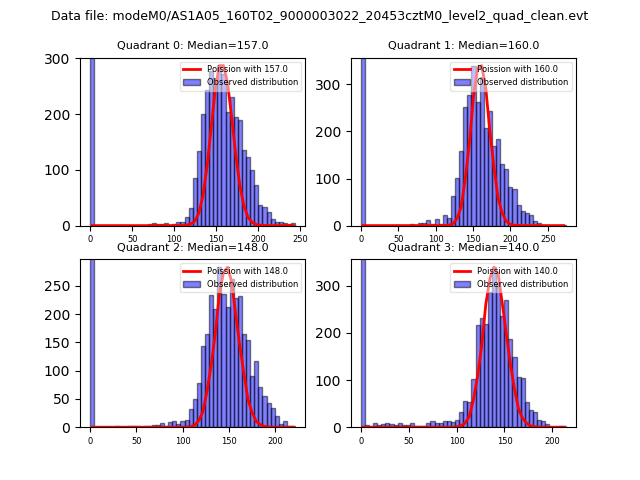 |
 |
| Quadrant-wise count rates Data is divided into 100 sec bins |
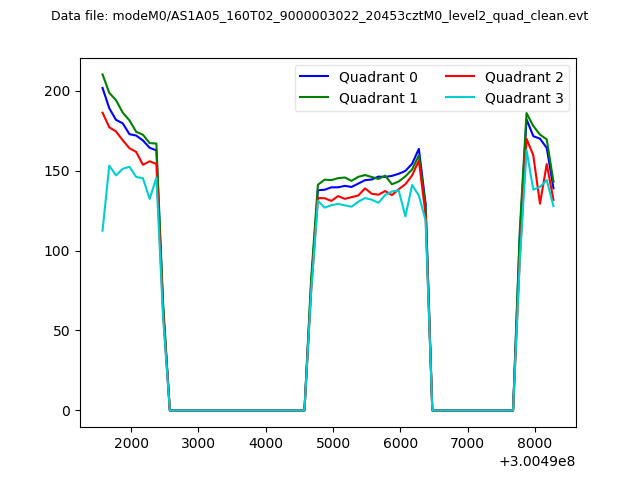 |
|
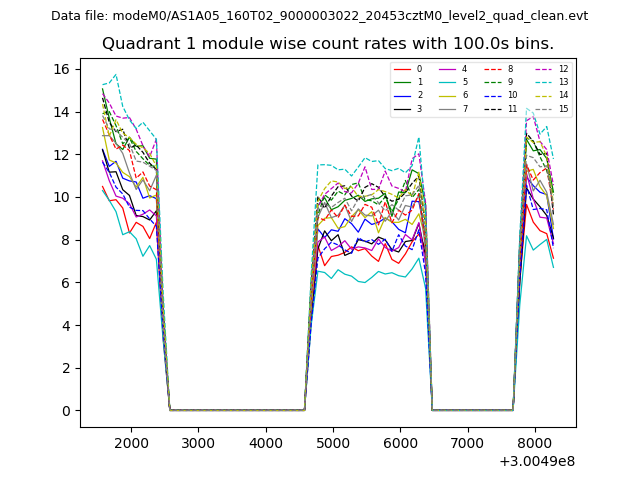
| Module-wise count rates for Quadrant A Data is divided into 100 sec bins |
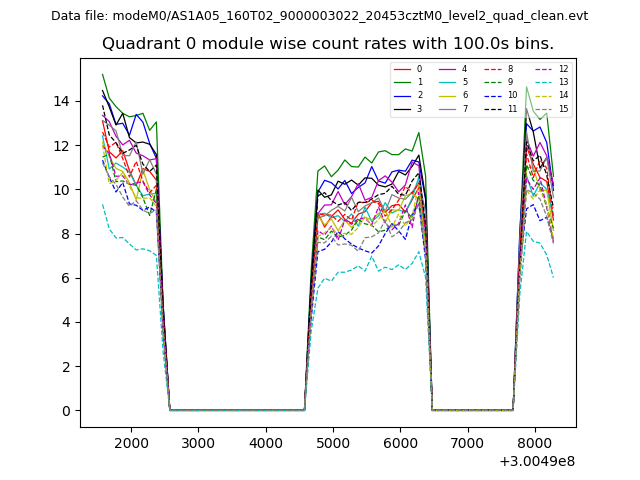 |
 |
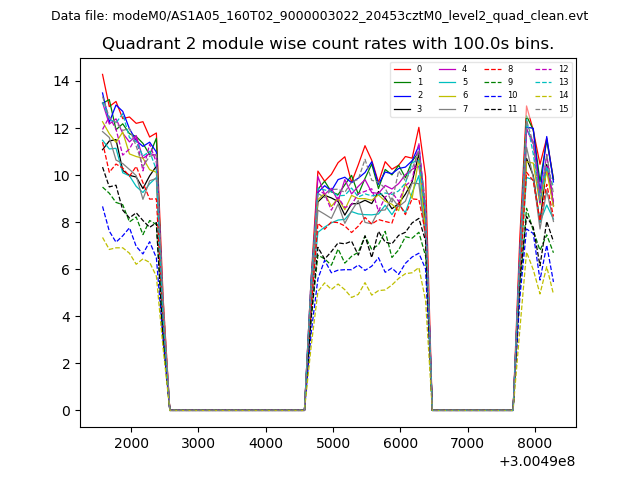
| Module-wise count rates for Quadrant B Data is divided into 100 sec bins |
 |
 |
| Module-wise count rates for Quadrant C Data is divided into 100 sec bins |
 |
 |
| Module-wise count rates for Quadrant D Data is divided into 100 sec bins |
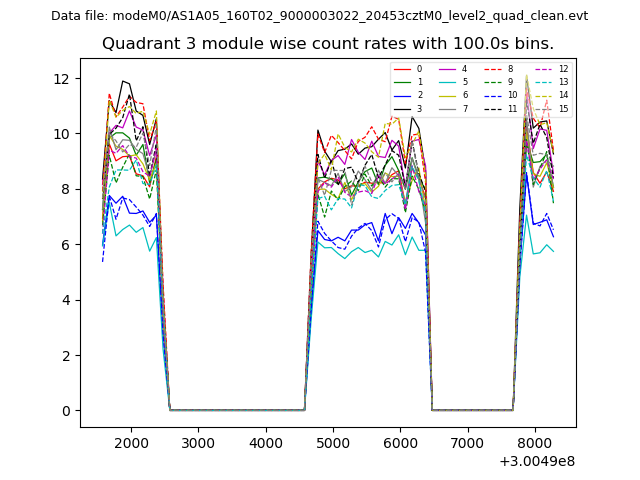 |
 |
| Parameter | Plot |
|---|---|
| CZT HV Monitor |  |
| D_VDD | 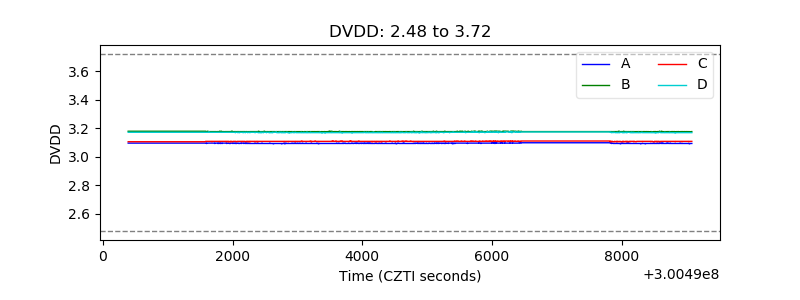 |
| Temperature 1 | 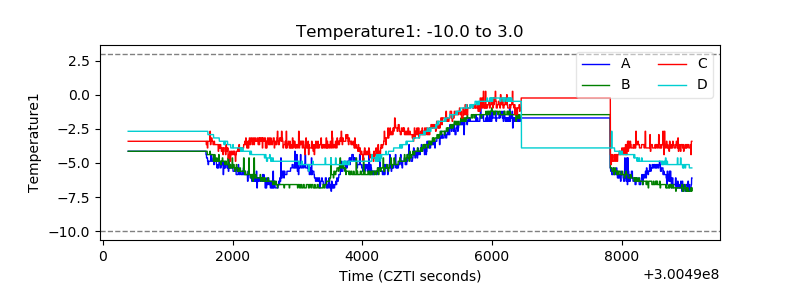 |
| Veto HV Monitor | 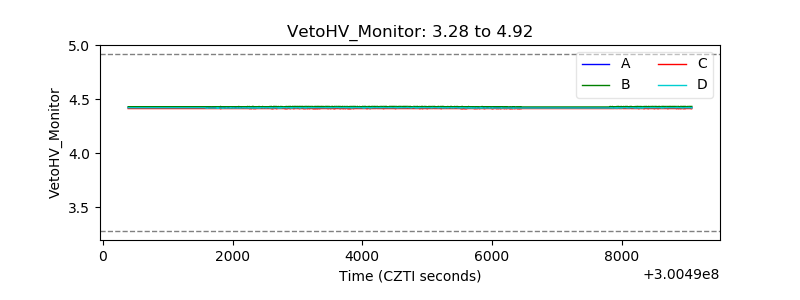 |
| Veto LLD |  |
| Alpha Counter | 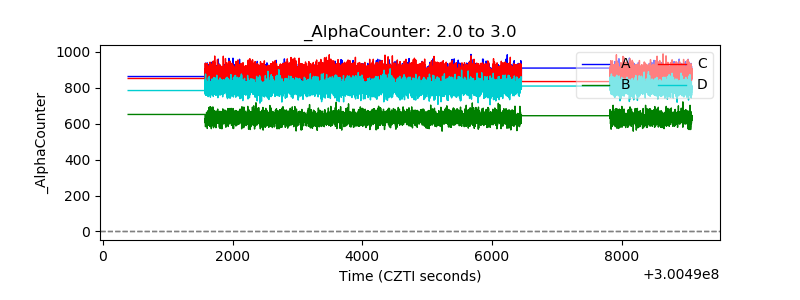 |
| _CPM_Rate | 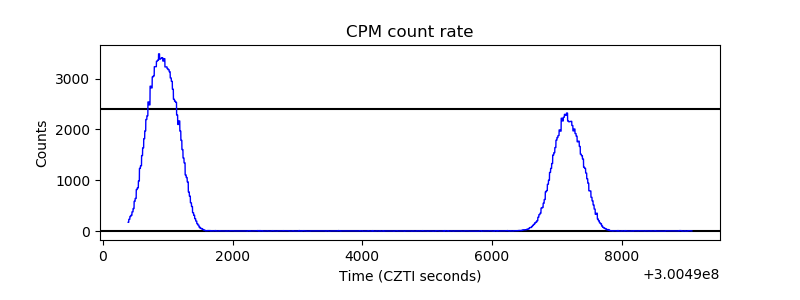 |
| CZT Counter | 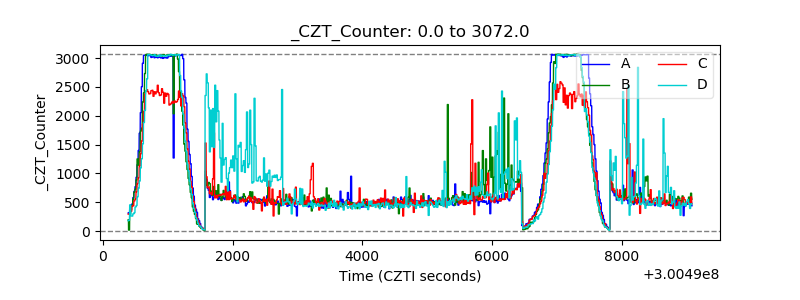 |
| +2.5 Volts monitor |  |
| +5 Volts monitor |  |
| _ROLL_ROT |  |
| _Roll_DEC |  |
| _Roll_RA | 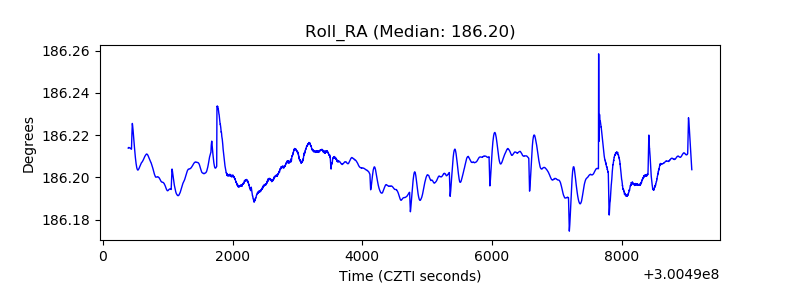 |
| Veto Counter | 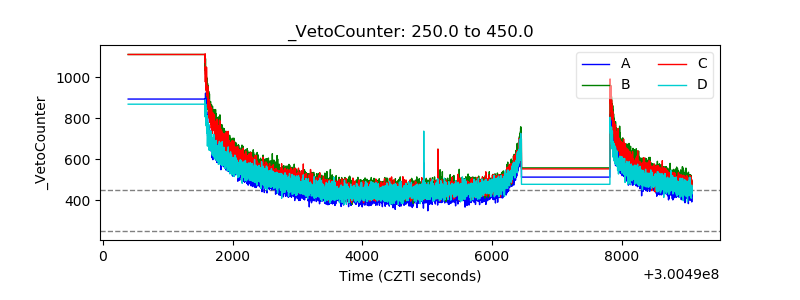 |