| Param | Original file | Final file |
|---|---|---|
| Filename | modeM0/AS1A05_160T02_9000003022_20454cztM0_level2.evt | modeM0/AS1A05_160T02_9000003022_20454cztM0_level2_quad_clean.evt |
| Size (bytes) | 508,838,400 | 70,009,920 |
| Size | 485.3 MB | 66.8 MB |
| Events in quadrant A | 3,662,808 | 430,613 |
| Events in quadrant B | 3,828,651 | 440,476 |
| Events in quadrant C | 3,430,736 | 409,025 |
| Events in quadrant D | 4,050,085 | 389,260 |
| Mode SS | |||
|---|---|---|---|
| Quadrant | BADHDUFLAG | Total packets | Discarded packets |
| A | 0 | 130 | 0 |
| B | 0 | 130 | 0 |
| C | 0 | 130 | 0 |
| D | 0 | 130 | 0 |
| Mode M0 | |||
|---|---|---|---|
| Quadrant | BADHDUFLAG | Total packets | Discarded packets |
| A | 0 | 14860 | 2 |
| B | 0 | 15277 | 2 |
| C | 0 | 13921 | 2 |
| D | 0 | 16369 | 2 |
| Mode M9 | |||
|---|---|---|---|
| Quadrant | BADHDUFLAG | Total packets | Discarded packets |
| A | 0 | 23 | 0 |
| B | 0 | 24 | 0 |
| C | 0 | 24 | 0 |
| D | 0 | 24 | 0 |
| Quadrant | Total seconds | Saturated seconds | Saturation percentage |
|---|---|---|---|
| A | 6459 | 95 | 1.470816% |
| B | 6459 | 137 | 2.121071% |
| C | 6459 | 116 | 1.795944% |
| D | 6459 | 144 | 2.229447% |
Noise dominated data is calculated using 1-second bins in cleaned event files. If a bin has >2000 counts, and if more than 50% of those come from <1% of pixels, then it is considered to be noise-dominated and hence unusable.
| Quadrant | # 1 sec bins | Bins with >0 counts | Bins with >2000 counts | High rate bins dominated by noise | Noise dominated (total time) | Noise dominated (detector-on time) | Marked lightcurve |
|---|---|---|---|---|---|---|---|
| A | 7729 | 6460 | 18 | 18 | 0.23% | 0.28% | 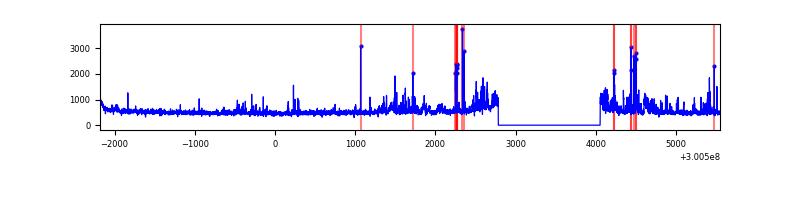 |
| B | 7729 | 6460 | 64 | 64 | 0.83% | 0.99% | 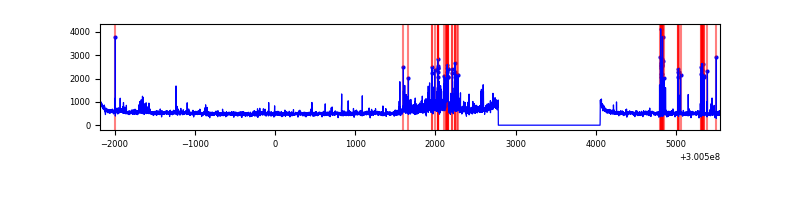 |
| C | 7729 | 6460 | 43 | 43 | 0.56% | 0.67% | 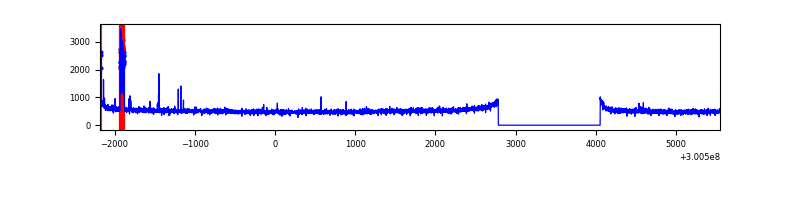 |
| D | 7729 | 6460 | 118 | 118 | 1.53% | 1.83% | 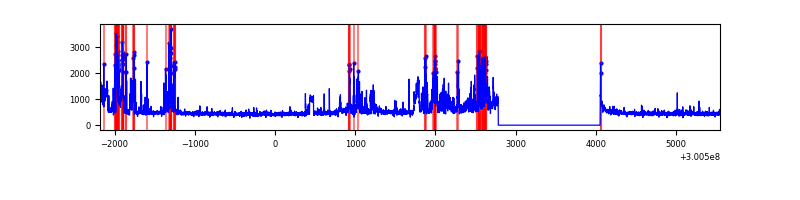 |
Top three noisy pixels from each quadrant. If the there are fewer than three noisy pixels in the level2.evt file, extra rows are filled as -1
| Pixel properties | Quadrant properties | ||||||
|---|---|---|---|---|---|---|---|
| Quadrant | DetID | PixID | Counts | Sigma | Mean | Median | Sigma |
| A | 6 | 240 | 196032 | 1173.27 | 836 | 822 | 166.4 |
| A | 5 | 16 | 174337 | 1042.87 | 836 | 822 | 166.4 |
| A | 12 | 16 | 31776 | 186.04 | 836 | 822 | 166.4 |
| B | 7 | 220 | 157341 | 989.53 | 839 | 820 | 158.2 |
| B | 10 | 245 | 113352 | 711.43 | 839 | 820 | 158.2 |
| B | 0 | 189 | 81563 | 510.46 | 839 | 820 | 158.2 |
| C | 9 | 221 | 132834 | 714.64 | 795 | 803 | 184.8 |
| C | 14 | 238 | 125694 | 675.99 | 795 | 803 | 184.8 |
| C | 3 | 233 | 68700 | 367.5 | 795 | 803 | 184.8 |
| D | 15 | 0 | 384333 | 1987.21 | 795 | 772 | 193.0 |
| D | 1 | 52 | 283690 | 1465.78 | 795 | 772 | 193.0 |
| D | 12 | 218 | 146059 | 752.72 | 795 | 772 | 193.0 |
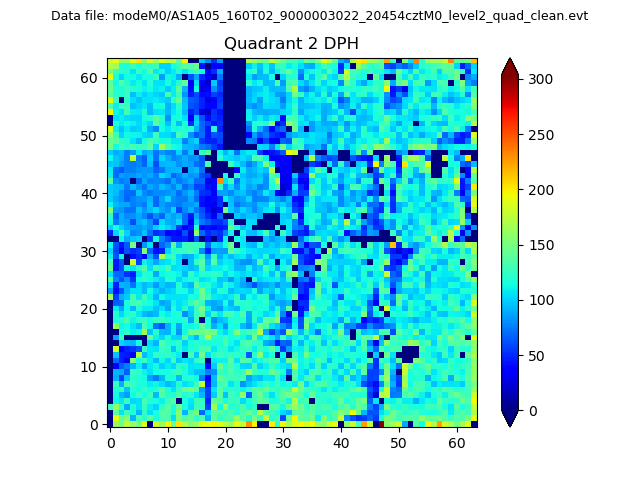
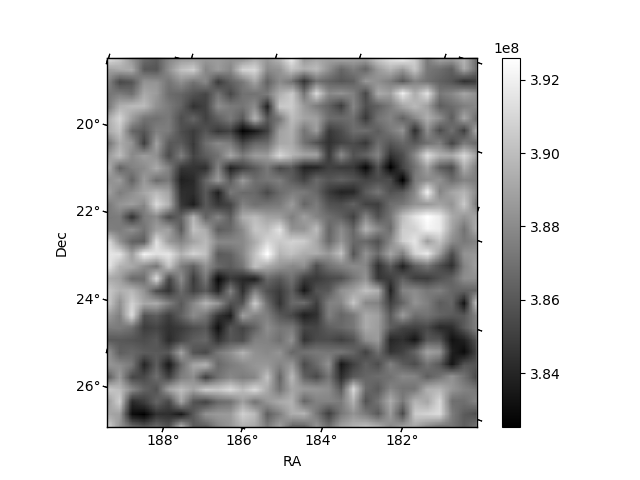
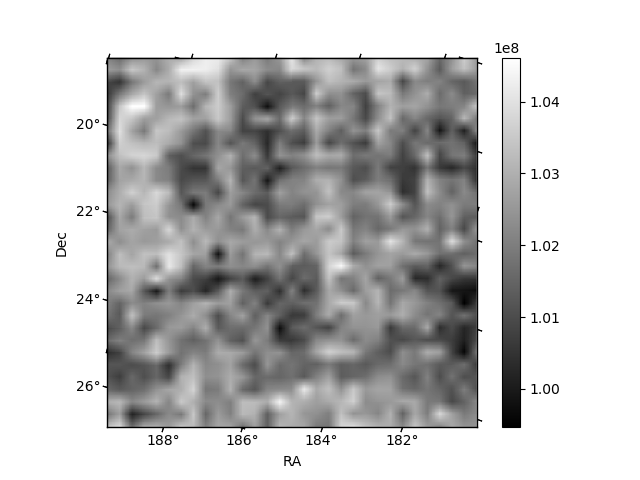
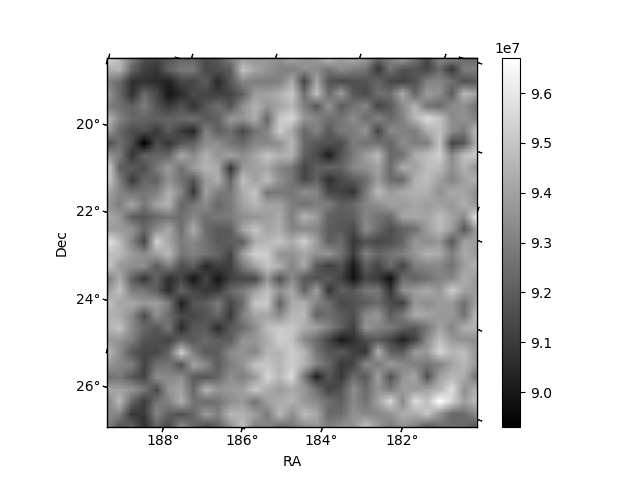
Histogram calculated using DETX and DETY for each event in the final _common_clean file
| Quadrant A | 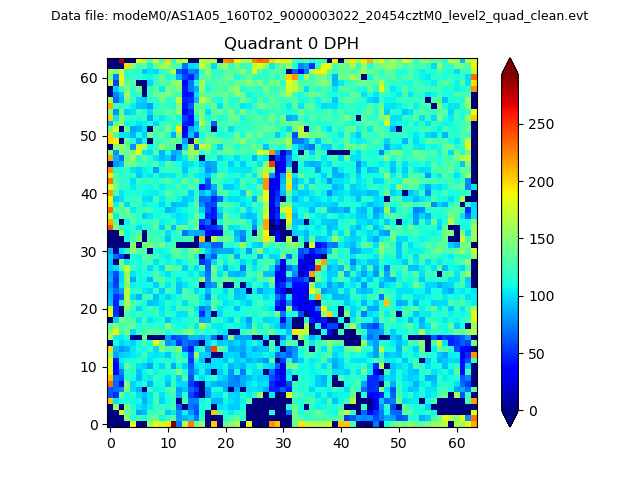 |
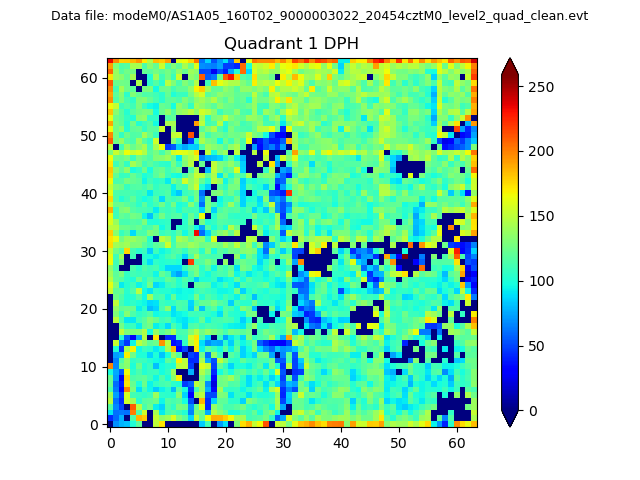 |
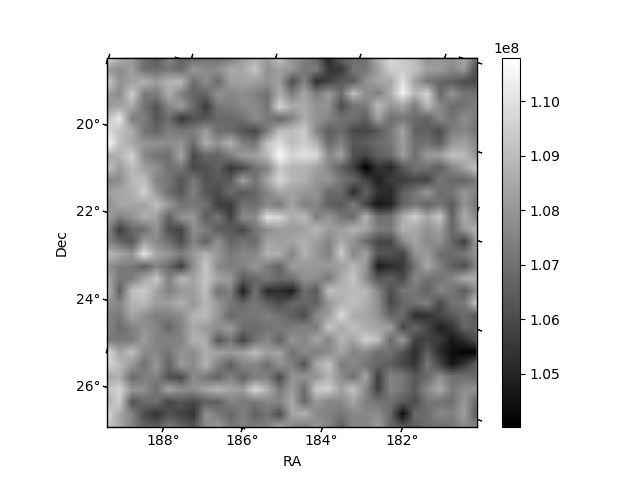
Quadrant B |
|---|---|---|---|
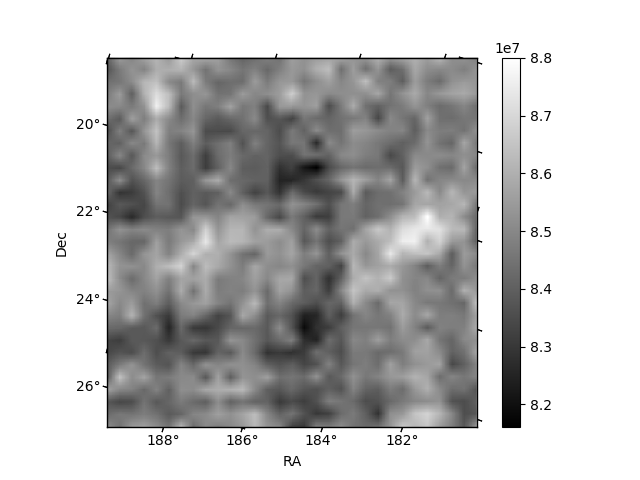
| Quadrant D | 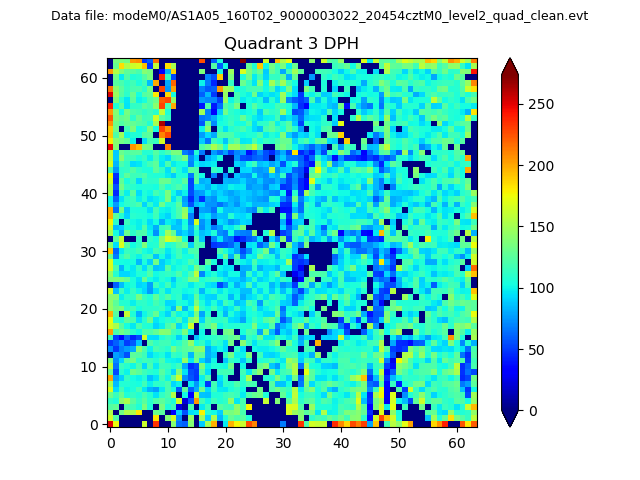 |
 |
Quadrant C |
| Plot type | Count rate plots | Images |
|---|---|---|
| Comparison with Poisson distribution Blue bars denote a histogram of data divided into 1 sec bins. Red curve is a Poisson curve with rate = median count rate of data. |
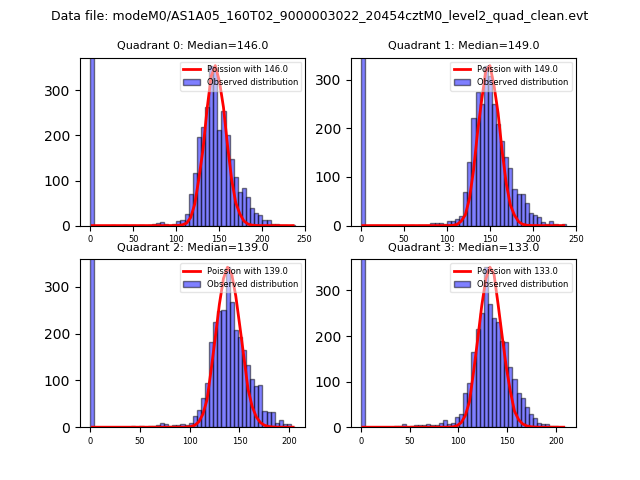 |
 |
| Quadrant-wise count rates Data is divided into 100 sec bins |
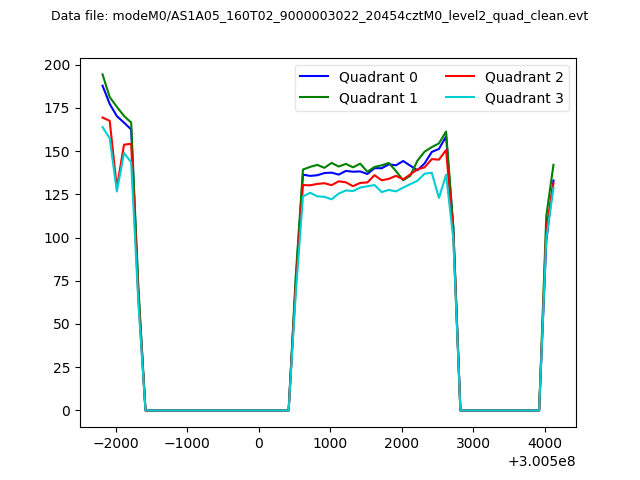 |
|
| Module-wise count rates for Quadrant A Data is divided into 100 sec bins |
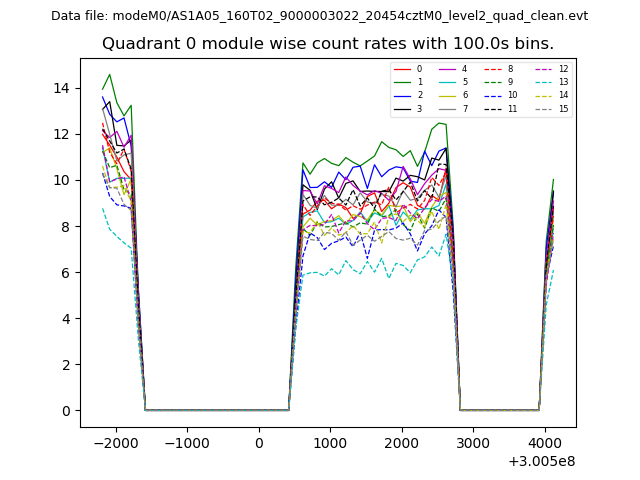 |
 |
| Module-wise count rates for Quadrant B Data is divided into 100 sec bins |
 |
 |
| Module-wise count rates for Quadrant C Data is divided into 100 sec bins |
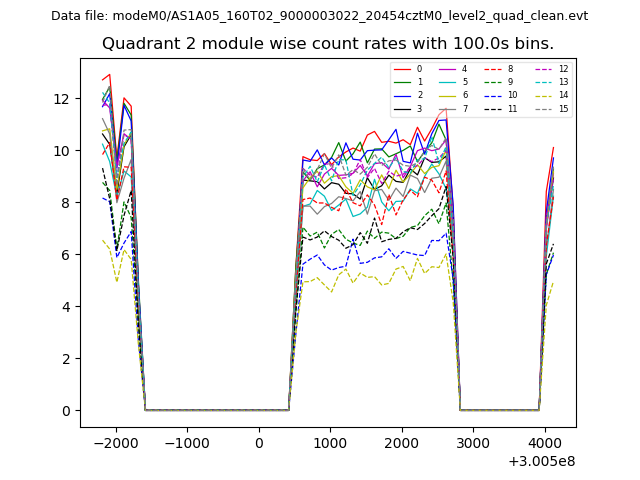 |
 |
| Module-wise count rates for Quadrant D Data is divided into 100 sec bins |
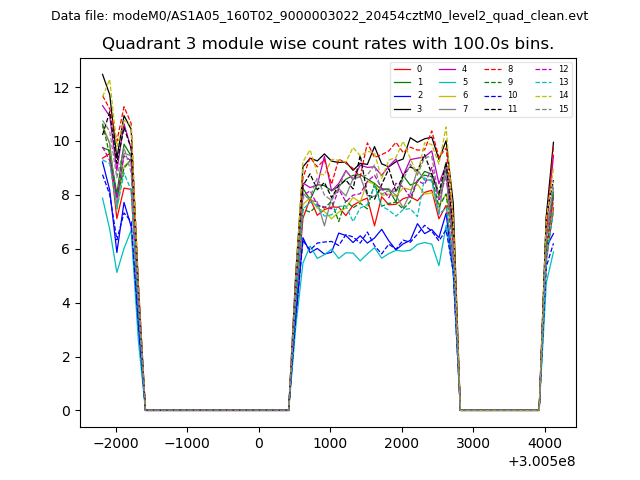 |
 |
| Parameter | Plot |
|---|---|
| CZT HV Monitor | 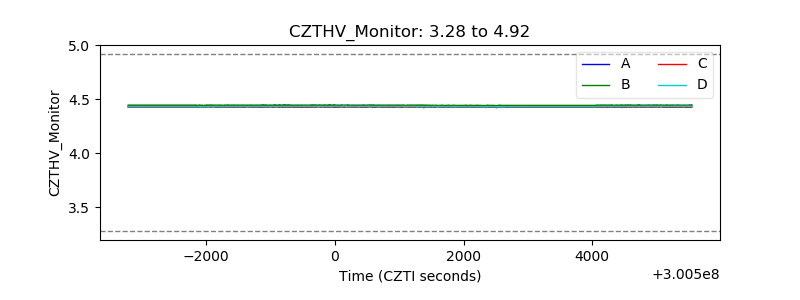 |
| D_VDD | 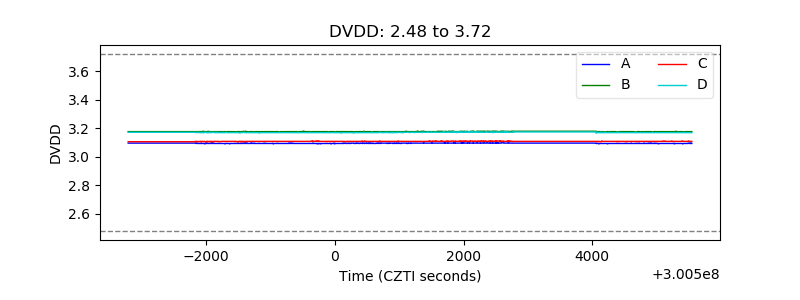 |
| Temperature 1 | 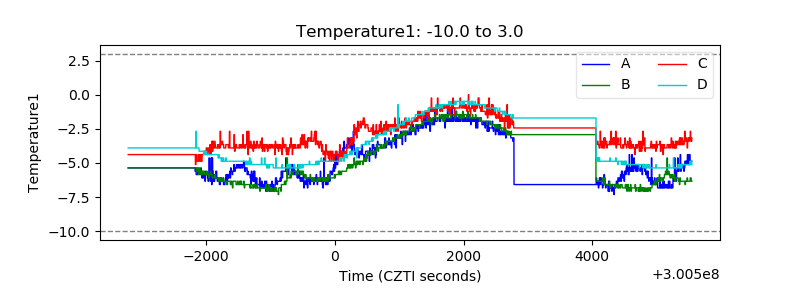 |
| Veto HV Monitor | 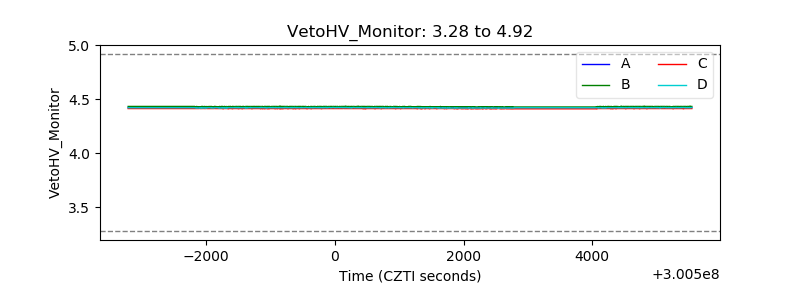 |
| Veto LLD | 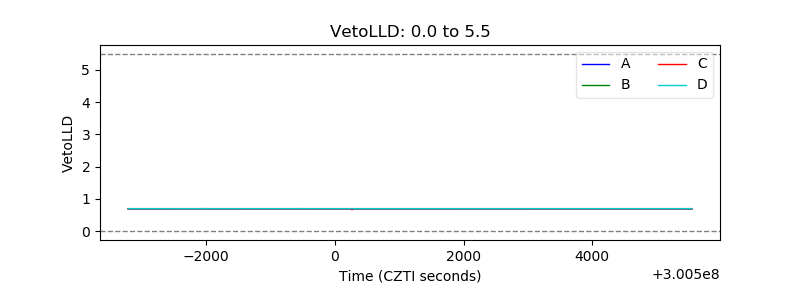 |
| Alpha Counter | 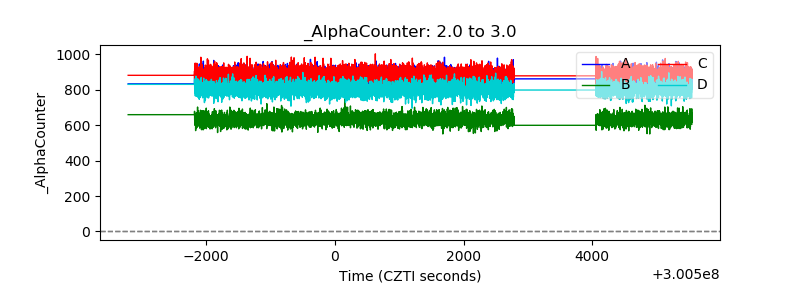 |
| _CPM_Rate | 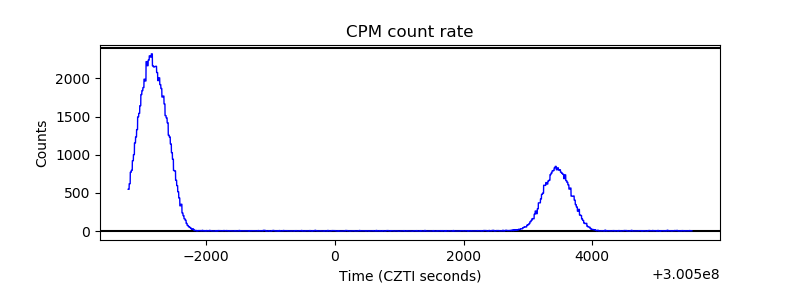 |
| CZT Counter | 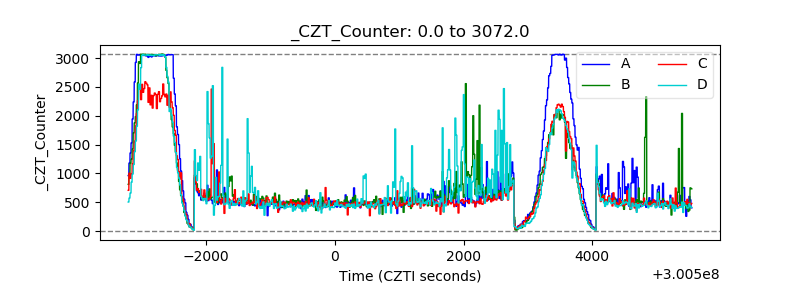 |
| +2.5 Volts monitor |  |
| +5 Volts monitor |  |
| _ROLL_ROT | 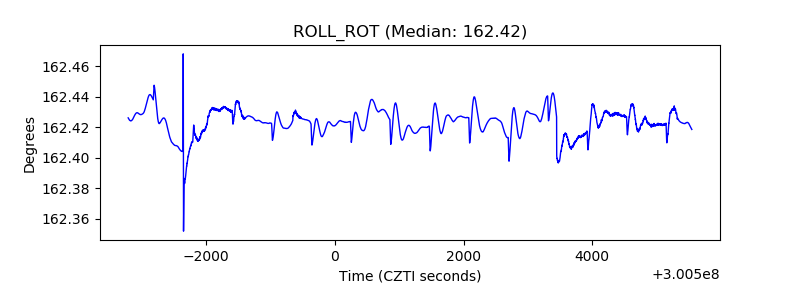 |
| _Roll_DEC |  |
| _Roll_RA | 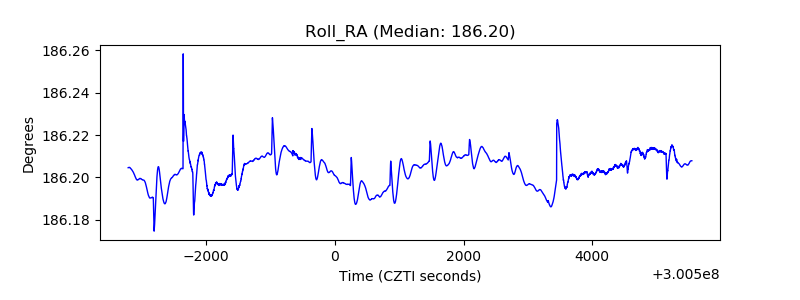 |
| Veto Counter | 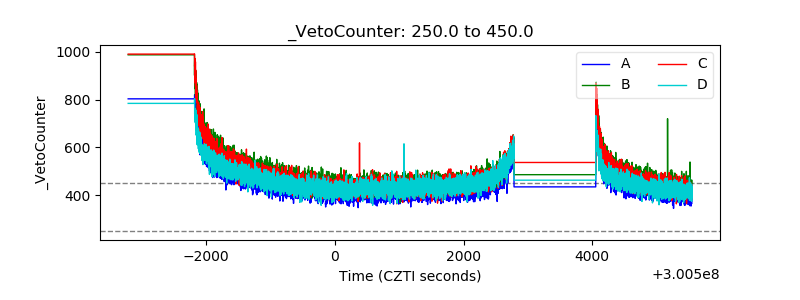 |