| Param | Original file | Final file |
|---|---|---|
| Filename | modeM0/AS1A05_160T02_9000003022_20455cztM0_level2.evt | modeM0/AS1A05_160T02_9000003022_20455cztM0_level2_quad_clean.evt |
| Size (bytes) | 241,908,480 | 27,437,760 |
| Size | 230.7 MB | 26.2 MB |
| Events in quadrant A | 1,903,553 | 151,212 |
| Events in quadrant B | 1,934,137 | 152,905 |
| Events in quadrant C | 1,596,870 | 147,143 |
| Events in quadrant D | 1,663,692 | 142,540 |
| Mode SS | |||
|---|---|---|---|
| Quadrant | BADHDUFLAG | Total packets | Discarded packets |
| A | 0 | 74 | 8 |
| B | 0 | 74 | 6 |
| C | 0 | 74 | 6 |
| D | 0 | 74 | 6 |
| Mode M0 | |||
|---|---|---|---|
| Quadrant | BADHDUFLAG | Total packets | Discarded packets |
| A | 0 | 8400 | 682 |
| B | 0 | 8583 | 842 |
| C | 0 | 7408 | 612 |
| D | 0 | 7860 | 714 |
| Mode M9 | |||
|---|---|---|---|
| Quadrant | BADHDUFLAG | Total packets | Discarded packets |
| A | 0 | 9 | 0 |
| B | 0 | 10 | 0 |
| C | 0 | 10 | 0 |
| D | 0 | 10 | 0 |
| Quadrant | Total seconds | Saturated seconds | Saturation percentage |
|---|---|---|---|
| A | 3323 | 60 | 1.805597% |
| B | 3318 | 130 | 3.918023% |
| C | 3335 | 19 | 0.569715% |
| D | 3326 | 35 | 1.052315% |
Noise dominated data is calculated using 1-second bins in cleaned event files. If a bin has >2000 counts, and if more than 50% of those come from <1% of pixels, then it is considered to be noise-dominated and hence unusable.
| Quadrant | # 1 sec bins | Bins with >0 counts | Bins with >2000 counts | High rate bins dominated by noise | Noise dominated (total time) | Noise dominated (detector-on time) | Marked lightcurve |
|---|---|---|---|---|---|---|---|
| A | 3481 | 3396 | 12 | 12 | 0.34% | 0.35% | 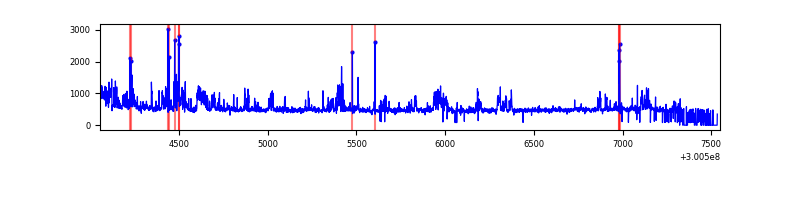 |
| B | 3456 | 3390 | 85 | 85 | 2.46% | 2.51% | 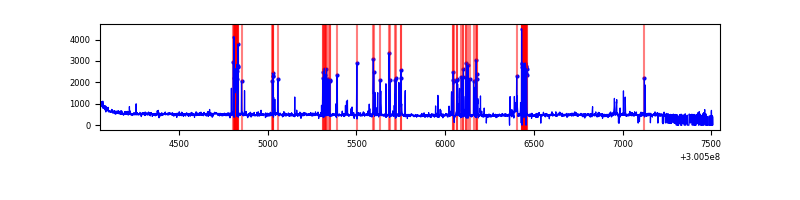 |
| C | 3495 | 3402 | 0 | 0 | 0.00% | 0.00% | 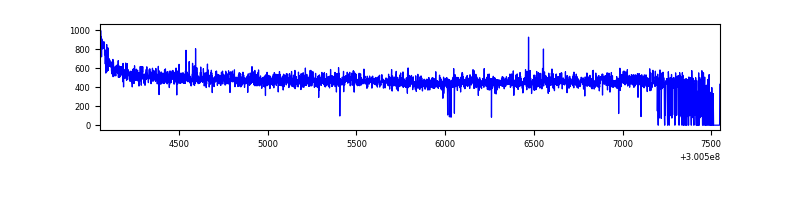 |
| D | 3453 | 3398 | 28 | 28 | 0.81% | 0.82% | 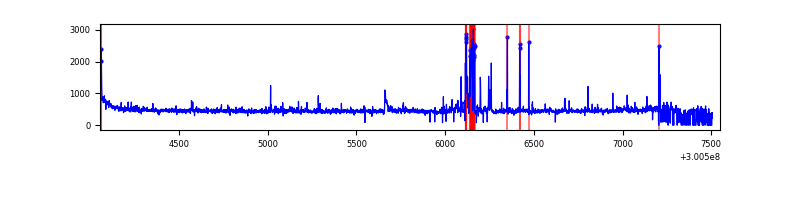 |
Top three noisy pixels from each quadrant. If the there are fewer than three noisy pixels in the level2.evt file, extra rows are filled as -1
| Pixel properties | Quadrant properties | ||||||
|---|---|---|---|---|---|---|---|
| Quadrant | DetID | PixID | Counts | Sigma | Mean | Median | Sigma |
| A | 6 | 240 | 134940 | 1620.68 | 406 | 398 | 83.0 |
| A | 5 | 16 | 111059 | 1333.02 | 406 | 398 | 83.0 |
| A | 12 | 16 | 38920 | 464.03 | 406 | 398 | 83.0 |
| B | 10 | 245 | 325188 | 4159.31 | 403 | 394 | 78.1 |
| B | 0 | 189 | 12418 | 153.98 | 403 | 394 | 78.1 |
| B | 12 | 111 | 9227 | 113.12 | 403 | 394 | 78.1 |
| C | 14 | 238 | 62050 | 673.71 | 389 | 392 | 91.5 |
| C | 3 | 233 | 12250 | 129.57 | 389 | 392 | 91.5 |
| C | 9 | 221 | 5705 | 58.05 | 389 | 392 | 91.5 |
| D | 13 | 153 | 83948 | 864.15 | 389 | 376 | 96.7 |
| D | 1 | 52 | 64029 | 658.18 | 389 | 376 | 96.7 |
| D | 12 | 218 | 15866 | 160.17 | 389 | 376 | 96.7 |
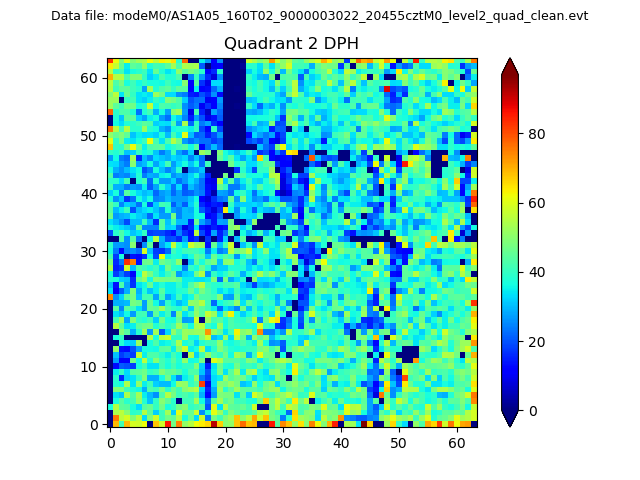
Histogram calculated using DETX and DETY for each event in the final _common_clean file
| Quadrant A | 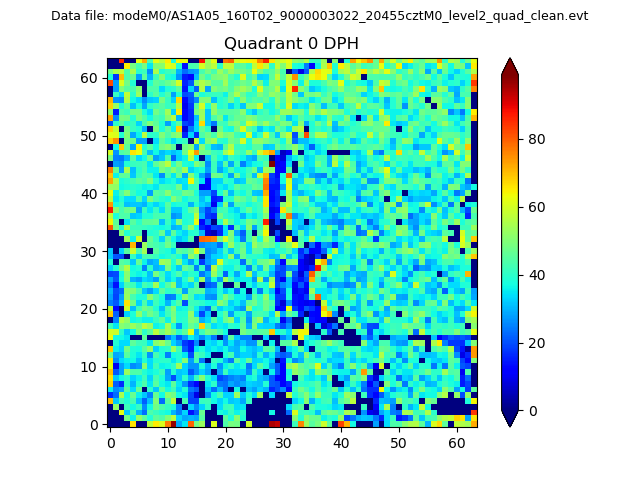 |
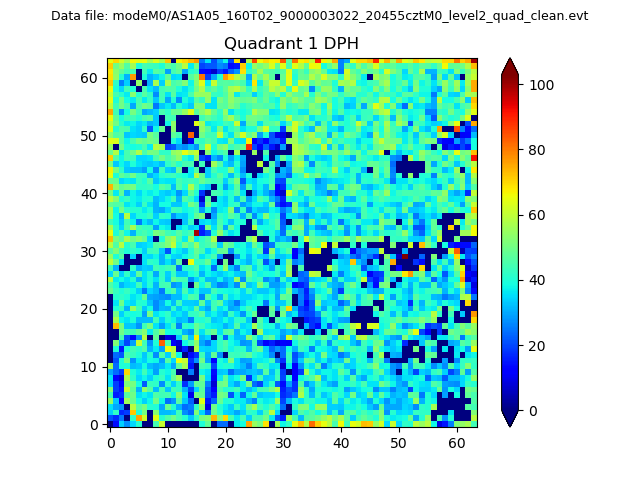 |
Quadrant B |
|---|---|---|---|
| Quadrant D | 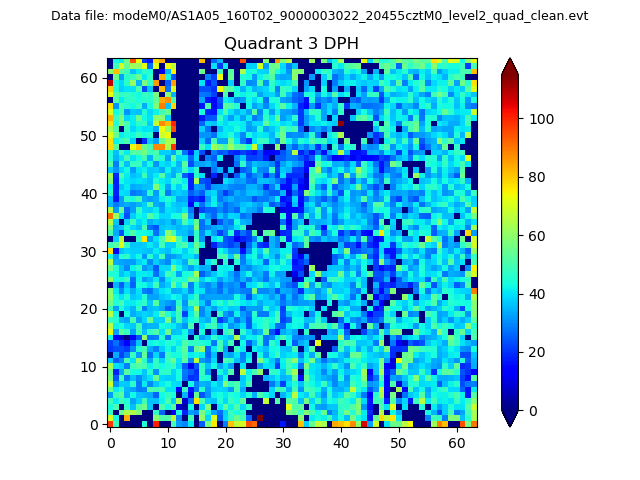 |
 |
Quadrant C |
| Plot type | Count rate plots | Images |
|---|---|---|
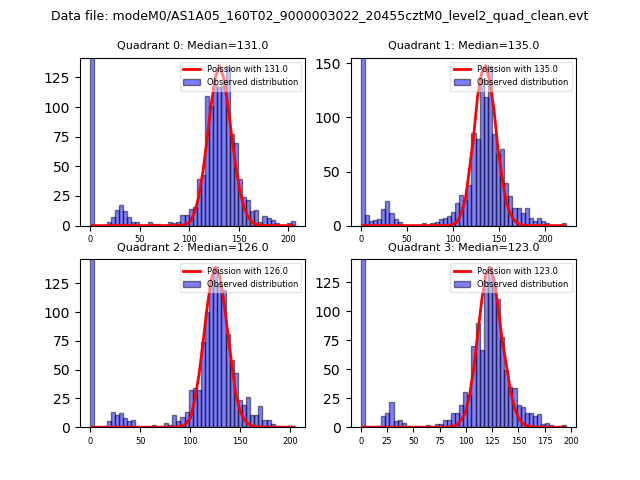
| Comparison with Poisson distribution Blue bars denote a histogram of data divided into 1 sec bins. Red curve is a Poisson curve with rate = median count rate of data. |
 |
 |
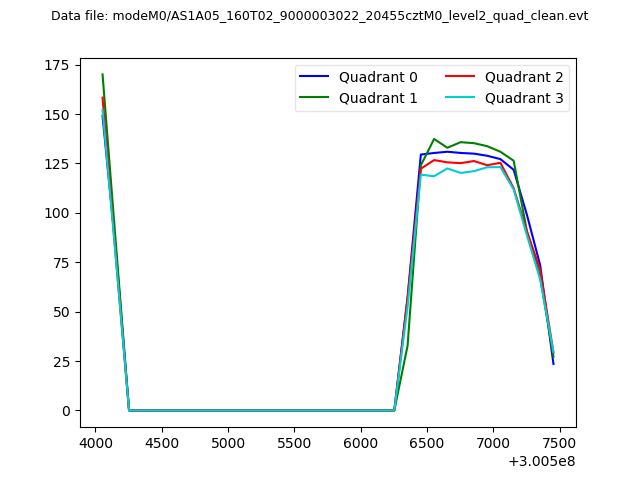
| Quadrant-wise count rates Data is divided into 100 sec bins |
 |
|
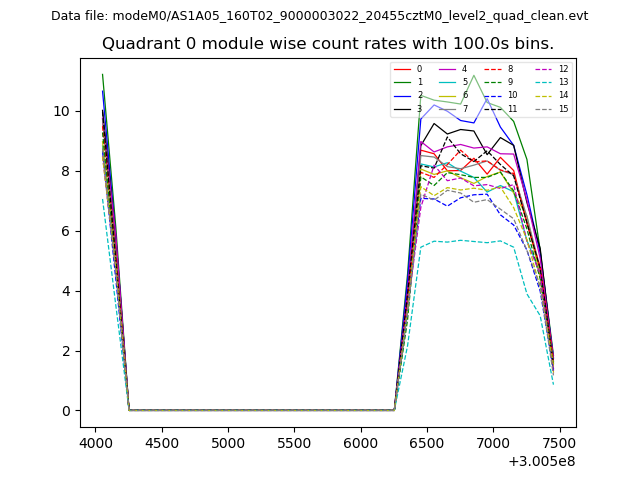
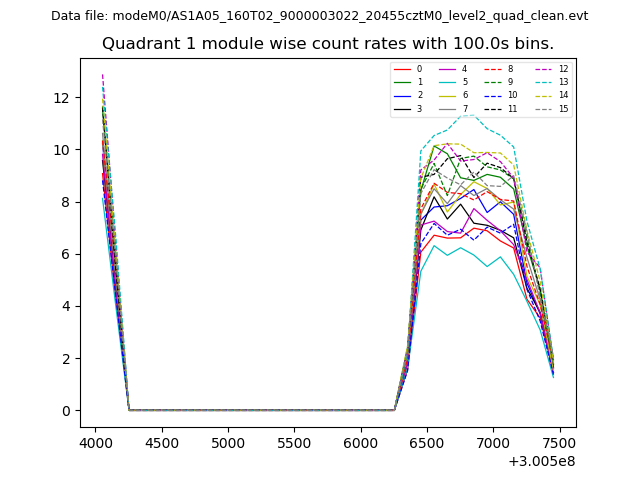
| Module-wise count rates for Quadrant A Data is divided into 100 sec bins |
 |
 |
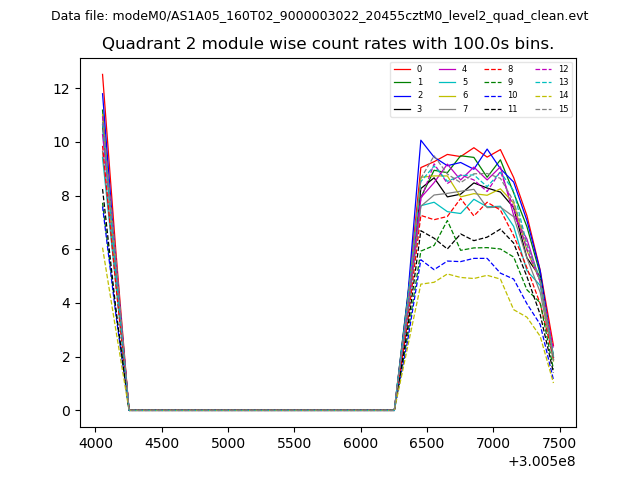
| Module-wise count rates for Quadrant B Data is divided into 100 sec bins |
 |
 |
| Module-wise count rates for Quadrant C Data is divided into 100 sec bins |
 |
 |
| Module-wise count rates for Quadrant D Data is divided into 100 sec bins |
 |
 |
| Parameter | Plot |
|---|---|
| CZT HV Monitor | 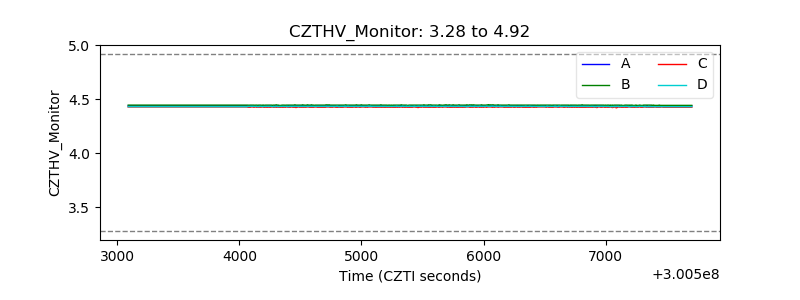 |
| D_VDD | 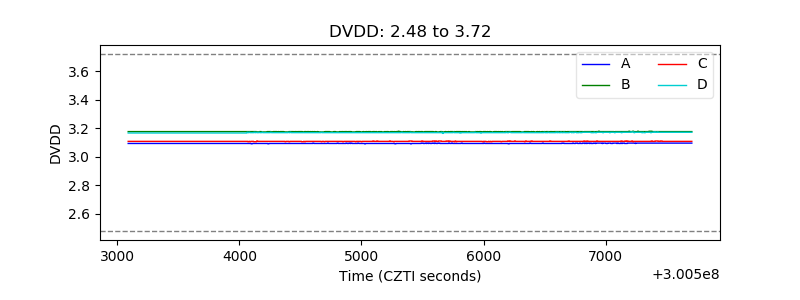 |
| Temperature 1 |  |
| Veto HV Monitor | 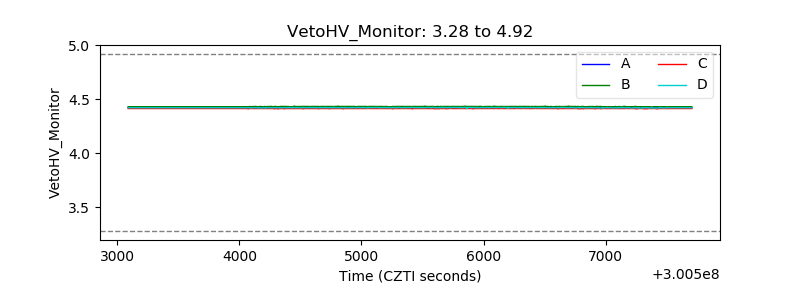 |
| Veto LLD | 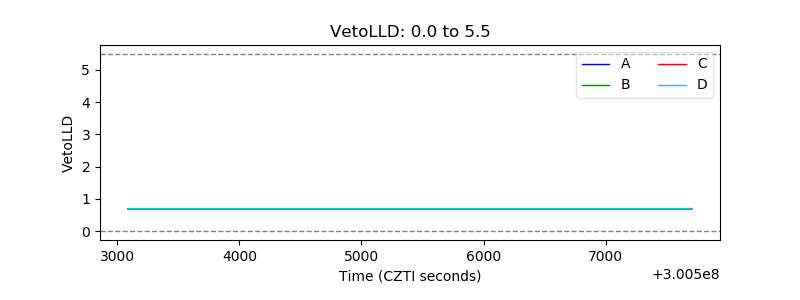 |
| Alpha Counter | 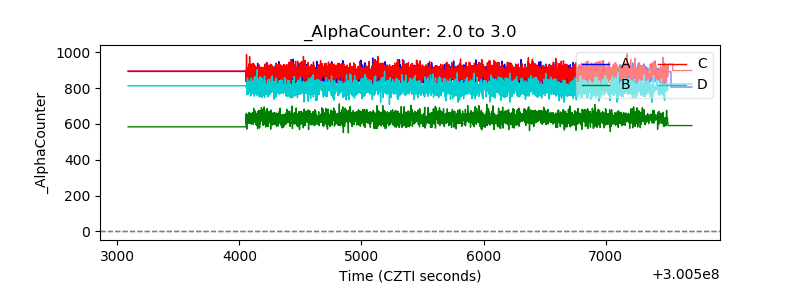 |
| _CPM_Rate | 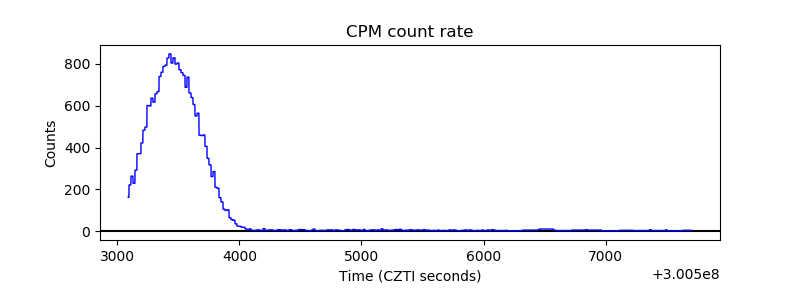 |
| CZT Counter | 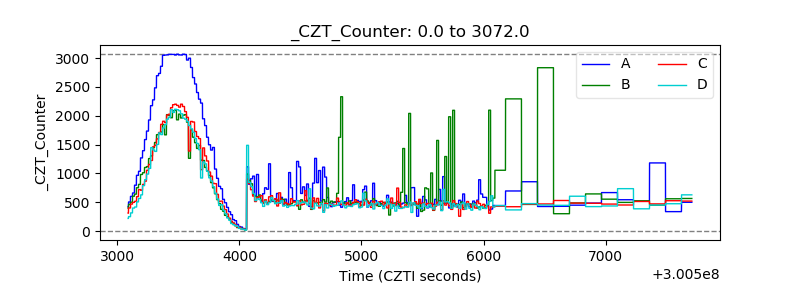 |
| +2.5 Volts monitor |  |
| +5 Volts monitor | 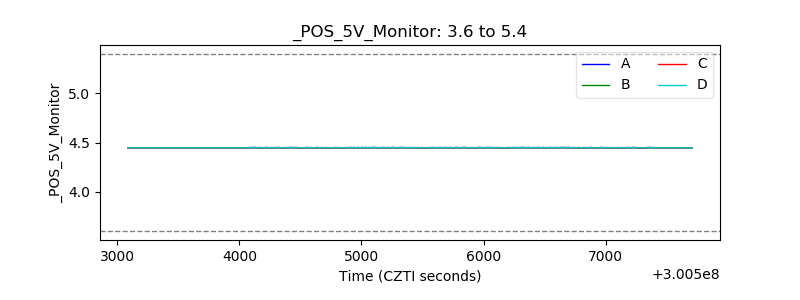 |
| _ROLL_ROT |  |
| _Roll_DEC |  |
| _Roll_RA | 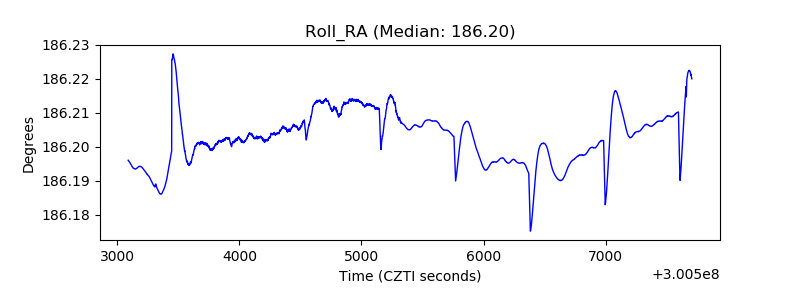 |
| Veto Counter | 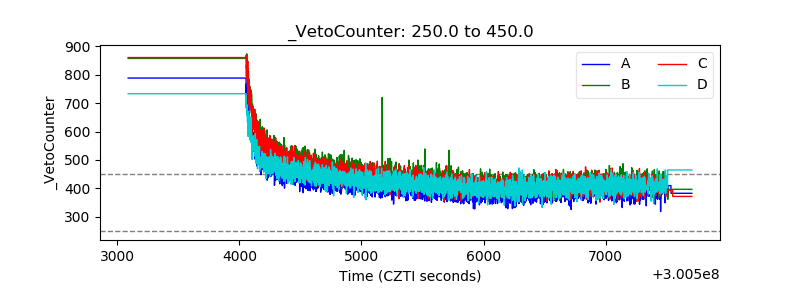 |