| Param | Original file | Final file |
|---|---|---|
| Filename | modeM0/AS1C04_009T06_9000003020cztM0_level2.fits | modeM0/AS1C04_009T06_9000003020cztM0_level2_quad_clean.evt |
| Size (bytes) | 144,469,440 | 113,281,920 |
| Size | 137.8 MB | 108.0 MB |
| Events in quadrant A | 875,450 | 628,681 |
| Events in quadrant B | 842,184 | 628,750 |
| Events in quadrant C | 859,476 | 593,589 |
| Events in quadrant D | 744,394 | 525,176 |
| Mode M0 | |||
|---|---|---|---|
| Quadrant | BADHDUFLAG | Total packets | Discarded packets |
| A | 0 | 31871 | 0 |
| B | 0 | 34437 | 0 |
| C | 0 | 32327 | 0 |
| D | 0 | 36748 | 0 |
| Mode SS | |||
|---|---|---|---|
| Quadrant | BADHDUFLAG | Total packets | Discarded packets |
| A | 0 | 310 | 0 |
| B | 0 | 310 | 0 |
| C | 0 | 310 | 0 |
| D | 0 | 310 | 0 |
| Mode M9 | |||
|---|---|---|---|
| Quadrant | BADHDUFLAG | Total packets | Discarded packets |
| A | 0 | 5 | 0 |
| B | 0 | 5 | 0 |
| C | 0 | 5 | 0 |
| D | 0 | 5 | 0 |
| Quadrant | Total seconds | Saturated seconds | Saturation percentage |
|---|---|---|---|
| A | 15258 | 228 | 1.494298% |
| B | 15258 | 299 | 1.959628% |
| C | 15258 | 206 | 1.350111% |
| D | 15258 | 604 | 3.958579% |
Noise dominated data is calculated using 1-second bins in cleaned event files. If a bin has >2000 counts, and if more than 50% of those come from <1% of pixels, then it is considered to be noise-dominated and hence unusable.
| Quadrant | # 1 sec bins | Bins with >0 counts | Bins with >2000 counts | High rate bins dominated by noise | Noise dominated (total time) | Noise dominated (detector-on time) | Marked lightcurve |
|---|---|---|---|---|---|---|---|
| A | 15938 | 15256 | 0 | 0 | 0.00% | 0.00% |  |
| B | 15938 | 15256 | 0 | 0 | 0.00% | 0.00% |  |
| C | 15938 | 15258 | 0 | 0 | 0.00% | 0.00% |  |
| D | 15938 | 15219 | 0 | 0 | 0.00% | 0.00% |  |
Top three noisy pixels from each quadrant. If the there are fewer than three noisy pixels in the level2.evt file, extra rows are filled as -1
| Pixel properties | Quadrant properties | ||||||
|---|---|---|---|---|---|---|---|
| Quadrant | DetID | PixID | Counts | Sigma | Mean | Median | Sigma |
| A | 0 | 29 | 861 | 11.18 | 227 | 215 | 57.8 |
| A | 7 | 110 | 721 | 8.76 | 227 | 215 | 57.8 |
| A | 9 | 19 | 677 | 7.99 | 227 | 215 | 57.8 |
| B | 2 | 9 | 690 | 10.51 | 223 | 213 | 45.4 |
| B | 2 | 8 | 605 | 8.64 | 223 | 213 | 45.4 |
| B | 5 | 128 | 573 | 7.93 | 223 | 213 | 45.4 |
| C | 12 | 241 | 617 | 6.82 | 227 | 213 | 59.3 |
| C | 2 | 191 | 616 | 6.8 | 227 | 213 | 59.3 |
| C | 3 | 187 | 600 | 6.53 | 227 | 213 | 59.3 |
| D | 10 | 189 | 563 | 6.28 | 212 | 193 | 58.9 |
| D | 4 | 160 | 556 | 6.16 | 212 | 193 | 58.9 |
| D | 4 | 246 | 548 | 6.02 | 212 | 193 | 58.9 |
Histogram calculated using DETX and DETY for each event in the final _common_clean file
| Quadrant A |  |
 |
Quadrant B |
|---|---|---|---|
| Quadrant D | 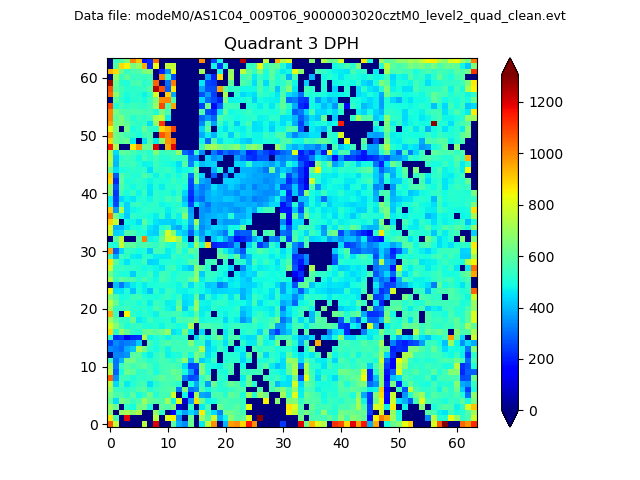 |
 |
Quadrant C |
| Plot type | Count rate plots | Images |
|---|---|---|
| Comparison with Poisson distribution Blue bars denote a histogram of data divided into 1 sec bins. Red curve is a Poisson curve with rate = median count rate of data. |
 |
 |
| Quadrant-wise count rates Data is divided into 100 sec bins |
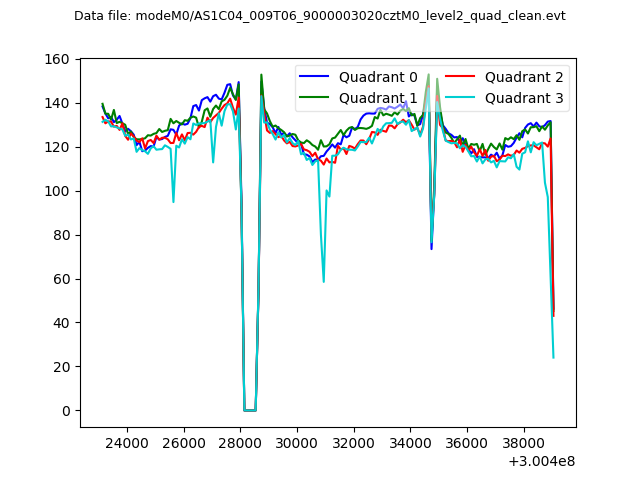 |
|
| Module-wise count rates for Quadrant A Data is divided into 100 sec bins |
 |
 |
| Module-wise count rates for Quadrant B Data is divided into 100 sec bins |
 |
 |
| Module-wise count rates for Quadrant C Data is divided into 100 sec bins |
 |
 |
| Module-wise count rates for Quadrant D Data is divided into 100 sec bins |
 |
 |
| Parameter | Plot |
|---|---|
| CZT HV Monitor | 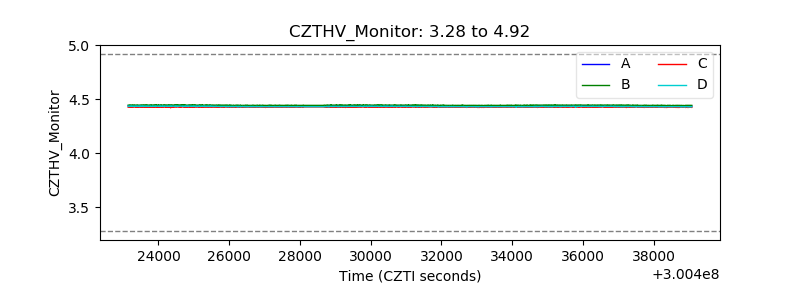 |
| D_VDD | 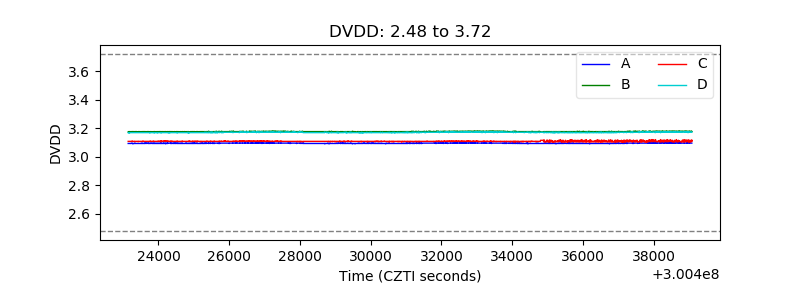 |
| Temperature 1 | 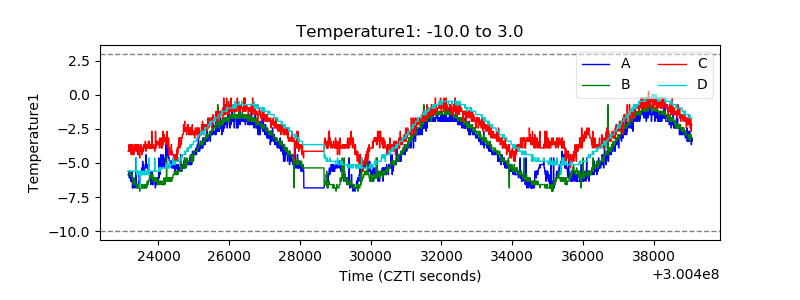 |
| Veto HV Monitor |  |
| Veto LLD |  |
| Alpha Counter |  |
| _CPM_Rate |  |
| CZT Counter |  |
| +2.5 Volts monitor |  |
| +5 Volts monitor | 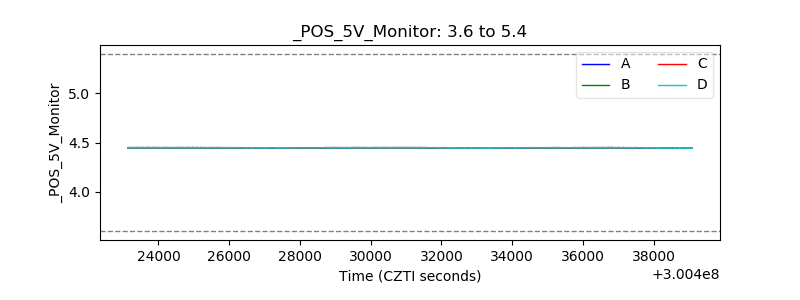 |
| _ROLL_ROT |  |
| _Roll_DEC | 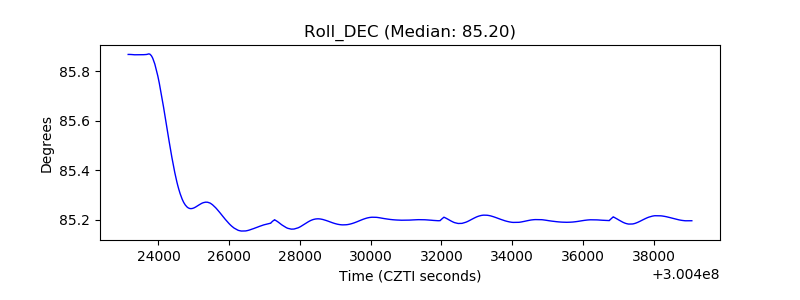 |
| _Roll_RA | 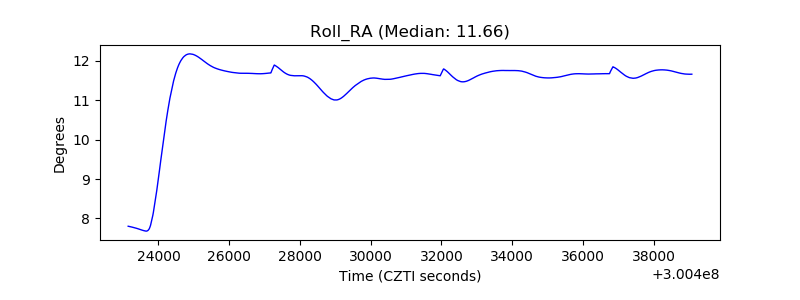 |
| Veto Counter |  |