| Param | Original file | Final file |
|---|---|---|
| Filename | modeM0/AS1C04_009T06_9000003020_20440cztM0_level2.evt | modeM0/AS1C04_009T06_9000003020_20440cztM0_level2_quad_clean.evt |
| Size (bytes) | 60,592,320 | 20,269,440 |
| Size | 57.8 MB | 19.3 MB |
| Events in quadrant A | 446,716 | 134,881 |
| Events in quadrant B | 458,095 | 135,801 |
| Events in quadrant C | 446,785 | 131,902 |
| Events in quadrant D | 410,591 | 132,299 |
| Mode M0 | |||
|---|---|---|---|
| Quadrant | BADHDUFLAG | Total packets | Discarded packets |
| A | 0 | 2067 | 0 |
| B | 0 | 2051 | 0 |
| C | 0 | 2048 | 0 |
| D | 0 | 2045 | 0 |
| Mode SS | |||
|---|---|---|---|
| Quadrant | BADHDUFLAG | Total packets | Discarded packets |
| A | 0 | 20 | 0 |
| B | 0 | 20 | 0 |
| C | 0 | 20 | 0 |
| D | 0 | 20 | 0 |
| Quadrant | Total seconds | Saturated seconds | Saturation percentage |
|---|---|---|---|
| A | 1022 | 2 | 0.195695% |
| B | 1022 | 2 | 0.195695% |
| C | 1022 | 1 | 0.097847% |
| D | 1022 | 0 | 0.000000% |
Noise dominated data is calculated using 1-second bins in cleaned event files. If a bin has >2000 counts, and if more than 50% of those come from <1% of pixels, then it is considered to be noise-dominated and hence unusable.
| Quadrant | # 1 sec bins | Bins with >0 counts | Bins with >2000 counts | High rate bins dominated by noise | Noise dominated (total time) | Noise dominated (detector-on time) | Marked lightcurve |
|---|---|---|---|---|---|---|---|
| A | 1022 | 1022 | 2 | 2 | 0.20% | 0.20% | 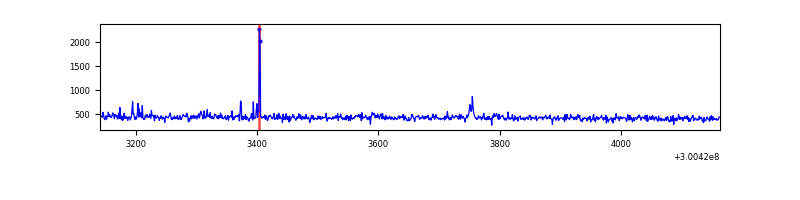 |
| B | 1022 | 1022 | 0 | 0 | 0.00% | 0.00% | 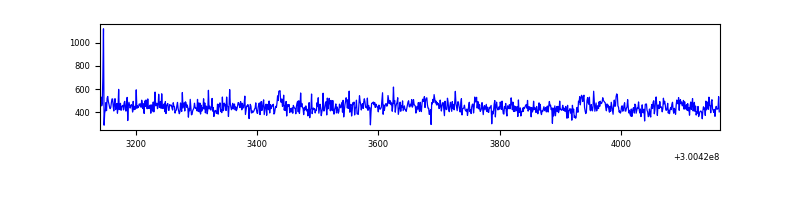 |
| C | 1022 | 1022 | 0 | 0 | 0.00% | 0.00% | 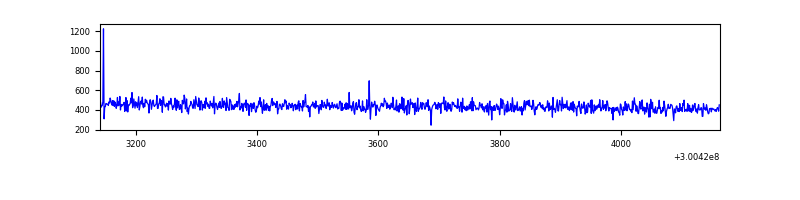 |
| D | 1022 | 1022 | 0 | 0 | 0.00% | 0.00% | 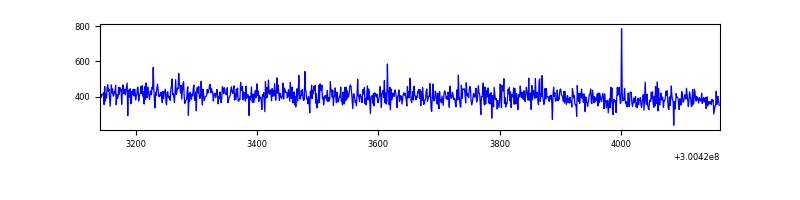 |
Top three noisy pixels from each quadrant. If the there are fewer than three noisy pixels in the level2.evt file, extra rows are filled as -1
| Pixel properties | Quadrant properties | ||||||
|---|---|---|---|---|---|---|---|
| Quadrant | DetID | PixID | Counts | Sigma | Mean | Median | Sigma |
| A | 5 | 16 | 10123 | 414.29 | 112 | 110 | 24.2 |
| A | 12 | 16 | 2195 | 86.27 | 112 | 110 | 24.2 |
| A | 10 | 253 | 1173 | 43.98 | 112 | 110 | 24.2 |
| B | 0 | 219 | 13099 | 549.84 | 113 | 111 | 23.6 |
| B | 12 | 111 | 2596 | 105.2 | 113 | 111 | 23.6 |
| B | 11 | 111 | 2213 | 88.99 | 113 | 111 | 23.6 |
| C | 14 | 238 | 17202 | 629.99 | 109 | 109 | 27.1 |
| C | 3 | 233 | 1171 | 39.14 | 109 | 109 | 27.1 |
| C | 9 | 221 | 846 | 27.16 | 109 | 109 | 27.1 |
| D | 2 | 234 | 3382 | 116.46 | 108 | 105 | 28.1 |
| D | 13 | 153 | 1090 | 35.01 | 108 | 105 | 28.1 |
| D | 14 | 226 | 1023 | 32.62 | 108 | 105 | 28.1 |
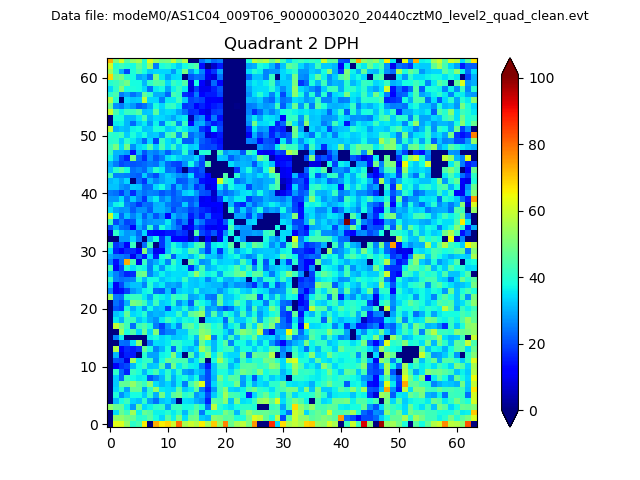
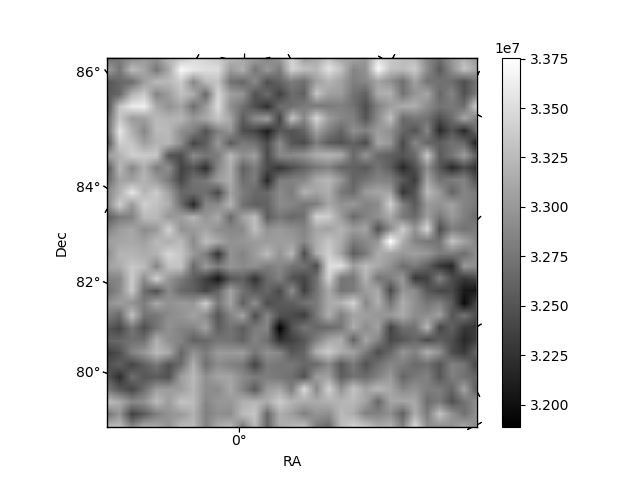
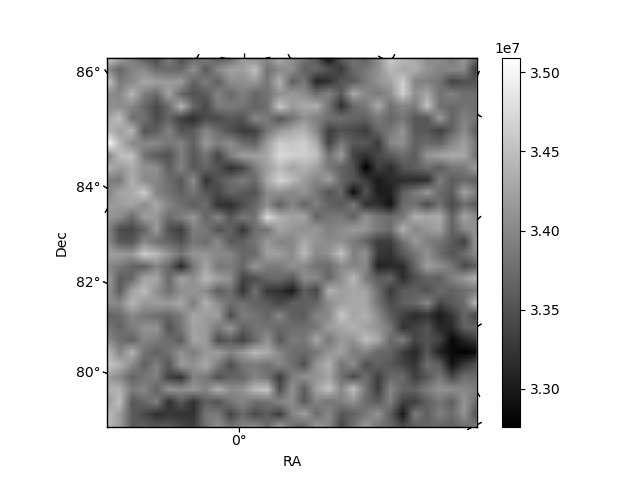
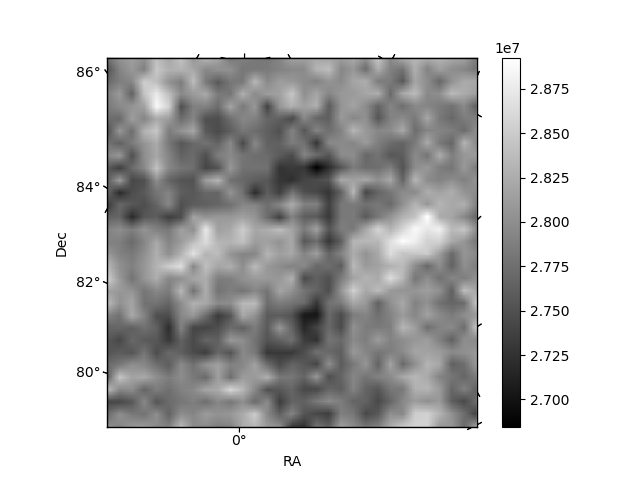
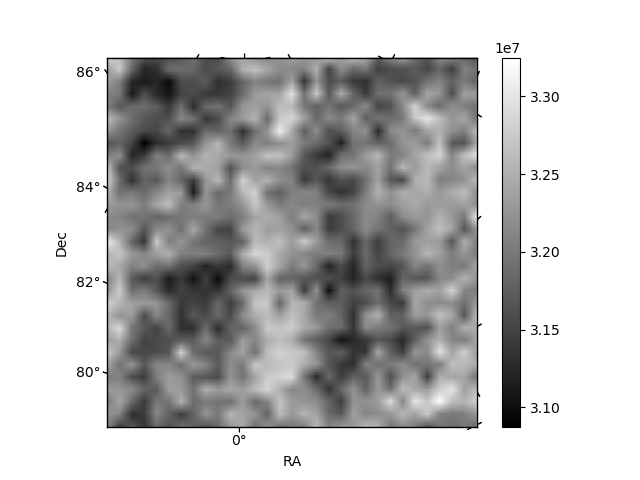
Histogram calculated using DETX and DETY for each event in the final _common_clean file
| Quadrant A | 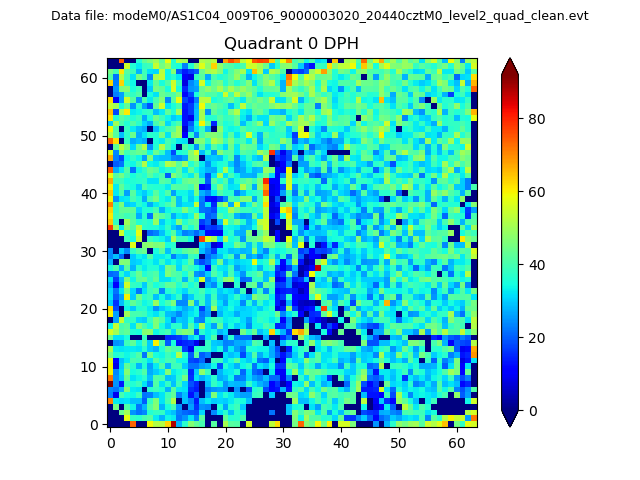 |
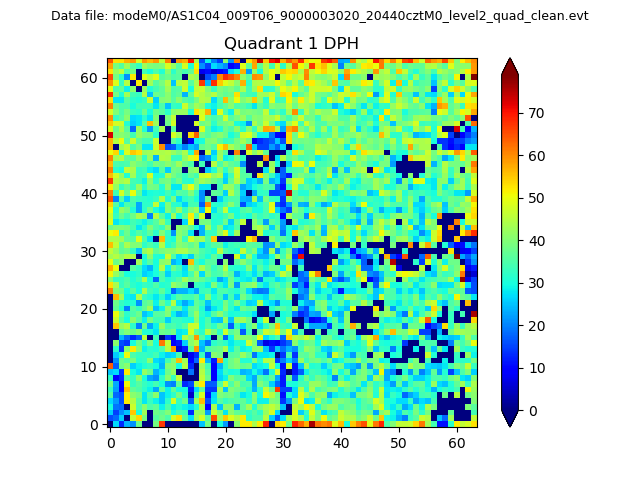 |
Quadrant B |
|---|---|---|---|
| Quadrant D | 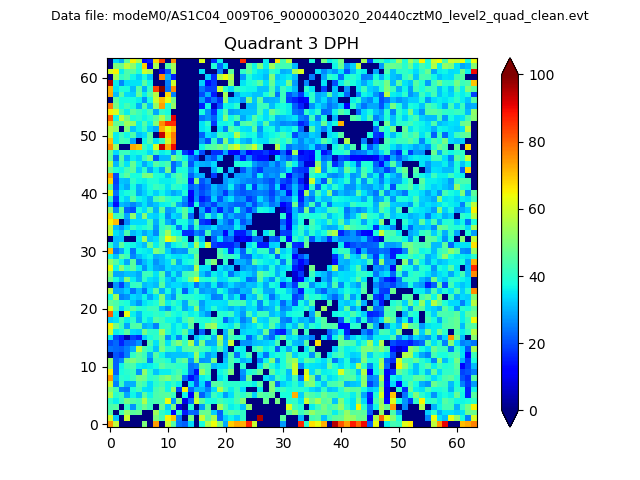 |
 |
Quadrant C |
| Plot type | Count rate plots | Images |
|---|---|---|
| Comparison with Poisson distribution Blue bars denote a histogram of data divided into 1 sec bins. Red curve is a Poisson curve with rate = median count rate of data. |
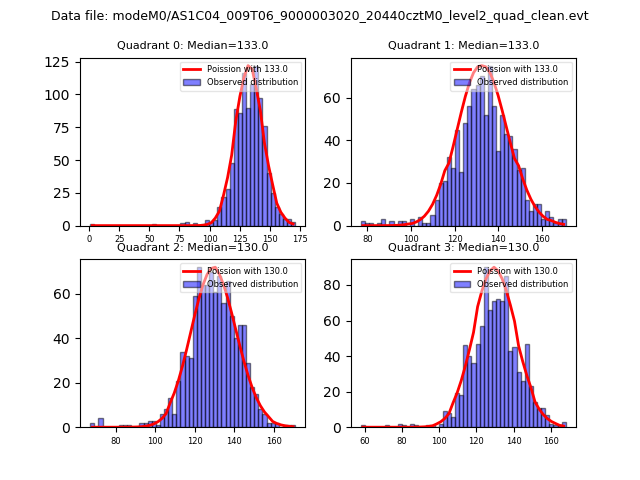 |
 |
| Quadrant-wise count rates Data is divided into 100 sec bins |
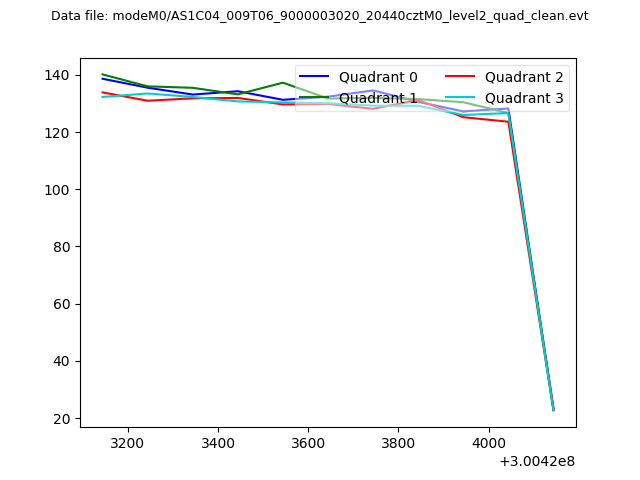 |
|
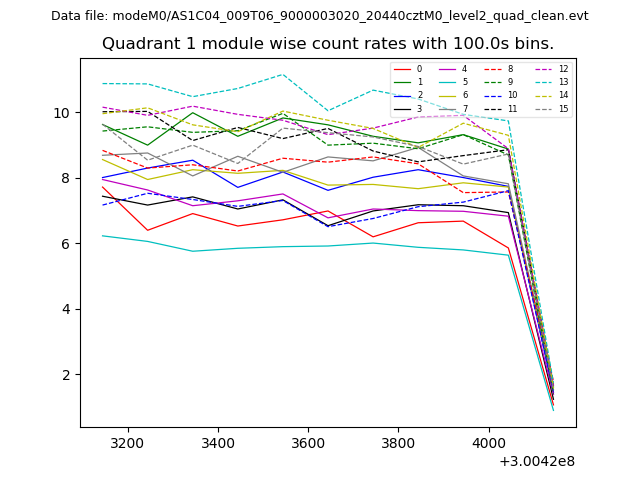
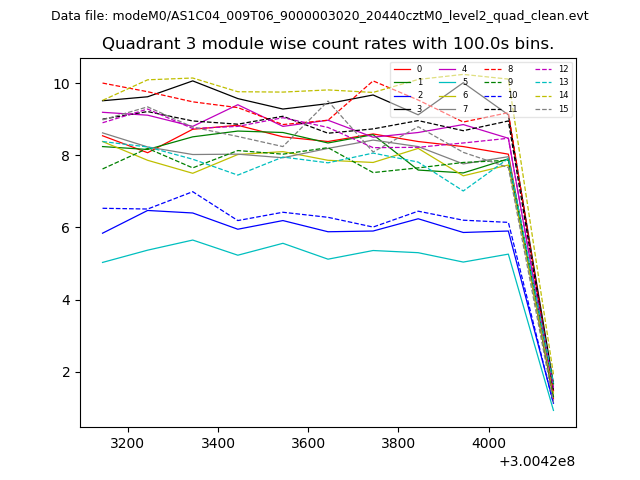
| Module-wise count rates for Quadrant A Data is divided into 100 sec bins |
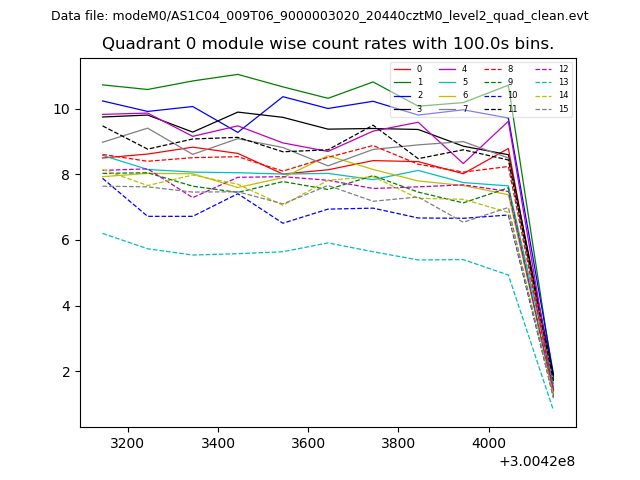 |
 |
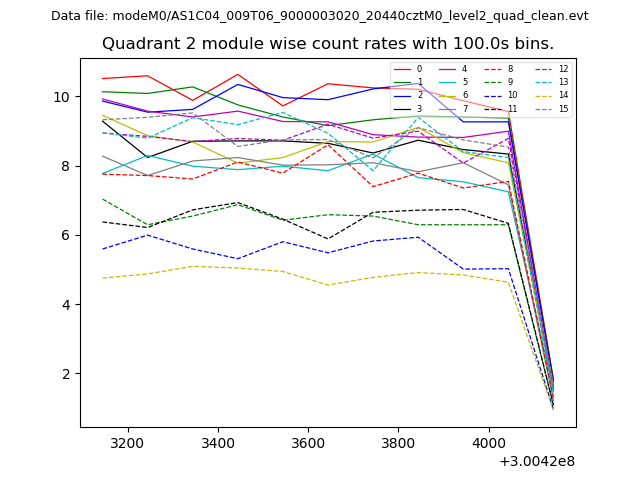
| Module-wise count rates for Quadrant B Data is divided into 100 sec bins |
 |
 |
| Module-wise count rates for Quadrant C Data is divided into 100 sec bins |
 |
 |
| Module-wise count rates for Quadrant D Data is divided into 100 sec bins |
 |
 |
| Parameter | Plot |
|---|---|
| CZT HV Monitor | 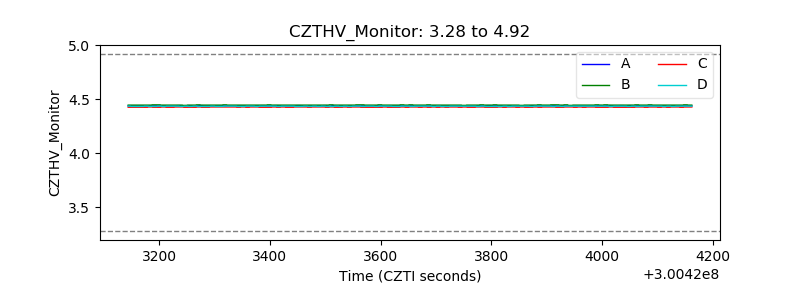 |
| D_VDD | 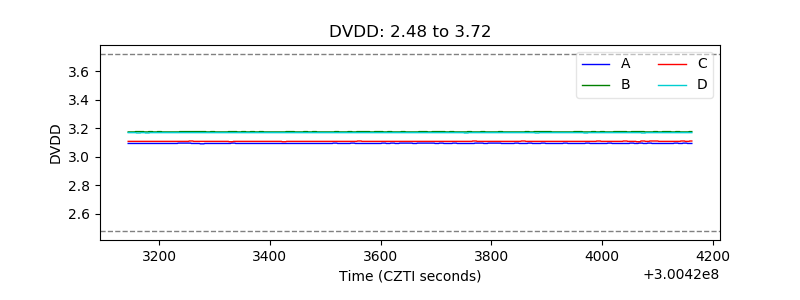 |
| Temperature 1 | 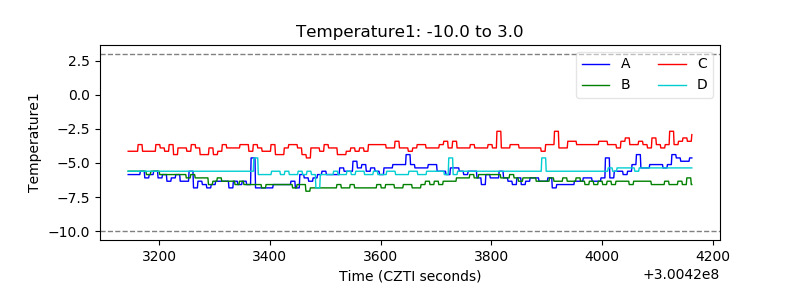 |
| Veto HV Monitor | 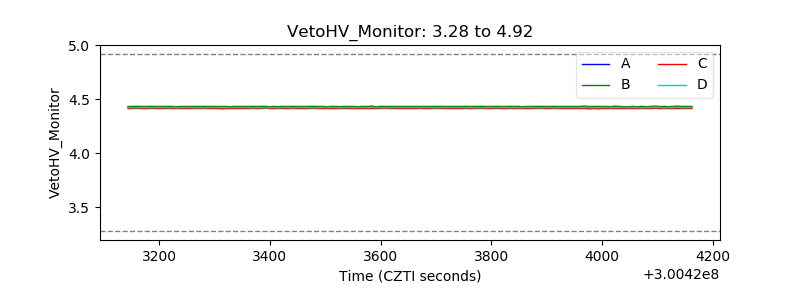 |
| Veto LLD | 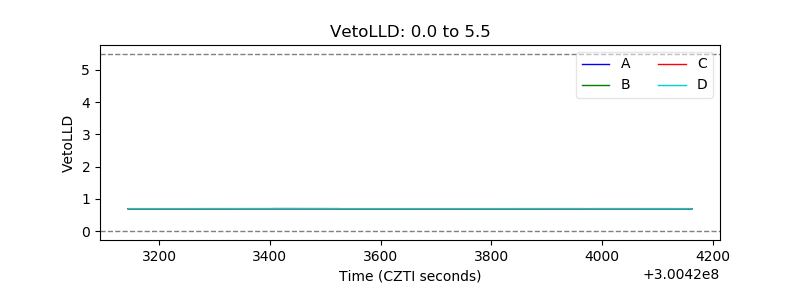 |
| Alpha Counter | 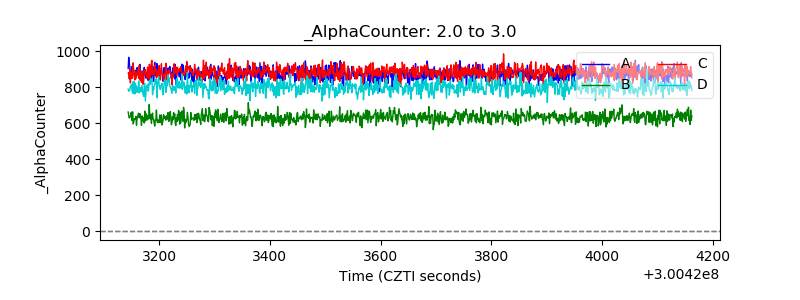 |
| _CPM_Rate | 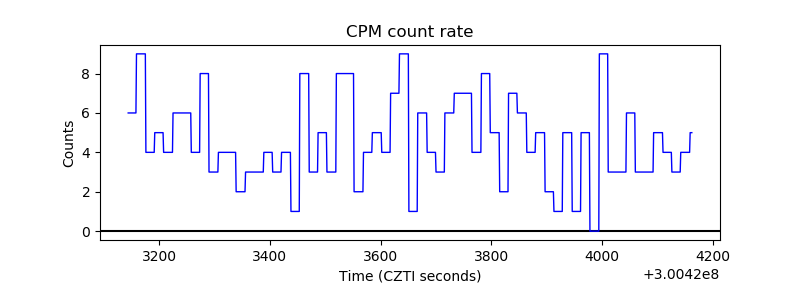 |
| CZT Counter | 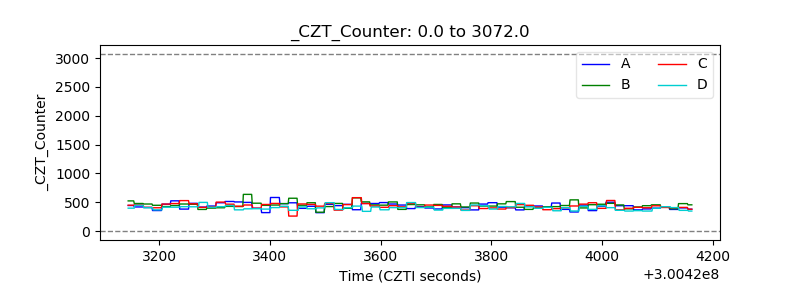 |
| +2.5 Volts monitor |  |
| +5 Volts monitor |  |
| _ROLL_ROT | 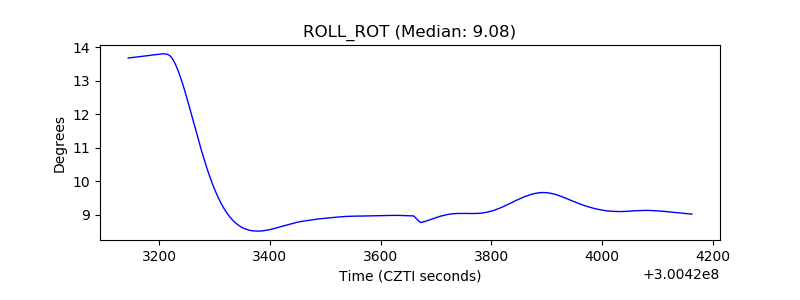 |
| _Roll_DEC | 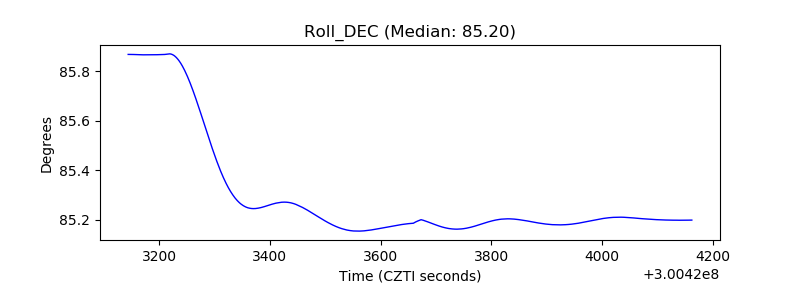 |
| _Roll_RA |  |
| Veto Counter | 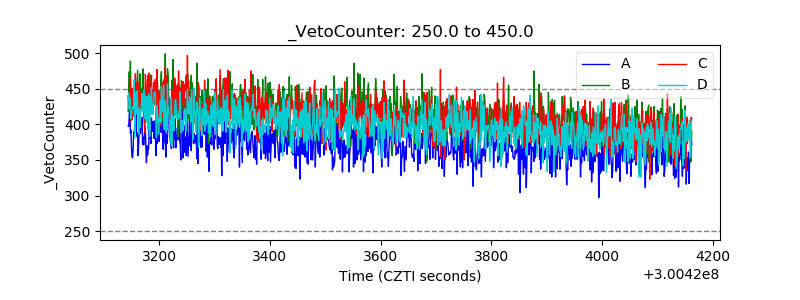 |