| Param | Original file | Final file |
|---|---|---|
| Filename | modeM0/AS1C04_009T06_9000003020_20441cztM0_level2.evt | modeM0/AS1C04_009T06_9000003020_20441cztM0_level2_quad_clean.evt |
| Size (bytes) | 445,847,040 | 127,399,680 |
| Size | 425.2 MB | 121.5 MB |
| Events in quadrant A | 3,123,167 | 864,437 |
| Events in quadrant B | 3,622,561 | 866,497 |
| Events in quadrant C | 3,036,911 | 841,359 |
| Events in quadrant D | 3,272,186 | 827,279 |
| Mode M0 | |||
|---|---|---|---|
| Quadrant | BADHDUFLAG | Total packets | Discarded packets |
| A | 0 | 13709 | 2 |
| B | 0 | 15258 | 3 |
| C | 0 | 13467 | 2 |
| D | 0 | 14664 | 2 |
| Mode SS | |||
|---|---|---|---|
| Quadrant | BADHDUFLAG | Total packets | Discarded packets |
| A | 0 | 136 | 0 |
| B | 0 | 136 | 0 |
| C | 0 | 136 | 0 |
| D | 0 | 136 | 0 |
| Mode M9 | |||
|---|---|---|---|
| Quadrant | BADHDUFLAG | Total packets | Discarded packets |
| A | 0 | 5 | 0 |
| B | 0 | 5 | 0 |
| C | 0 | 5 | 0 |
| D | 0 | 5 | 0 |
| Quadrant | Total seconds | Saturated seconds | Saturation percentage |
|---|---|---|---|
| A | 6575 | 80 | 1.216730% |
| B | 6574 | 146 | 2.220870% |
| C | 6574 | 85 | 1.292972% |
| D | 6574 | 145 | 2.205659% |
Noise dominated data is calculated using 1-second bins in cleaned event files. If a bin has >2000 counts, and if more than 50% of those come from <1% of pixels, then it is considered to be noise-dominated and hence unusable.
| Quadrant | # 1 sec bins | Bins with >0 counts | Bins with >2000 counts | High rate bins dominated by noise | Noise dominated (total time) | Noise dominated (detector-on time) | Marked lightcurve |
|---|---|---|---|---|---|---|---|
| A | 7175 | 6576 | 6 | 6 | 0.08% | 0.09% | 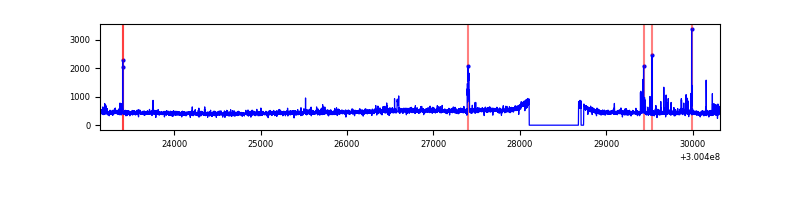 |
| B | 7174 | 6575 | 30 | 30 | 0.42% | 0.46% | 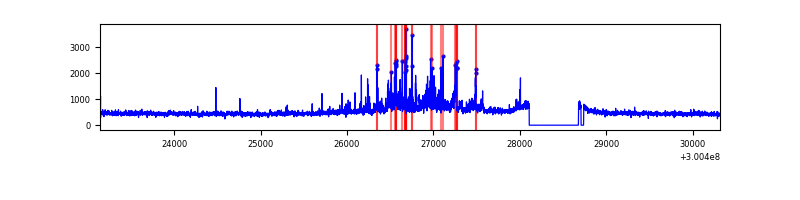 |
| C | 7174 | 6576 | 0 | 0 | 0.00% | 0.00% | 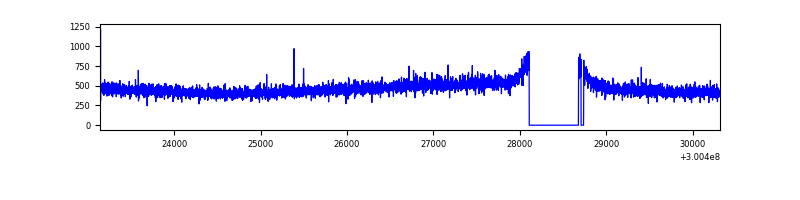 |
| D | 7174 | 6575 | 94 | 94 | 1.31% | 1.43% | 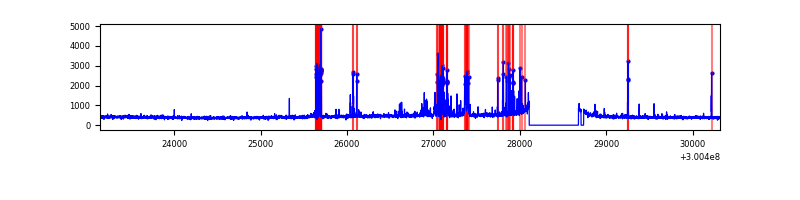 |
Top three noisy pixels from each quadrant. If the there are fewer than three noisy pixels in the level2.evt file, extra rows are filled as -1
| Pixel properties | Quadrant properties | ||||||
|---|---|---|---|---|---|---|---|
| Quadrant | DetID | PixID | Counts | Sigma | Mean | Median | Sigma |
| A | 5 | 16 | 69089 | 440.56 | 774 | 758 | 155.1 |
| A | 12 | 16 | 37124 | 234.47 | 774 | 758 | 155.1 |
| A | 5 | 168 | 23837 | 148.8 | 774 | 758 | 155.1 |
| B | 7 | 220 | 186002 | 1281.18 | 771 | 753 | 144.6 |
| B | 0 | 197 | 164166 | 1130.16 | 771 | 753 | 144.6 |
| B | 0 | 219 | 80575 | 552.05 | 771 | 753 | 144.6 |
| C | 14 | 238 | 119152 | 691.5 | 743 | 747 | 171.2 |
| C | 3 | 233 | 11432 | 62.4 | 743 | 747 | 171.2 |
| C | 9 | 54 | 8288 | 44.04 | 743 | 747 | 171.2 |
| D | 12 | 218 | 206239 | 1138.87 | 745 | 720 | 180.5 |
| D | 7 | 38 | 68487 | 375.52 | 745 | 720 | 180.5 |
| D | 13 | 153 | 56384 | 308.46 | 745 | 720 | 180.5 |
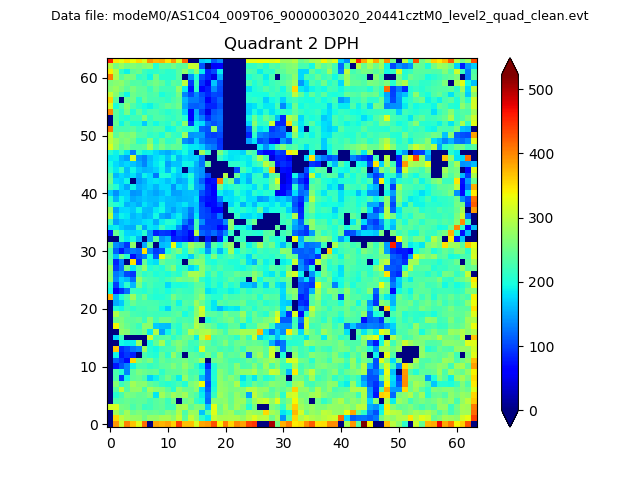
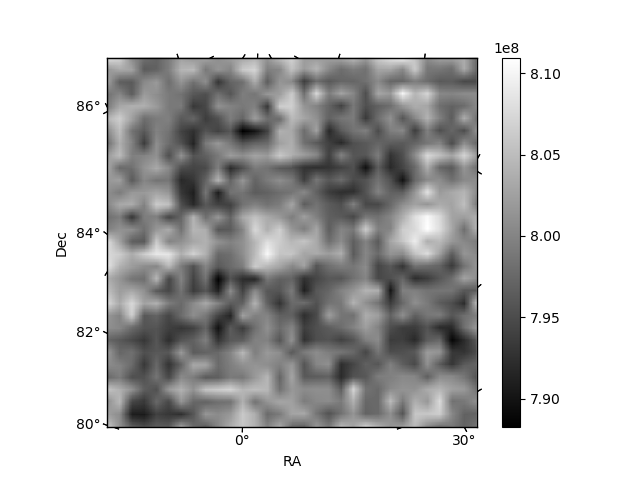
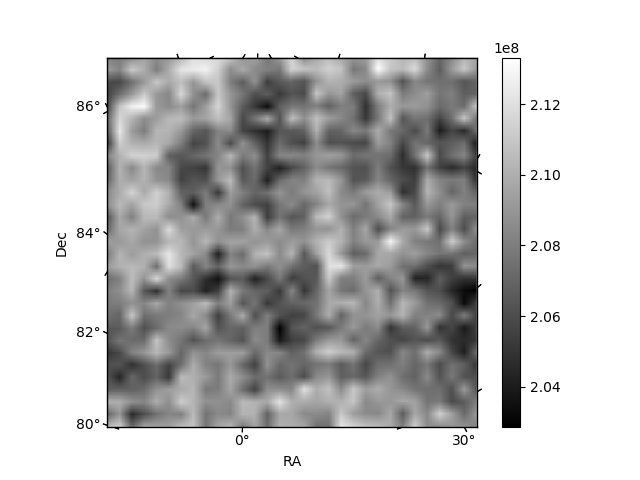
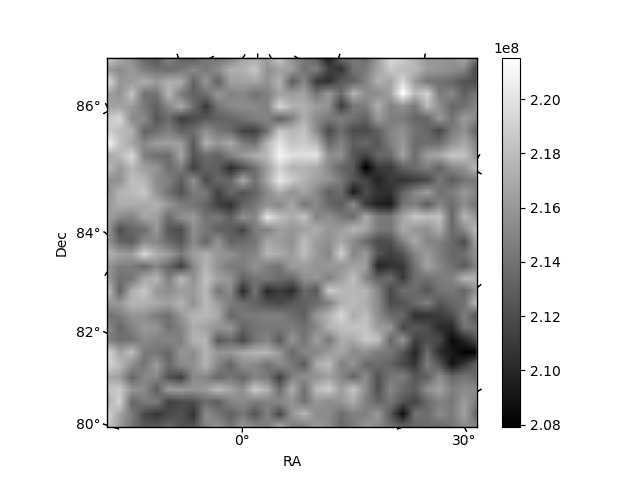
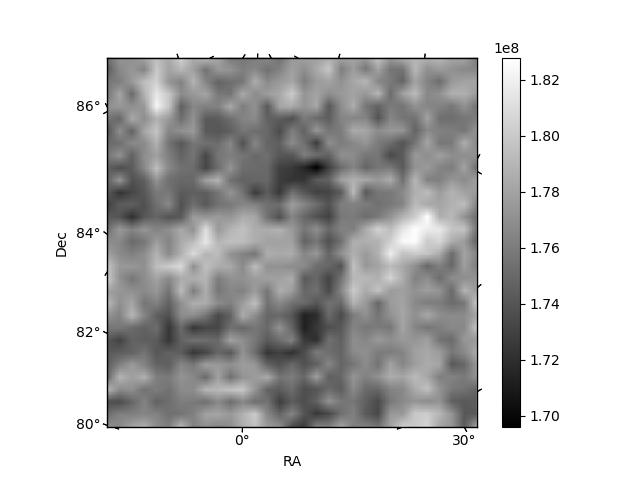
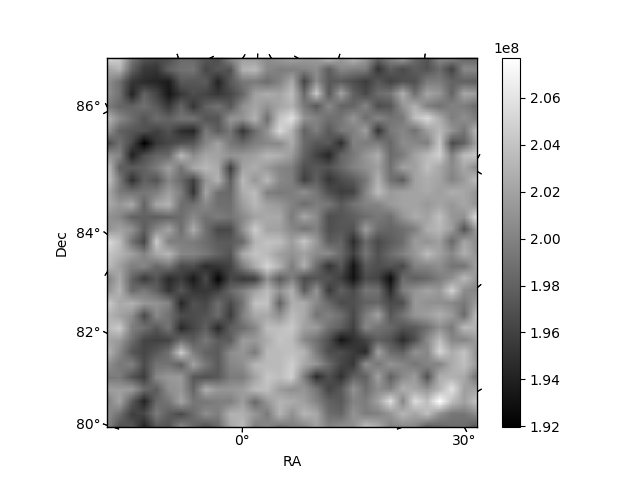
Histogram calculated using DETX and DETY for each event in the final _common_clean file
| Quadrant A | 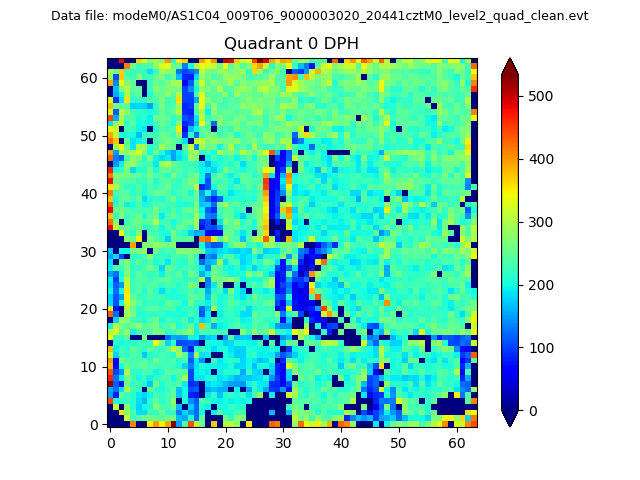 |
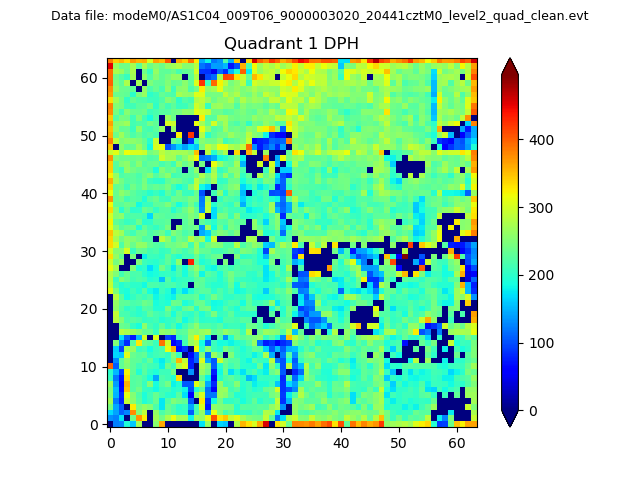 |
Quadrant B |
|---|---|---|---|
| Quadrant D | 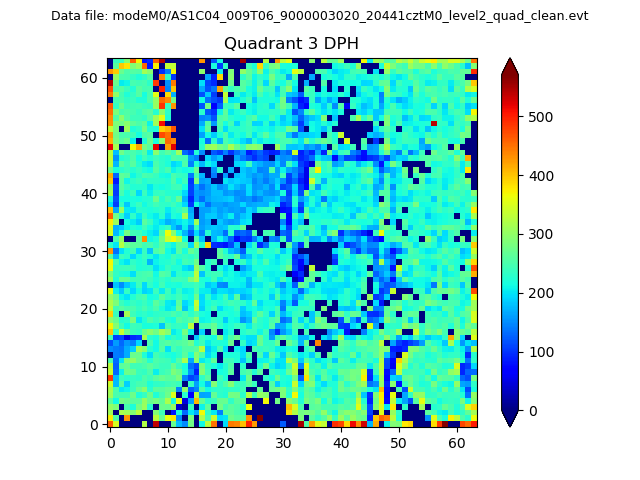 |
 |
Quadrant C |
| Plot type | Count rate plots | Images |
|---|---|---|
| Comparison with Poisson distribution Blue bars denote a histogram of data divided into 1 sec bins. Red curve is a Poisson curve with rate = median count rate of data. |
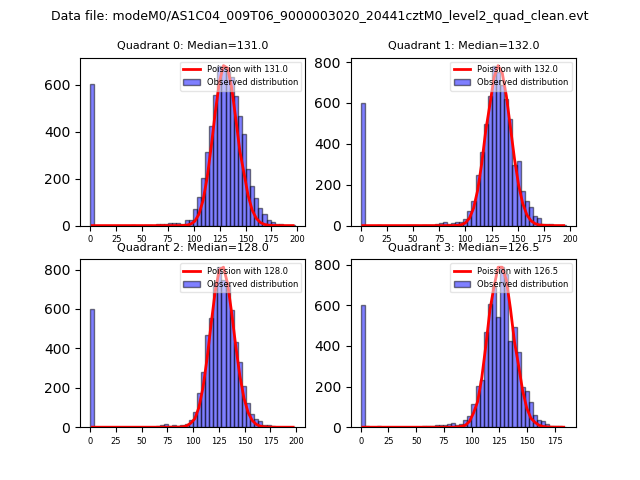 |
 |
| Quadrant-wise count rates Data is divided into 100 sec bins |
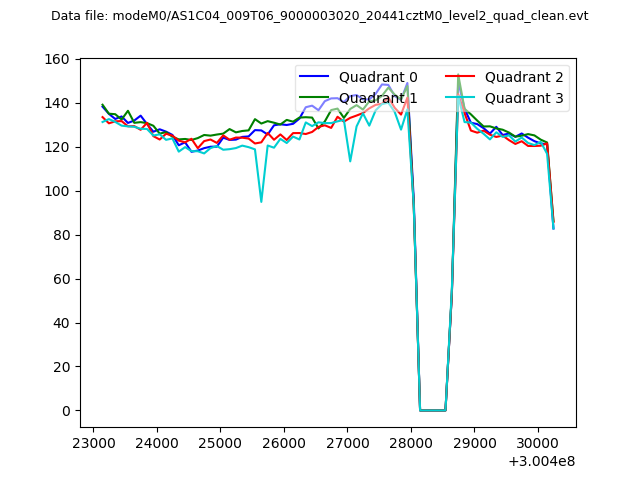 |
|
| Module-wise count rates for Quadrant A Data is divided into 100 sec bins |
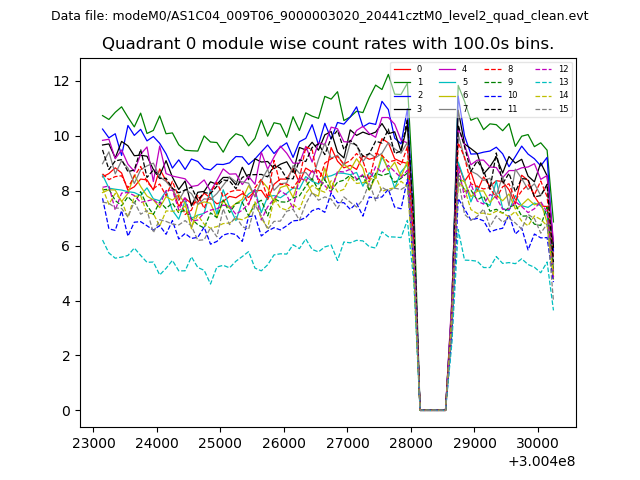 |
 |
| Module-wise count rates for Quadrant B Data is divided into 100 sec bins |
 |
 |
| Module-wise count rates for Quadrant C Data is divided into 100 sec bins |
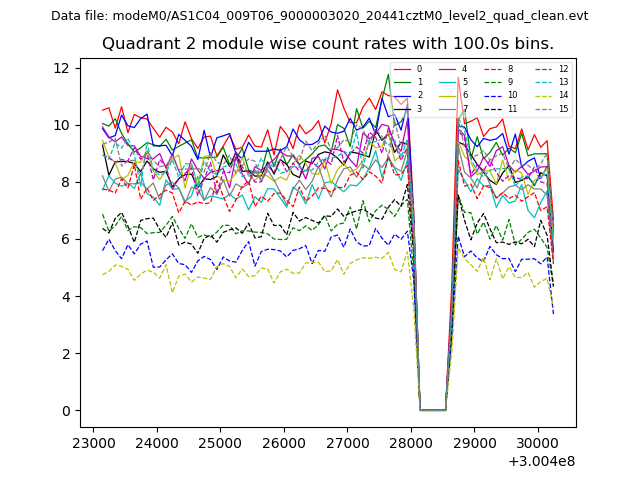 |
 |
| Module-wise count rates for Quadrant D Data is divided into 100 sec bins |
 |
 |
| Parameter | Plot |
|---|---|
| CZT HV Monitor | 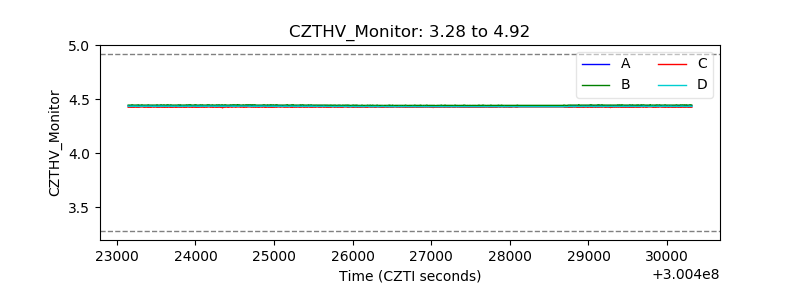 |
| D_VDD | 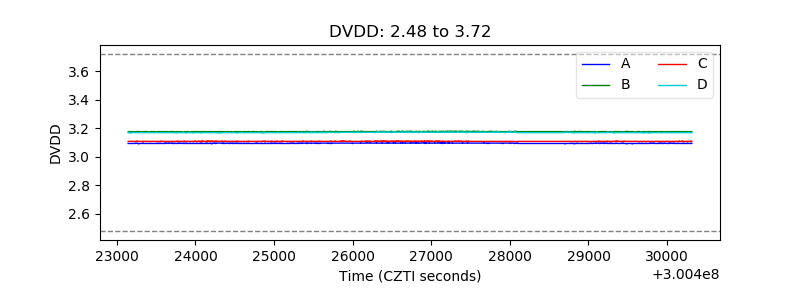 |
| Temperature 1 |  |
| Veto HV Monitor | 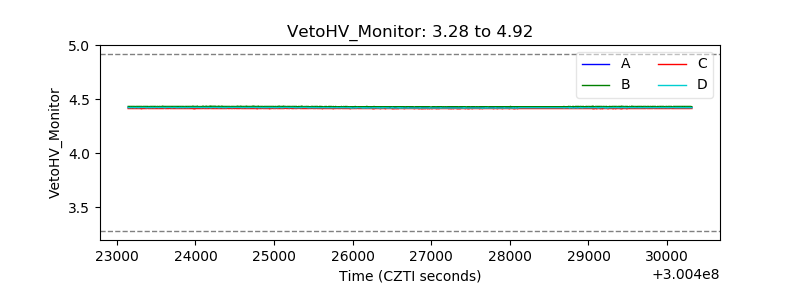 |
| Veto LLD | 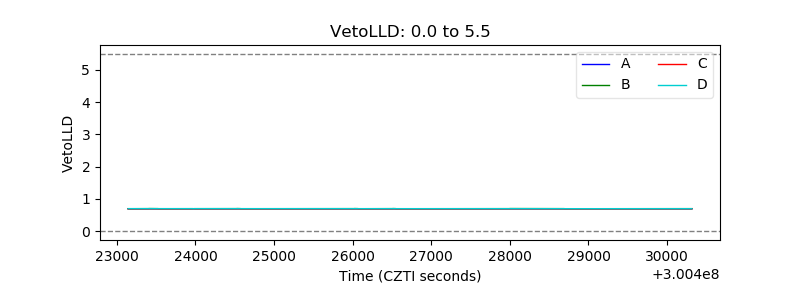 |
| Alpha Counter | 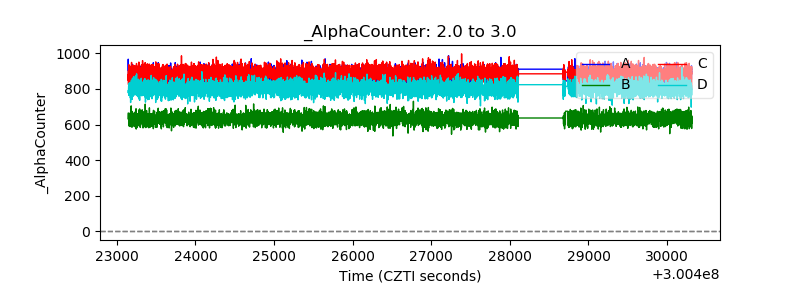 |
| _CPM_Rate | 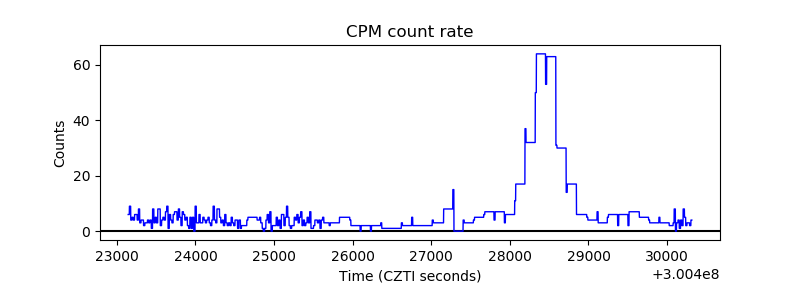 |
| CZT Counter | 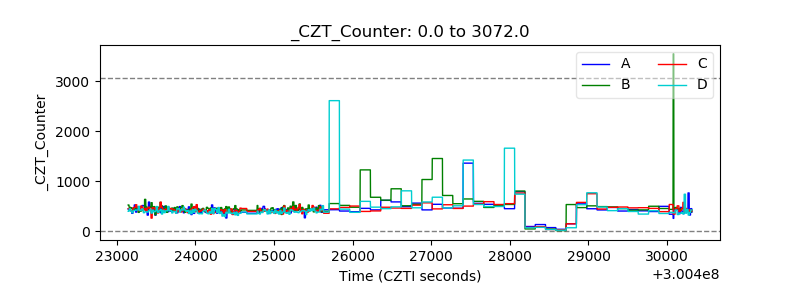 |
| +2.5 Volts monitor |  |
| +5 Volts monitor |  |
| _ROLL_ROT | 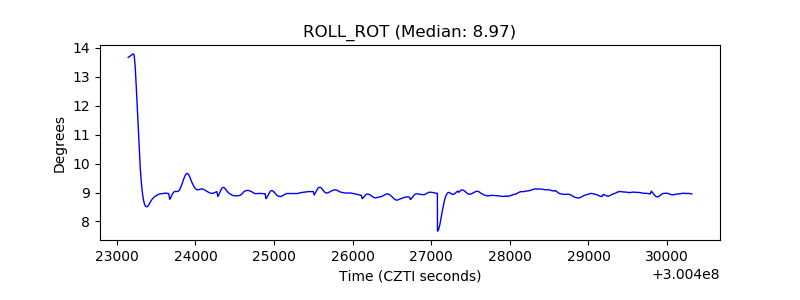 |
| _Roll_DEC |  |
| _Roll_RA | 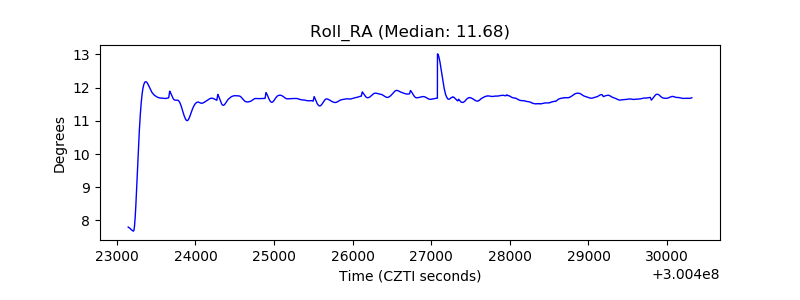 |
| Veto Counter |  |