| Param | Original file | Final file |
|---|---|---|
| Filename | modeM0/AS1C04_009T06_9000003020_20443cztM0_level2.evt | modeM0/AS1C04_009T06_9000003020_20443cztM0_level2_quad_clean.evt |
| Size (bytes) | 660,277,440 | 172,664,640 |
| Size | 629.7 MB | 164.7 MB |
| Events in quadrant A | 4,393,512 | 1,175,348 |
| Events in quadrant B | 4,766,420 | 1,181,911 |
| Events in quadrant C | 4,651,815 | 1,131,613 |
| Events in quadrant D | 5,555,714 | 1,097,465 |
| Mode M0 | |||
|---|---|---|---|
| Quadrant | BADHDUFLAG | Total packets | Discarded packets |
| A | 0 | 19396 | 1 |
| B | 0 | 20360 | 1 |
| C | 0 | 20039 | 1 |
| D | 0 | 23283 | 1 |
| Mode SS | |||
|---|---|---|---|
| Quadrant | BADHDUFLAG | Total packets | Discarded packets |
| A | 0 | 186 | 0 |
| B | 0 | 186 | 0 |
| C | 0 | 186 | 0 |
| D | 0 | 186 | 0 |
| Quadrant | Total seconds | Saturated seconds | Saturation percentage |
|---|---|---|---|
| A | 9272 | 151 | 1.628559% |
| B | 9272 | 153 | 1.650129% |
| C | 9272 | 121 | 1.305004% |
| D | 9273 | 460 | 4.960638% |
Noise dominated data is calculated using 1-second bins in cleaned event files. If a bin has >2000 counts, and if more than 50% of those come from <1% of pixels, then it is considered to be noise-dominated and hence unusable.
| Quadrant | # 1 sec bins | Bins with >0 counts | Bins with >2000 counts | High rate bins dominated by noise | Noise dominated (total time) | Noise dominated (detector-on time) | Marked lightcurve |
|---|---|---|---|---|---|---|---|
| A | 9352 | 9273 | 5 | 5 | 0.05% | 0.05% |  |
| B | 9352 | 9272 | 5 | 5 | 0.05% | 0.05% |  |
| C | 9352 | 9273 | 0 | 0 | 0.00% | 0.00% |  |
| D | 9353 | 9274 | 309 | 309 | 3.30% | 3.33% |  |
Top three noisy pixels from each quadrant. If the there are fewer than three noisy pixels in the level2.evt file, extra rows are filled as -1
| Pixel properties | Quadrant properties | ||||||
|---|---|---|---|---|---|---|---|
| Quadrant | DetID | PixID | Counts | Sigma | Mean | Median | Sigma |
| A | 5 | 16 | 112478 | 508.38 | 1088 | 1063 | 219.2 |
| A | 14 | 111 | 53113 | 237.5 | 1088 | 1063 | 219.2 |
| A | 12 | 16 | 41902 | 186.35 | 1088 | 1063 | 219.2 |
| B | 0 | 197 | 221665 | 1093.09 | 1078 | 1052 | 201.8 |
| B | 0 | 189 | 103009 | 505.17 | 1078 | 1052 | 201.8 |
| B | 0 | 190 | 58345 | 283.87 | 1078 | 1052 | 201.8 |
| C | 9 | 54 | 408677 | 1704.63 | 1033 | 1037 | 239.1 |
| C | 14 | 238 | 166246 | 690.85 | 1033 | 1037 | 239.1 |
| C | 3 | 233 | 36638 | 148.87 | 1033 | 1037 | 239.1 |
| D | 1 | 52 | 758309 | 3003.27 | 1038 | 1007 | 252.2 |
| D | 12 | 218 | 444486 | 1758.73 | 1038 | 1007 | 252.2 |
| D | 13 | 153 | 128689 | 506.35 | 1038 | 1007 | 252.2 |
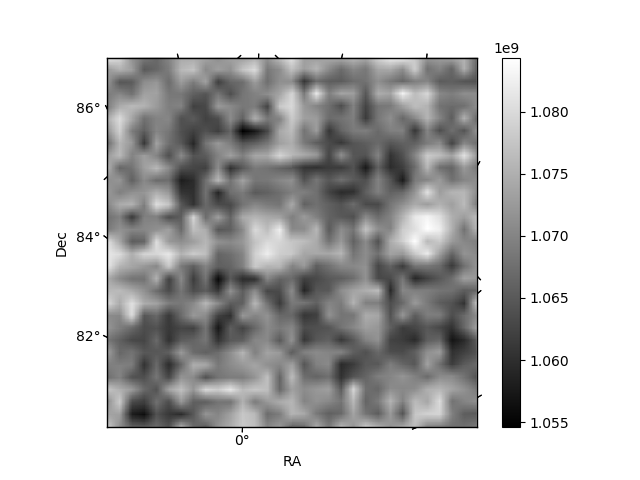
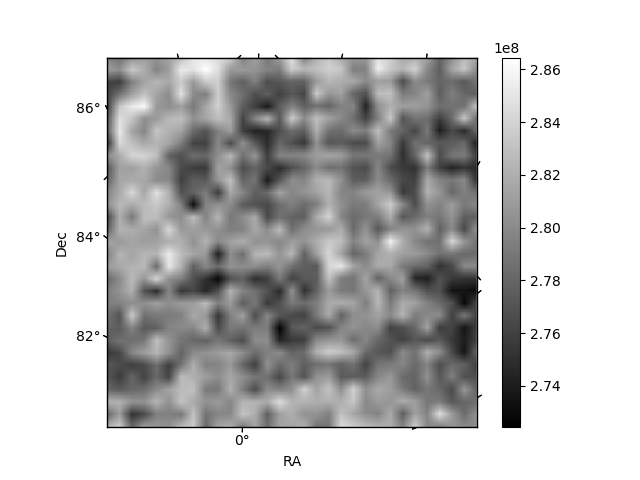
Histogram calculated using DETX and DETY for each event in the final _common_clean file
| Quadrant A | 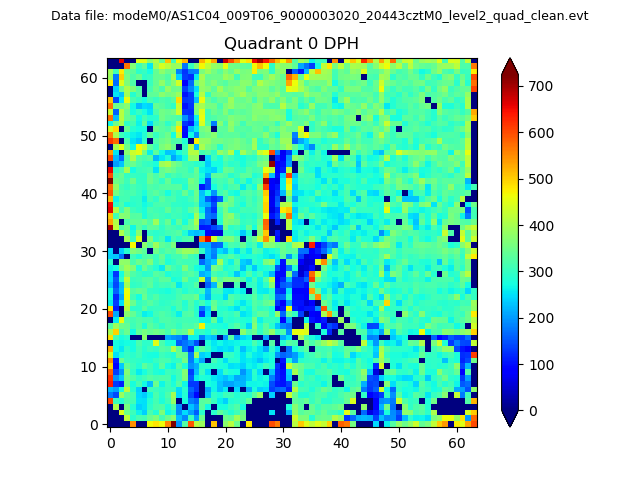 |
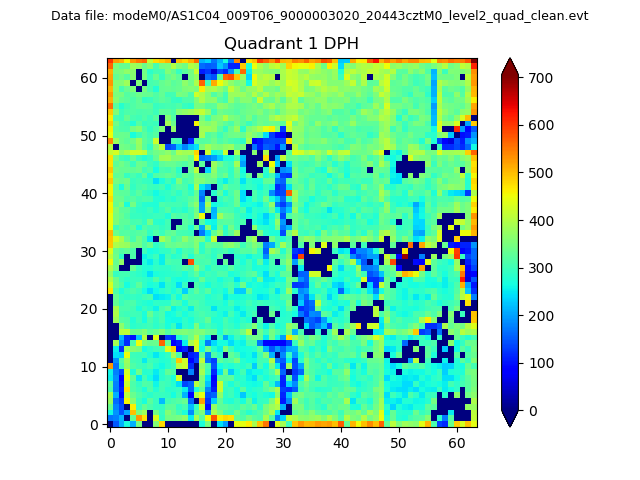 |
Quadrant B |
|---|---|---|---|
| Quadrant D |  |
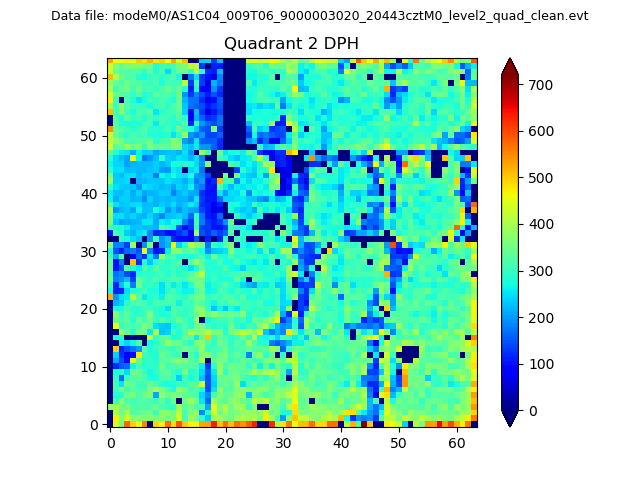 |
Quadrant C |
| Plot type | Count rate plots | Images |
|---|---|---|
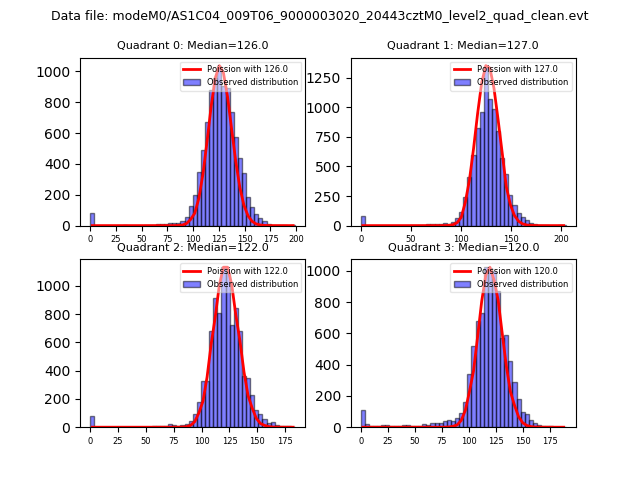
| Comparison with Poisson distribution Blue bars denote a histogram of data divided into 1 sec bins. Red curve is a Poisson curve with rate = median count rate of data. |
 |
 |
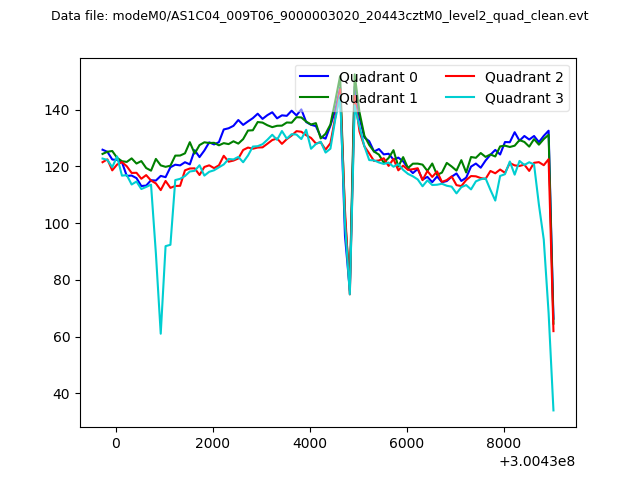
| Quadrant-wise count rates Data is divided into 100 sec bins |
 |
|
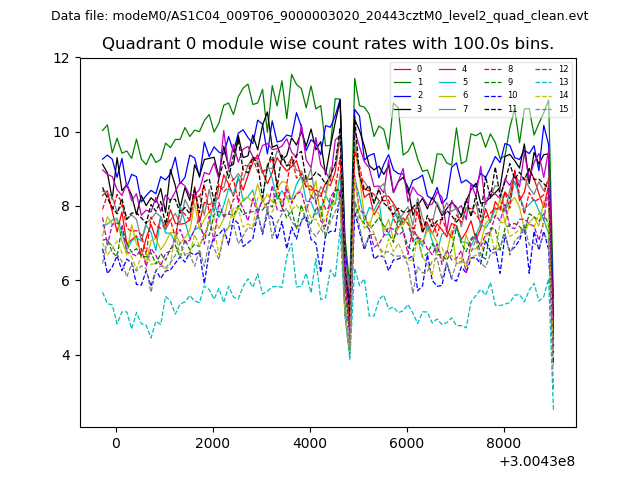
| Module-wise count rates for Quadrant A Data is divided into 100 sec bins |
 |
 |
| Module-wise count rates for Quadrant B Data is divided into 100 sec bins |
 |
 |
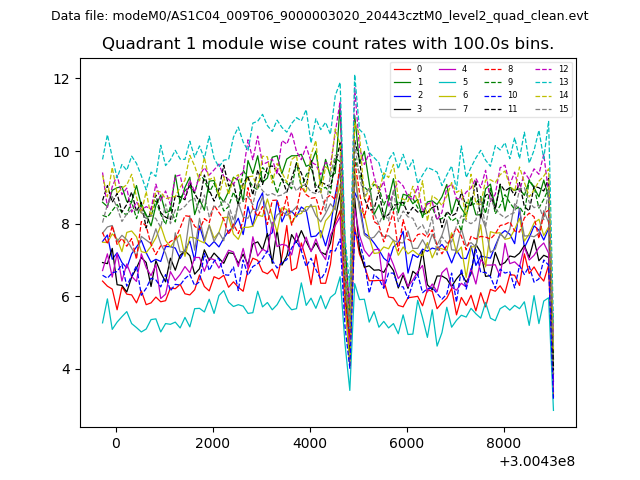
| Module-wise count rates for Quadrant C Data is divided into 100 sec bins |
 |
 |
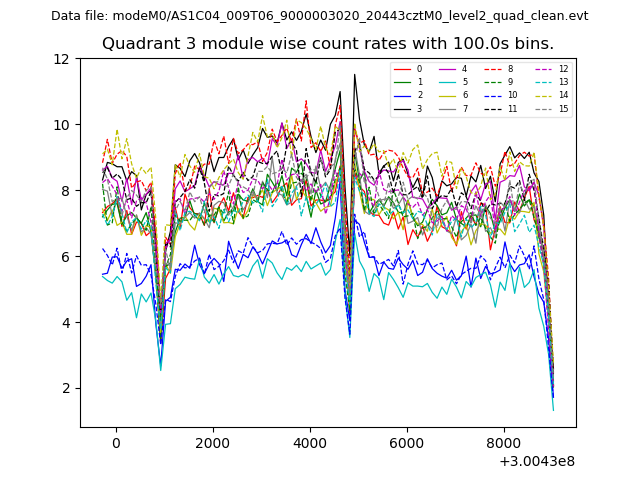
| Module-wise count rates for Quadrant D Data is divided into 100 sec bins |
 |
 |
| Parameter | Plot |
|---|---|
| CZT HV Monitor | 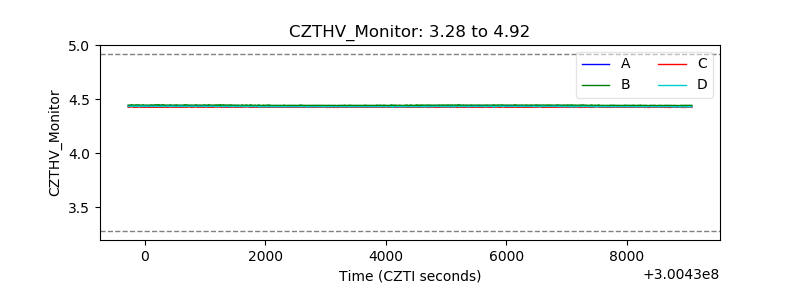 |
| D_VDD | 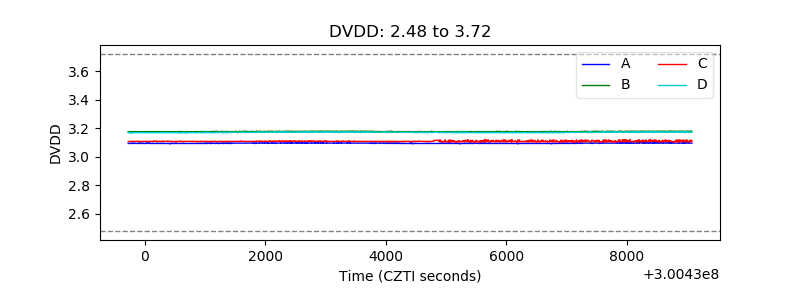 |
| Temperature 1 | 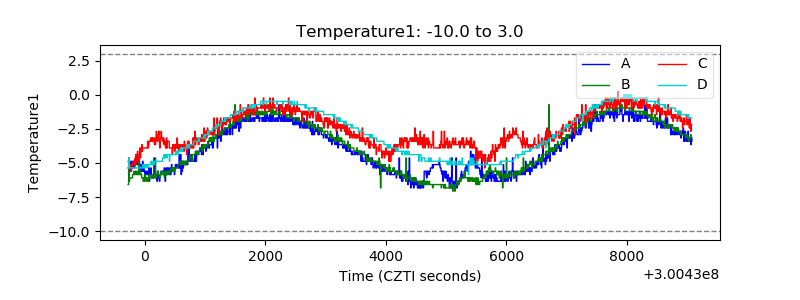 |
| Veto HV Monitor | 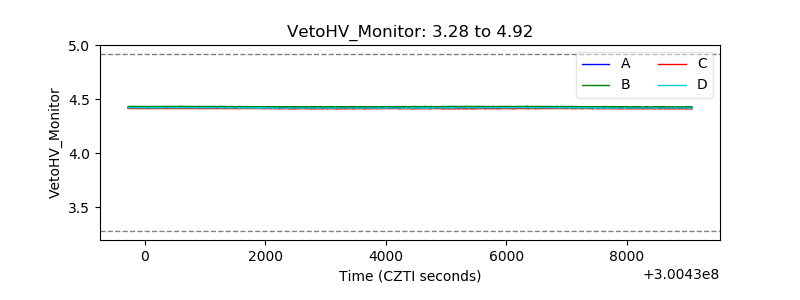 |
| Veto LLD | 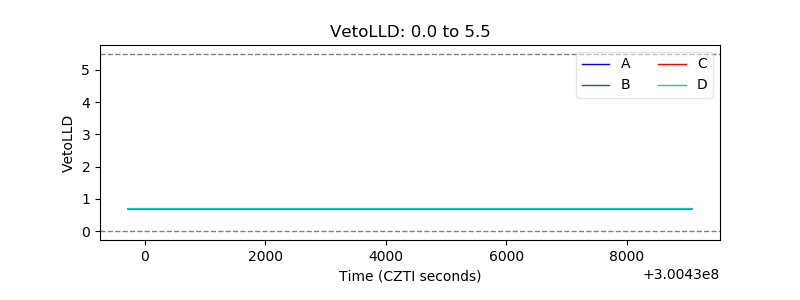 |
| Alpha Counter | 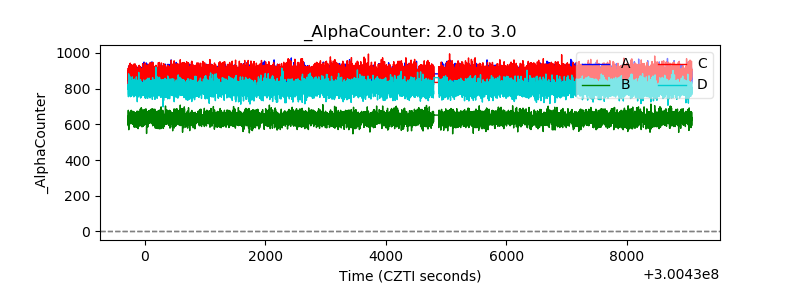 |
| _CPM_Rate | 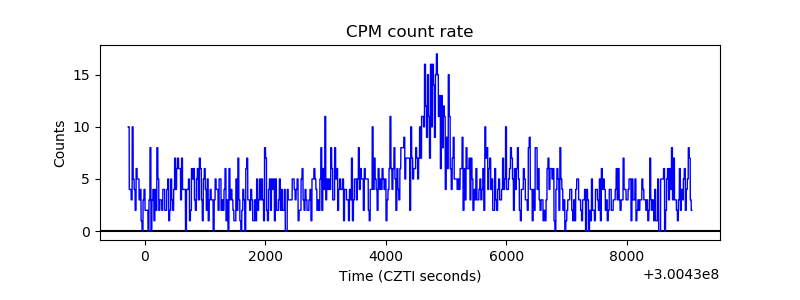 |
| CZT Counter | 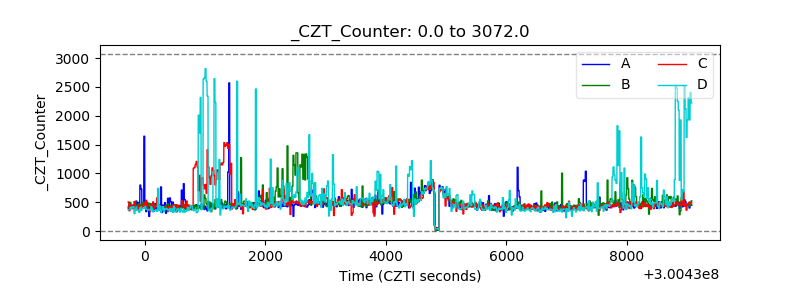 |
| +2.5 Volts monitor |  |
| +5 Volts monitor |  |
| _ROLL_ROT | 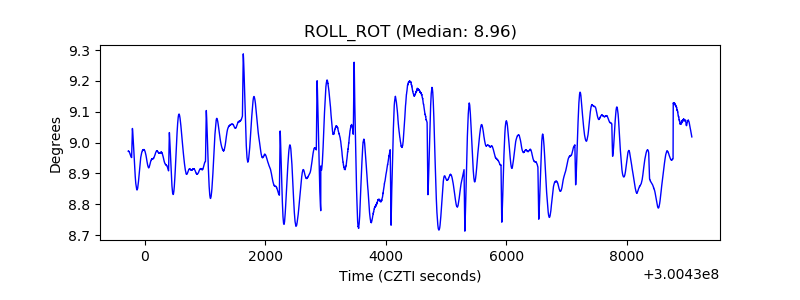 |
| _Roll_DEC | 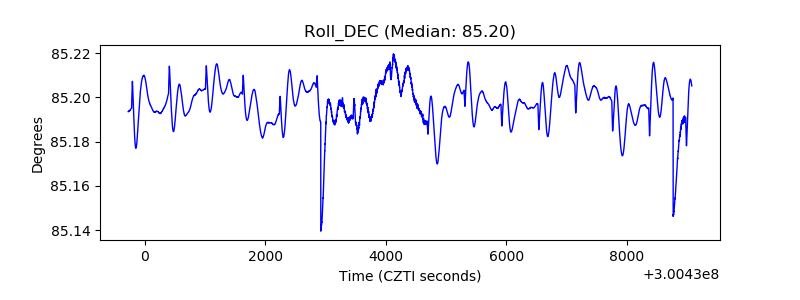 |
| _Roll_RA | 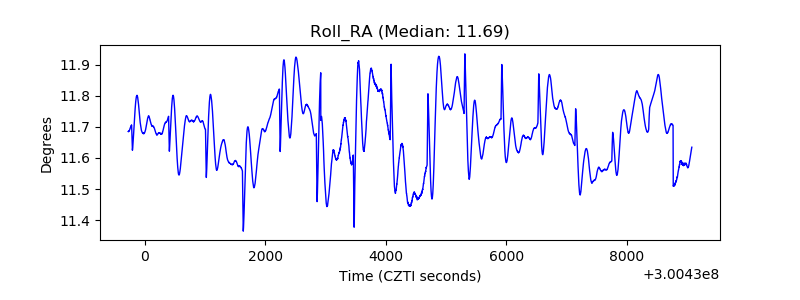 |
| Veto Counter | 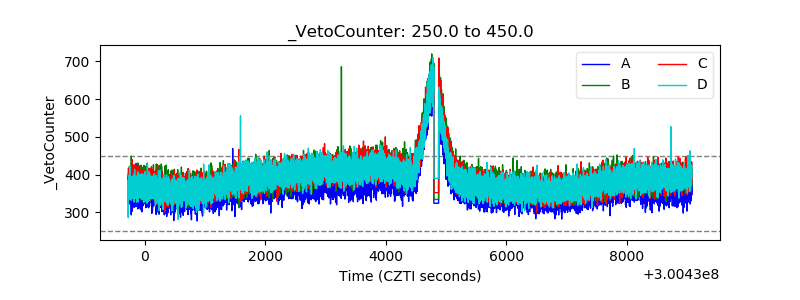 |