| Param | Original file | Final file |
|---|---|---|
| Filename | modeM0/AS1A05_198T01_9000003024cztM0_level2.fits | modeM0/AS1A05_198T01_9000003024cztM0_level2_quad_clean.evt |
| Size (bytes) | 667,131,840 | 580,181,760 |
| Size | 636.2 MB | 553.3 MB |
| Events in quadrant A | 4,129,994 | 3,438,435 |
| Events in quadrant B | 3,955,278 | 3,412,264 |
| Events in quadrant C | 4,044,788 | 3,205,975 |
| Events in quadrant D | 3,504,912 | 2,944,551 |
| Mode M9 | |||
|---|---|---|---|
| Quadrant | BADHDUFLAG | Total packets | Discarded packets |
| A | 0 | 110 | 0 |
| B | 0 | 110 | 0 |
| C | 0 | 110 | 0 |
| D | 0 | 110 | 0 |
| Mode SS | |||
|---|---|---|---|
| Quadrant | BADHDUFLAG | Total packets | Discarded packets |
| A | 0 | 1358 | 0 |
| B | 0 | 1358 | 0 |
| C | 0 | 1360 | 0 |
| D | 0 | 1358 | 0 |
| Mode M0 | |||
|---|---|---|---|
| Quadrant | BADHDUFLAG | Total packets | Discarded packets |
| A | 0 | 139241 | 0 |
| B | 0 | 148778 | 0 |
| C | 0 | 147123 | 0 |
| D | 0 | 164950 | 0 |
| Quadrant | Total seconds | Saturated seconds | Saturation percentage |
|---|---|---|---|
| A | 66613 | 760 | 1.140918% |
| B | 66615 | 1278 | 1.918487% |
| C | 66601 | 1257 | 1.887359% |
| D | 66606 | 2491 | 3.739903% |
Noise dominated data is calculated using 1-second bins in cleaned event files. If a bin has >2000 counts, and if more than 50% of those come from <1% of pixels, then it is considered to be noise-dominated and hence unusable.
| Quadrant | # 1 sec bins | Bins with >0 counts | Bins with >2000 counts | High rate bins dominated by noise | Noise dominated (total time) | Noise dominated (detector-on time) | Marked lightcurve |
|---|---|---|---|---|---|---|---|
| A | 80900 | 66662 | 0 | 0 | 0.00% | 0.00% |  |
| B | 80901 | 66659 | 0 | 0 | 0.00% | 0.00% |  |
| C | 80901 | 66651 | 0 | 0 | 0.00% | 0.00% |  |
| D | 80901 | 66573 | 0 | 0 | 0.00% | 0.00% |  |
Top three noisy pixels from each quadrant. If the there are fewer than three noisy pixels in the level2.evt file, extra rows are filled as -1
| Pixel properties | Quadrant properties | ||||||
|---|---|---|---|---|---|---|---|
| Quadrant | DetID | PixID | Counts | Sigma | Mean | Median | Sigma |
| A | 0 | 29 | 3899 | 10.91 | 1075 | 1008 | 265.0 |
| A | 7 | 110 | 3295 | 8.63 | 1075 | 1008 | 265.0 |
| A | 9 | 19 | 3079 | 7.81 | 1075 | 1008 | 265.0 |
| B | 2 | 9 | 3199 | 10.63 | 1045 | 996 | 207.2 |
| B | 2 | 8 | 2716 | 8.3 | 1045 | 996 | 207.2 |
| B | 5 | 128 | 2568 | 7.59 | 1045 | 996 | 207.2 |
| C | 1 | 81 | 3003 | 7.35 | 1067 | 998 | 272.8 |
| C | 1 | 80 | 2940 | 7.12 | 1067 | 998 | 272.8 |
| C | 12 | 241 | 2786 | 6.55 | 1067 | 998 | 272.8 |
| D | 4 | 246 | 2722 | 6.81 | 1000 | 911 | 266.0 |
| D | 3 | 14 | 2496 | 5.96 | 1000 | 911 | 266.0 |
| D | 6 | 231 | 2442 | 5.76 | 1000 | 911 | 266.0 |
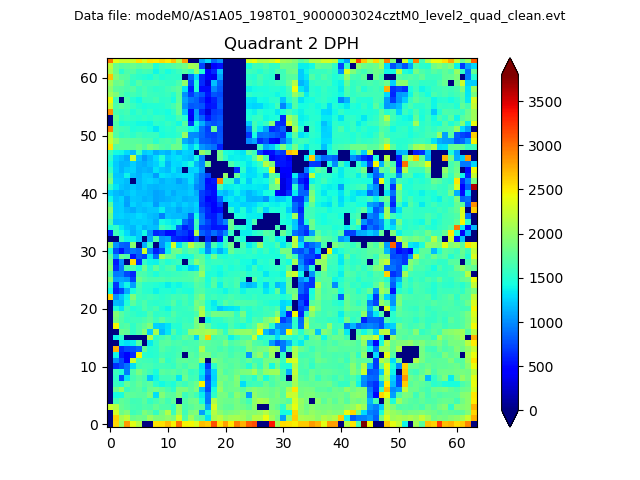
Histogram calculated using DETX and DETY for each event in the final _common_clean file
| Quadrant A | 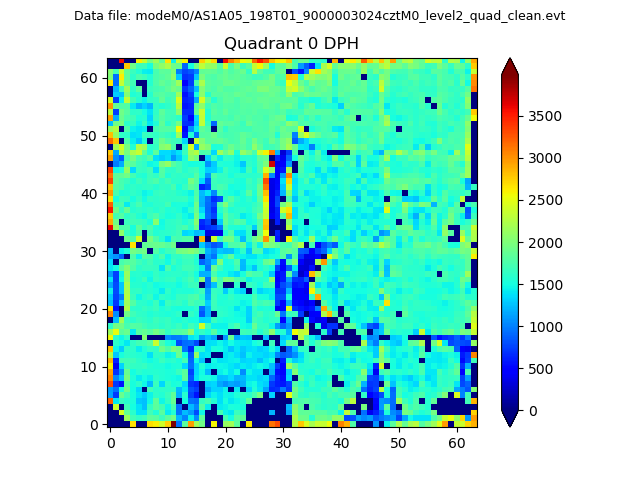 |
 |
Quadrant B |
|---|---|---|---|
| Quadrant D |  |
 |
Quadrant C |
| Plot type | Count rate plots | Images |
|---|---|---|
| Comparison with Poisson distribution Blue bars denote a histogram of data divided into 1 sec bins. Red curve is a Poisson curve with rate = median count rate of data. |
 |
 |
| Quadrant-wise count rates Data is divided into 100 sec bins |
 |
|
| Module-wise count rates for Quadrant A Data is divided into 100 sec bins |
 |
 |
| Module-wise count rates for Quadrant B Data is divided into 100 sec bins |
 |
 |
| Module-wise count rates for Quadrant C Data is divided into 100 sec bins |
 |
 |
| Module-wise count rates for Quadrant D Data is divided into 100 sec bins |
 |
 |
| Parameter | Plot |
|---|---|
| CZT HV Monitor |  |
| D_VDD |  |
| Temperature 1 |  |
| Veto HV Monitor |  |
| Veto LLD | 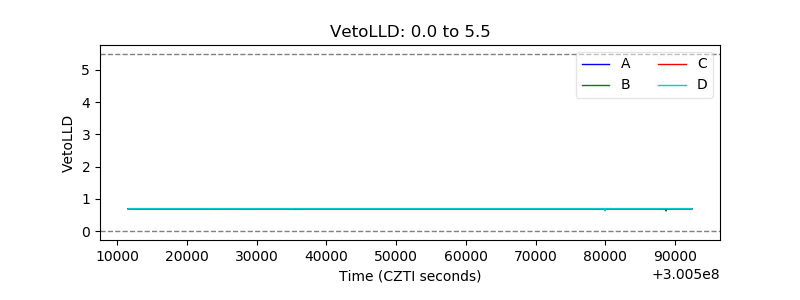 |
| Alpha Counter |  |
| _CPM_Rate |  |
| CZT Counter |  |
| +2.5 Volts monitor |  |
| +5 Volts monitor |  |
| _ROLL_ROT |  |
| _Roll_DEC |  |
| _Roll_RA |  |
| Veto Counter |  |