| Param | Original file | Final file |
|---|---|---|
| Filename | modeM0/AS1A05_198T01_9000003024_20458cztM0_level2.evt | modeM0/AS1A05_198T01_9000003024_20458cztM0_level2_quad_clean.evt |
| Size (bytes) | 1,108,774,080 | 183,265,920 |
| Size | 1.0 GB | 174.8 MB |
| Events in quadrant A | 7,362,573 | 1,147,646 |
| Events in quadrant B | 8,297,392 | 1,159,469 |
| Events in quadrant C | 7,963,542 | 1,101,020 |
| Events in quadrant D | 8,911,226 | 1,076,184 |
| Mode M9 | |||
|---|---|---|---|
| Quadrant | BADHDUFLAG | Total packets | Discarded packets |
| A | 0 | 5 | 0 |
| B | 0 | 5 | 0 |
| C | 0 | 5 | 0 |
| D | 0 | 5 | 0 |
| Mode SS | |||
|---|---|---|---|
| Quadrant | BADHDUFLAG | Total packets | Discarded packets |
| A | 0 | 316 | 2 |
| B | 0 | 315 | 1 |
| C | 0 | 316 | 0 |
| D | 0 | 316 | 2 |
| Mode M0 | |||
|---|---|---|---|
| Quadrant | BADHDUFLAG | Total packets | Discarded packets |
| A | 0 | 32047 | 214 |
| B | 0 | 34617 | 223 |
| C | 0 | 33691 | 278 |
| D | 0 | 37258 | 261 |
| Quadrant | Total seconds | Saturated seconds | Saturation percentage |
|---|---|---|---|
| A | 15442 | 254 | 1.644865% |
| B | 15444 | 449 | 2.907278% |
| C | 15430 | 312 | 2.022035% |
| D | 15434 | 548 | 3.550603% |
Noise dominated data is calculated using 1-second bins in cleaned event files. If a bin has >2000 counts, and if more than 50% of those come from <1% of pixels, then it is considered to be noise-dominated and hence unusable.
| Quadrant | # 1 sec bins | Bins with >0 counts | Bins with >2000 counts | High rate bins dominated by noise | Noise dominated (total time) | Noise dominated (detector-on time) | Marked lightcurve |
|---|---|---|---|---|---|---|---|
| A | 19244 | 15500 | 2 | 2 | 0.01% | 0.01% |  |
| B | 19245 | 15501 | 106 | 106 | 0.55% | 0.68% |  |
| C | 19245 | 15492 | 5 | 5 | 0.03% | 0.03% |  |
| D | 19244 | 15494 | 302 | 302 | 1.57% | 1.95% |  |
Top three noisy pixels from each quadrant. If the there are fewer than three noisy pixels in the level2.evt file, extra rows are filled as -1
| Pixel properties | Quadrant properties | ||||||
|---|---|---|---|---|---|---|---|
| Quadrant | DetID | PixID | Counts | Sigma | Mean | Median | Sigma |
| A | 15 | 222 | 119783 | 312.62 | 1876 | 1834 | 377.3 |
| A | 5 | 16 | 23692 | 57.93 | 1876 | 1834 | 377.3 |
| A | 0 | 226 | 16255 | 38.22 | 1876 | 1834 | 377.3 |
| B | 7 | 220 | 497367 | 1392.94 | 1850 | 1802 | 355.8 |
| B | 0 | 189 | 199566 | 555.88 | 1850 | 1802 | 355.8 |
| B | 10 | 245 | 140523 | 389.92 | 1850 | 1802 | 355.8 |
| C | 3 | 233 | 702111 | 1671.01 | 1785 | 1796 | 419.1 |
| C | 14 | 238 | 279424 | 662.44 | 1785 | 1796 | 419.1 |
| C | 9 | 221 | 26343 | 58.57 | 1785 | 1796 | 419.1 |
| D | 12 | 218 | 1035736 | 2316.01 | 1811 | 1757 | 446.4 |
| D | 15 | 0 | 522151 | 1165.63 | 1811 | 1757 | 446.4 |
| D | 1 | 52 | 261757 | 582.37 | 1811 | 1757 | 446.4 |
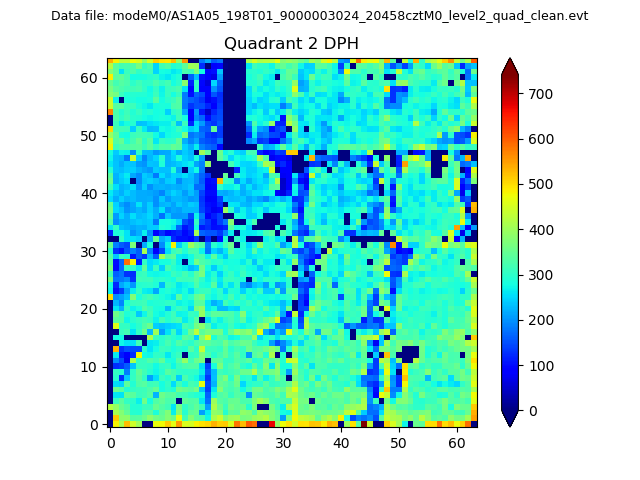
Histogram calculated using DETX and DETY for each event in the final _common_clean file
| Quadrant A | 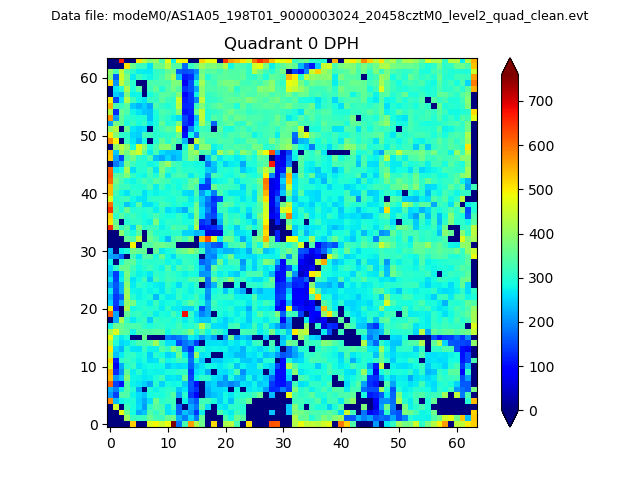 |
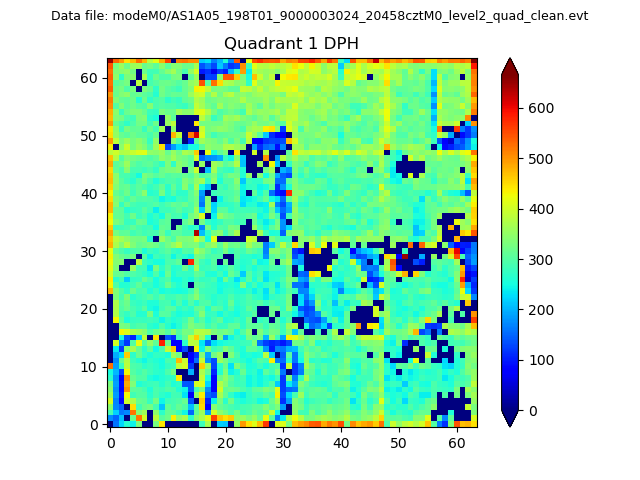 |
Quadrant B |
|---|---|---|---|
| Quadrant D | 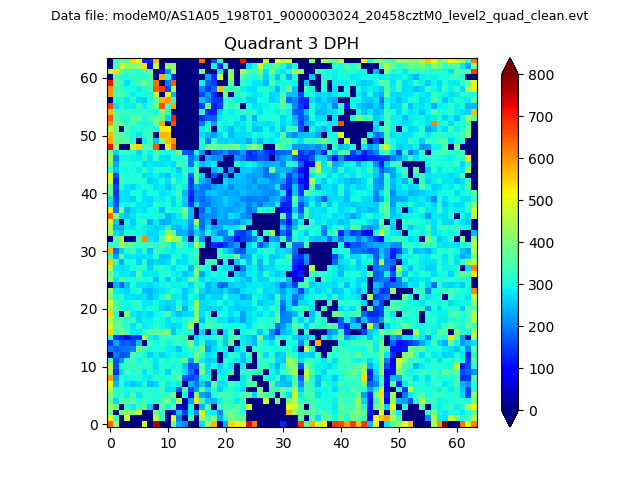 |
 |
Quadrant C |
| Plot type | Count rate plots | Images |
|---|---|---|
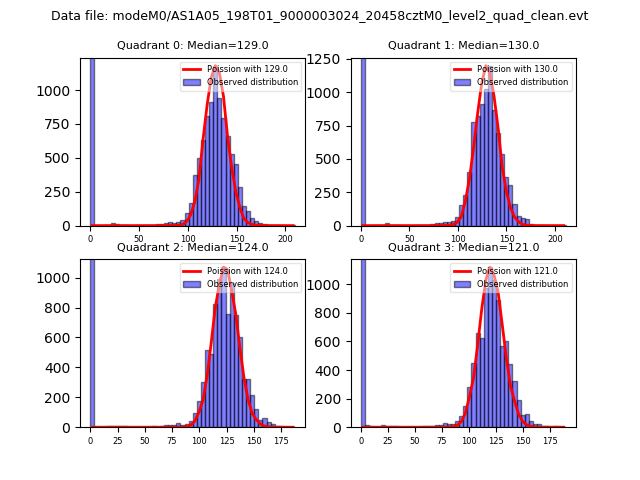
| Comparison with Poisson distribution Blue bars denote a histogram of data divided into 1 sec bins. Red curve is a Poisson curve with rate = median count rate of data. |
 |
 |
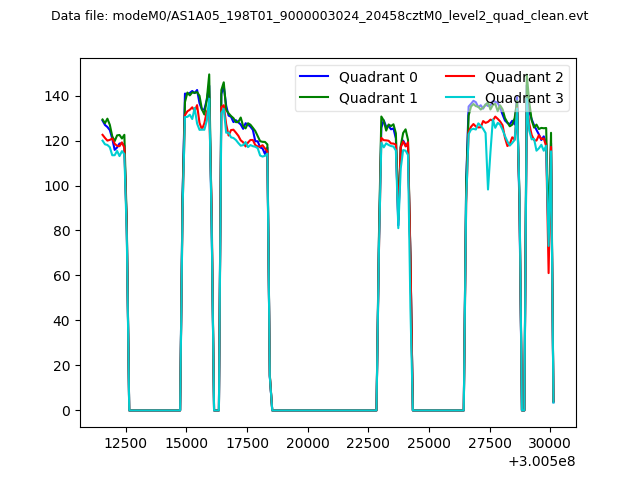
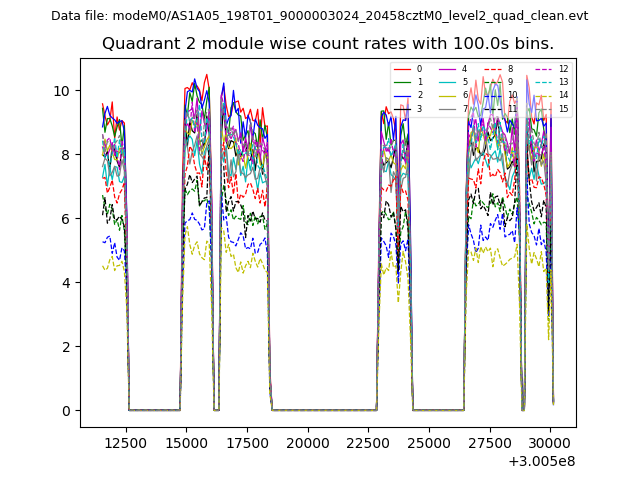
| Quadrant-wise count rates Data is divided into 100 sec bins |
 |
|
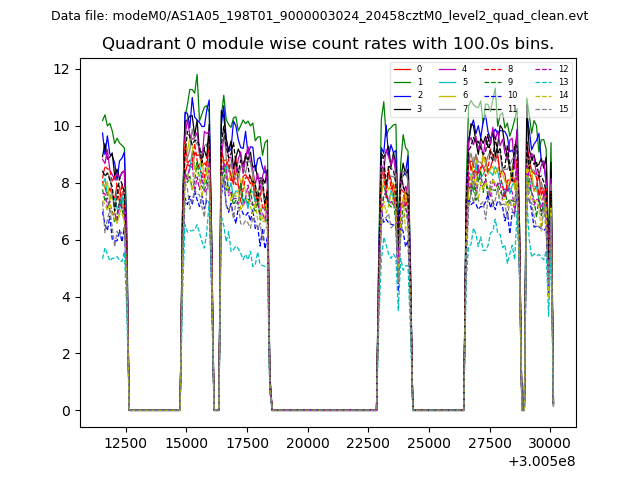
| Module-wise count rates for Quadrant A Data is divided into 100 sec bins |
 |
 |
| Module-wise count rates for Quadrant B Data is divided into 100 sec bins |
 |
 |
| Module-wise count rates for Quadrant C Data is divided into 100 sec bins |
 |
 |
| Module-wise count rates for Quadrant D Data is divided into 100 sec bins |
 |
 |
| Parameter | Plot |
|---|---|
| CZT HV Monitor | 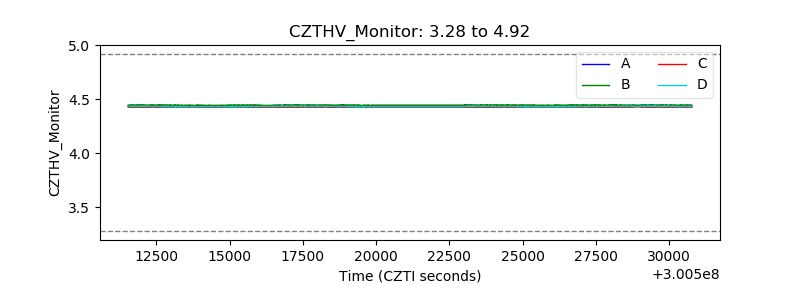 |
| D_VDD |  |
| Temperature 1 | 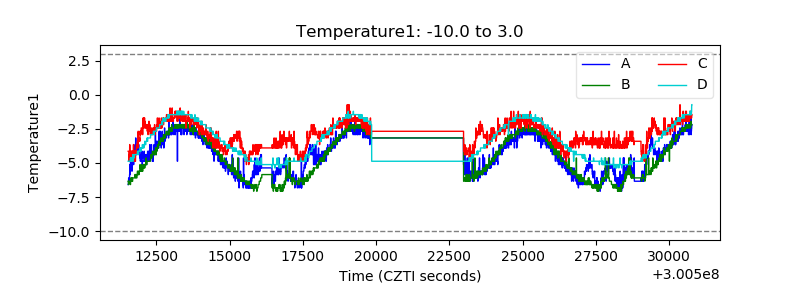 |
| Veto HV Monitor | 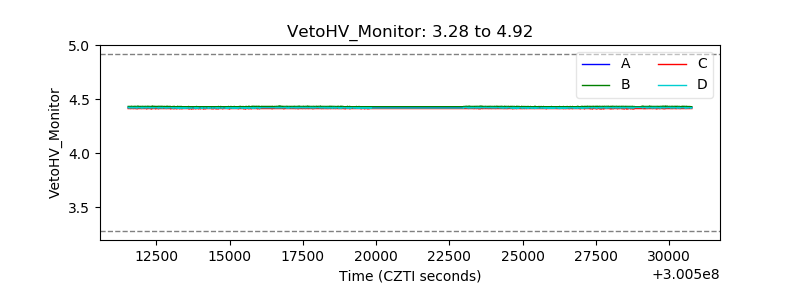 |
| Veto LLD | 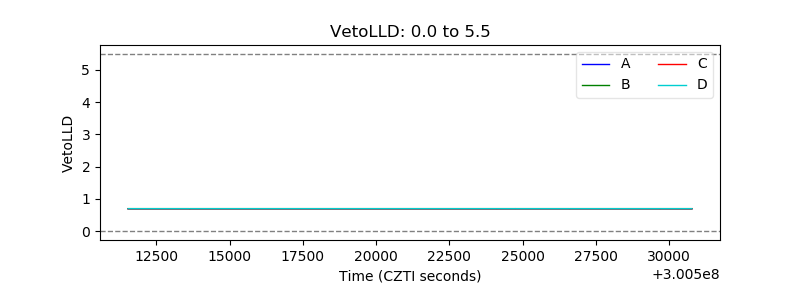 |
| Alpha Counter | 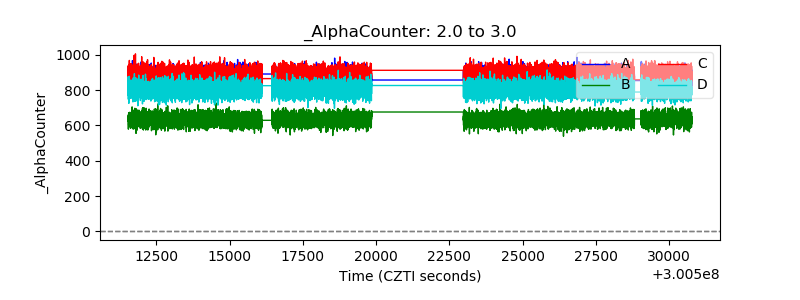 |
| _CPM_Rate | 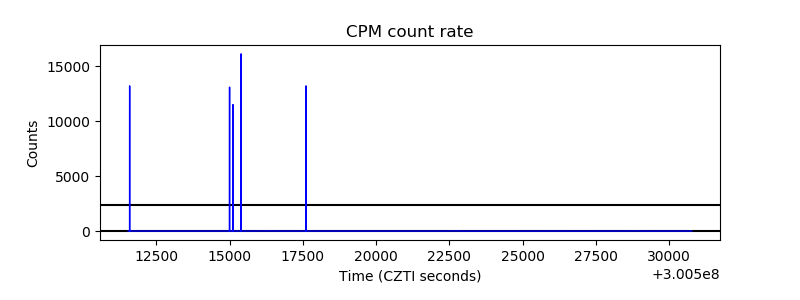 |
| CZT Counter | 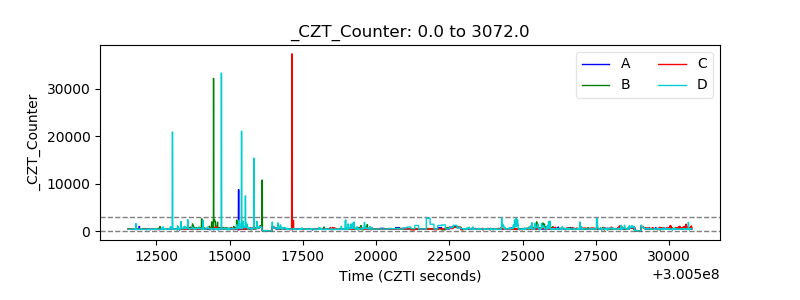 |
| +2.5 Volts monitor |  |
| +5 Volts monitor |  |
| _ROLL_ROT | 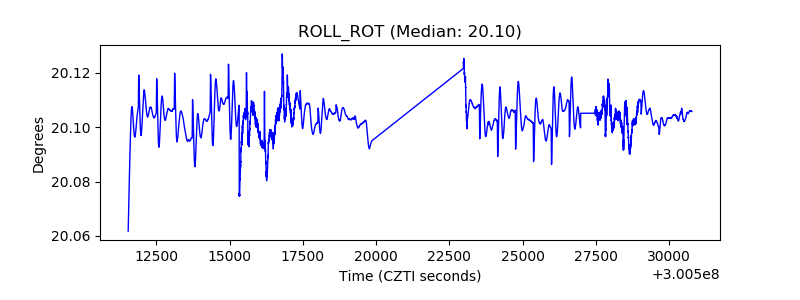 |
| _Roll_DEC | 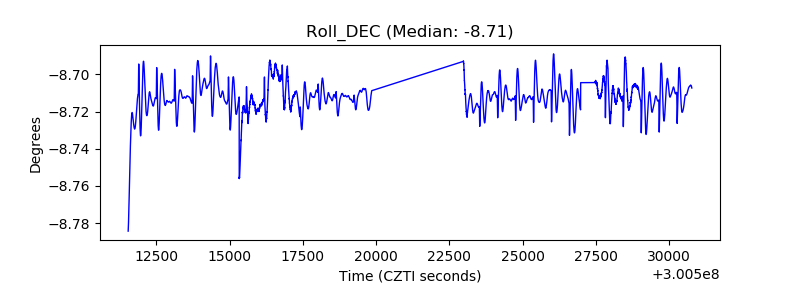 |
| _Roll_RA | 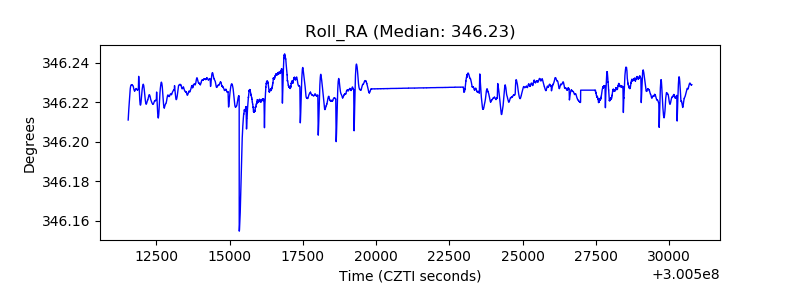 |
| Veto Counter | 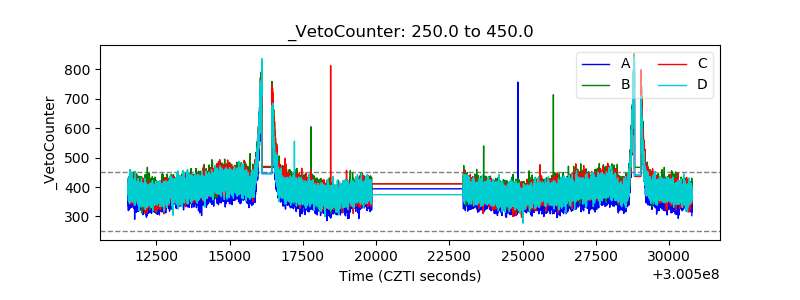 |