| Param | Original file | Final file |
|---|---|---|
| Filename | modeM0/AS1A05_198T01_9000003024_20460cztM0_level2.evt | modeM0/AS1A05_198T01_9000003024_20460cztM0_level2_quad_clean.evt |
| Size (bytes) | 848,237,760 | 143,112,960 |
| Size | 808.9 MB | 136.5 MB |
| Events in quadrant A | 5,449,788 | 910,672 |
| Events in quadrant B | 6,259,828 | 910,575 |
| Events in quadrant C | 6,467,402 | 863,865 |
| Events in quadrant D | 6,726,770 | 846,389 |
| Mode M9 | |||
|---|---|---|---|
| Quadrant | BADHDUFLAG | Total packets | Discarded packets |
| A | 0 | 10 | 0 |
| B | 0 | 10 | 0 |
| C | 0 | 10 | 0 |
| D | 0 | 10 | 0 |
| Mode SS | |||
|---|---|---|---|
| Quadrant | BADHDUFLAG | Total packets | Discarded packets |
| A | 0 | 238 | 0 |
| B | 0 | 238 | 0 |
| C | 0 | 238 | 0 |
| D | 0 | 238 | 0 |
| Mode M0 | |||
|---|---|---|---|
| Quadrant | BADHDUFLAG | Total packets | Discarded packets |
| A | 0 | 23740 | 2 |
| B | 0 | 25841 | 3 |
| C | 0 | 26489 | 2 |
| D | 0 | 27732 | 2 |
| Quadrant | Total seconds | Saturated seconds | Saturation percentage |
|---|---|---|---|
| A | 11593 | 181 | 1.561287% |
| B | 11593 | 242 | 2.087467% |
| C | 11593 | 253 | 2.182351% |
| D | 11593 | 426 | 3.674631% |
Noise dominated data is calculated using 1-second bins in cleaned event files. If a bin has >2000 counts, and if more than 50% of those come from <1% of pixels, then it is considered to be noise-dominated and hence unusable.
| Quadrant | # 1 sec bins | Bins with >0 counts | Bins with >2000 counts | High rate bins dominated by noise | Noise dominated (total time) | Noise dominated (detector-on time) | Marked lightcurve |
|---|---|---|---|---|---|---|---|
| A | 12678 | 11593 | 0 | 0 | 0.00% | 0.00% | 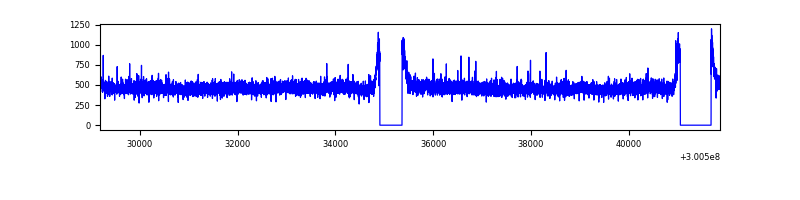 |
| B | 12678 | 11593 | 23 | 23 | 0.18% | 0.20% | 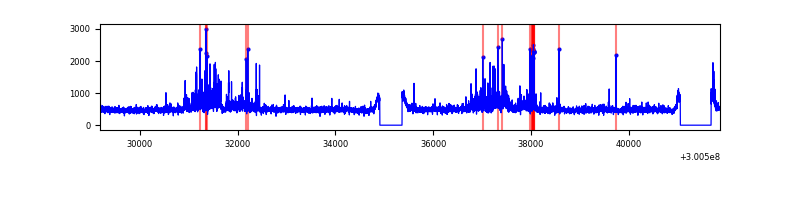 |
| C | 12678 | 11593 | 19 | 19 | 0.15% | 0.16% |  |
| D | 12678 | 11593 | 260 | 260 | 2.05% | 2.24% | 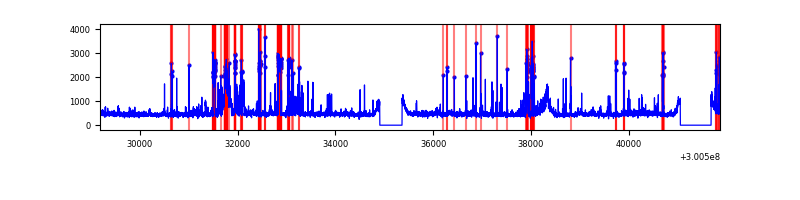 |
Top three noisy pixels from each quadrant. If the there are fewer than three noisy pixels in the level2.evt file, extra rows are filled as -1
| Pixel properties | Quadrant properties | ||||||
|---|---|---|---|---|---|---|---|
| Quadrant | DetID | PixID | Counts | Sigma | Mean | Median | Sigma |
| A | 15 | 222 | 21146 | 69.79 | 1409 | 1377 | 283.3 |
| A | 0 | 226 | 12264 | 38.43 | 1409 | 1377 | 283.3 |
| A | 3 | 137 | 11707 | 36.47 | 1409 | 1377 | 283.3 |
| B | 7 | 220 | 255631 | 943.19 | 1396 | 1359 | 269.6 |
| B | 0 | 189 | 204495 | 753.51 | 1396 | 1359 | 269.6 |
| B | 0 | 197 | 191048 | 703.63 | 1396 | 1359 | 269.6 |
| C | 3 | 233 | 797771 | 2520.9 | 1342 | 1349 | 315.9 |
| C | 14 | 238 | 211687 | 665.78 | 1342 | 1349 | 315.9 |
| C | 9 | 221 | 112948 | 353.24 | 1342 | 1349 | 315.9 |
| D | 15 | 0 | 801217 | 2385.06 | 1360 | 1321 | 335.4 |
| D | 1 | 52 | 296810 | 881.06 | 1360 | 1321 | 335.4 |
| D | 13 | 153 | 200001 | 592.41 | 1360 | 1321 | 335.4 |
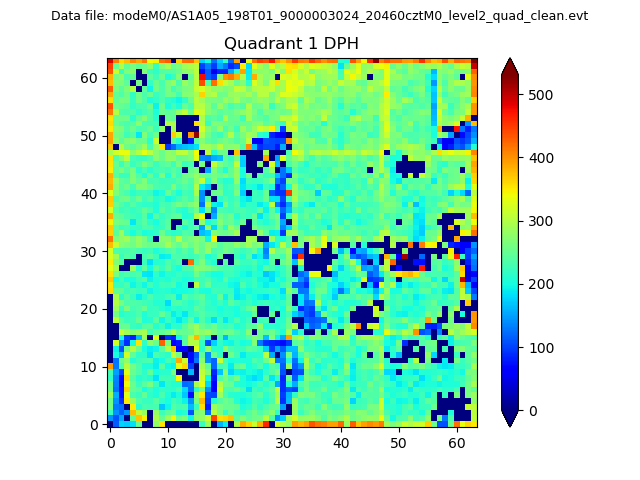
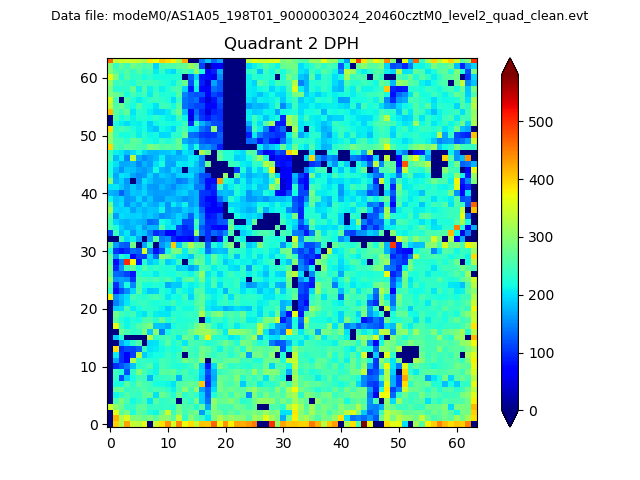
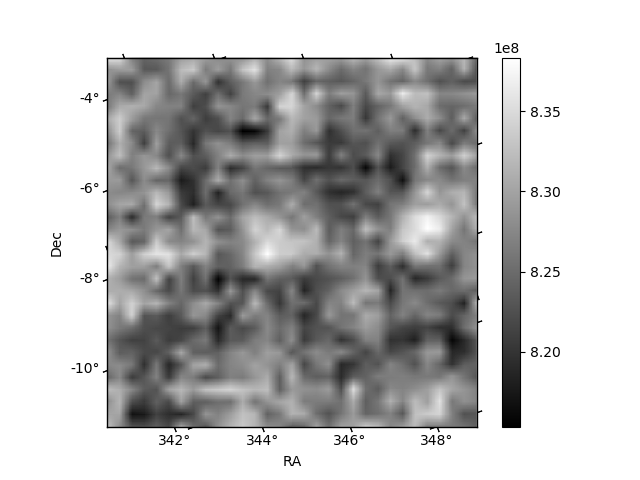
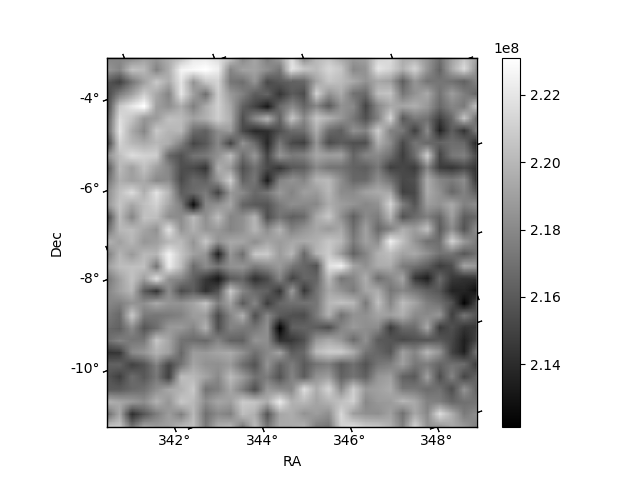
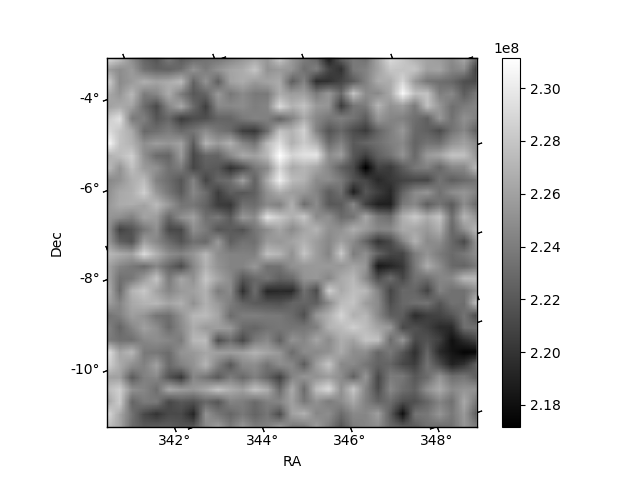
Histogram calculated using DETX and DETY for each event in the final _common_clean file
| Quadrant A | 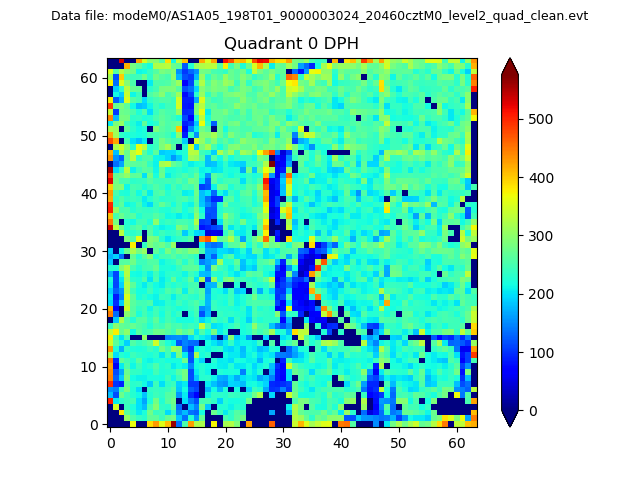 |
 |
Quadrant B |
|---|---|---|---|
| Quadrant D | 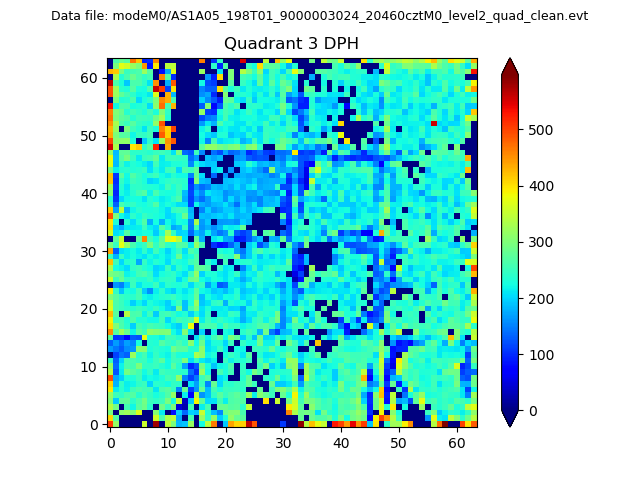 |
 |
Quadrant C |
| Plot type | Count rate plots | Images |
|---|---|---|
| Comparison with Poisson distribution Blue bars denote a histogram of data divided into 1 sec bins. Red curve is a Poisson curve with rate = median count rate of data. |
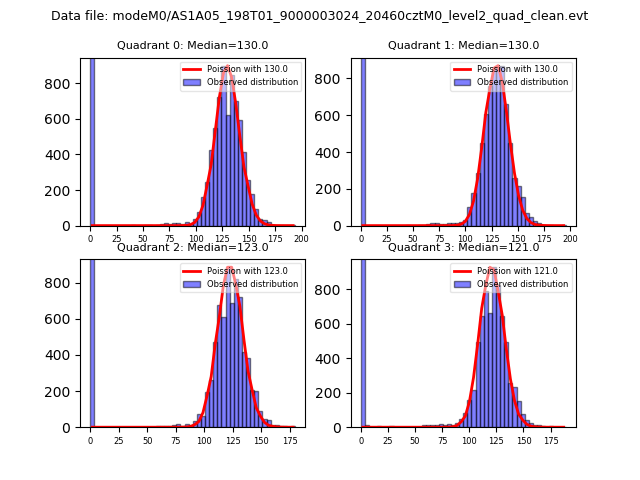 |
 |
| Quadrant-wise count rates Data is divided into 100 sec bins |
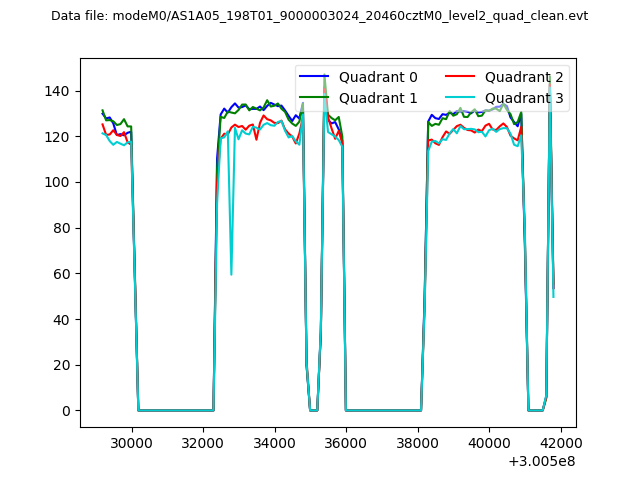 |
|
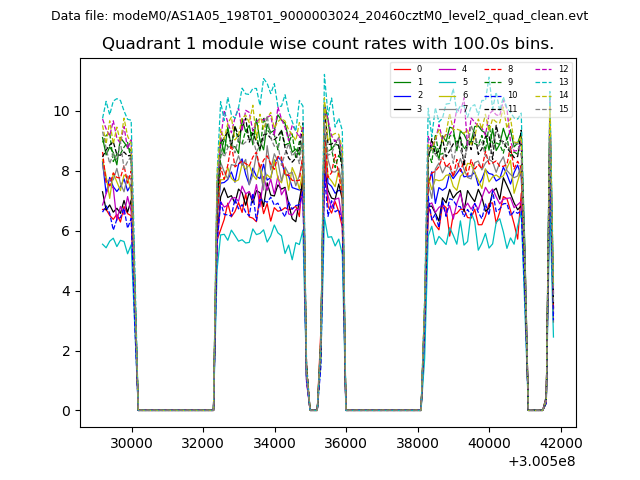
| Module-wise count rates for Quadrant A Data is divided into 100 sec bins |
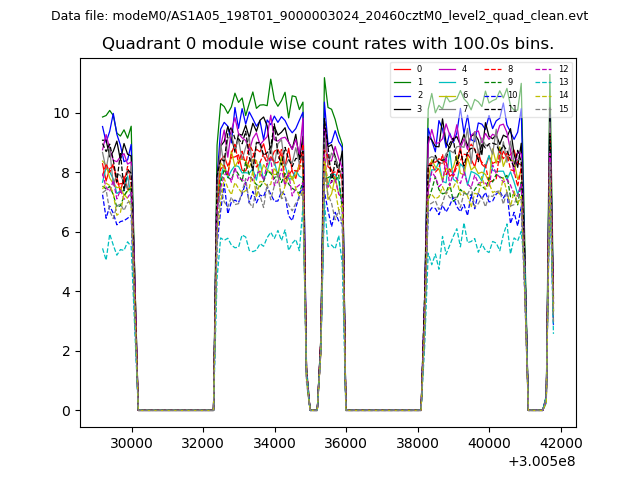 |
 |
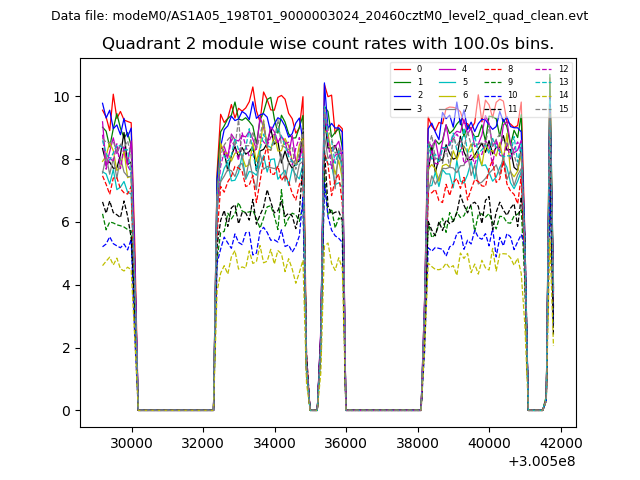
| Module-wise count rates for Quadrant B Data is divided into 100 sec bins |
 |
 |
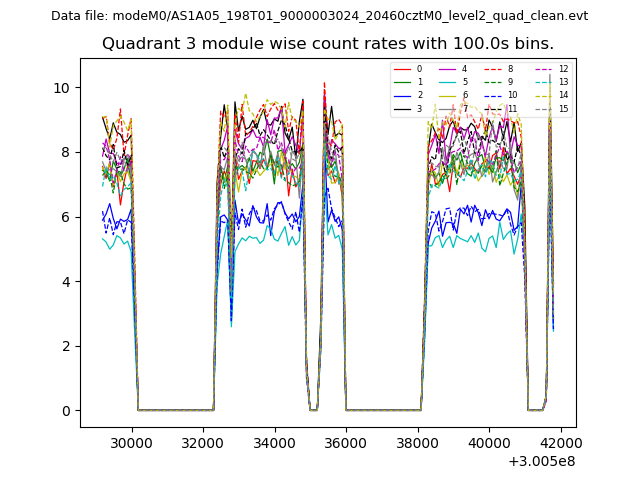
| Module-wise count rates for Quadrant C Data is divided into 100 sec bins |
 |
 |
| Module-wise count rates for Quadrant D Data is divided into 100 sec bins |
 |
 |
| Parameter | Plot |
|---|---|
| CZT HV Monitor | 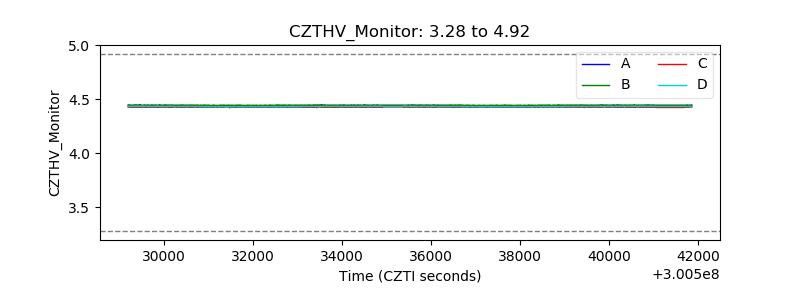 |
| D_VDD | 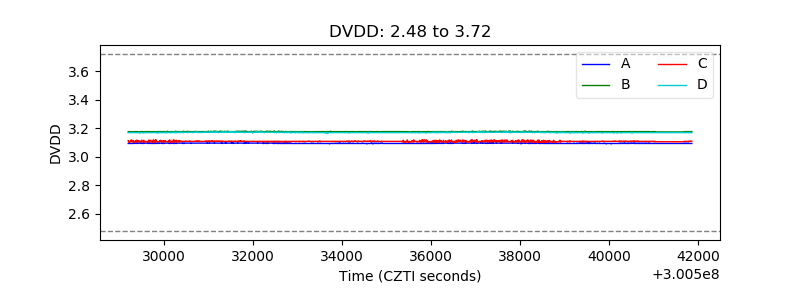 |
| Temperature 1 | 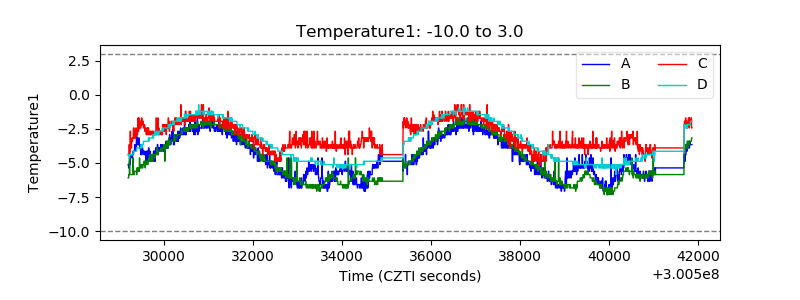 |
| Veto HV Monitor | 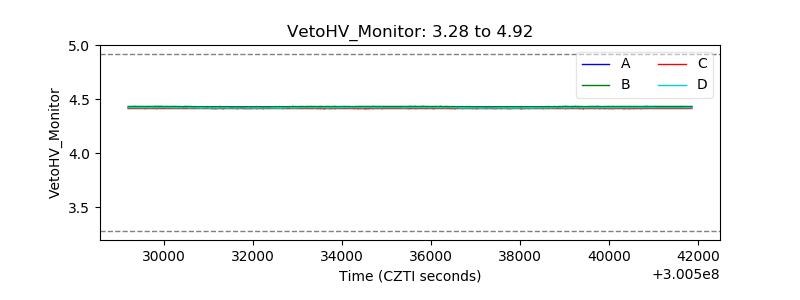 |
| Veto LLD | 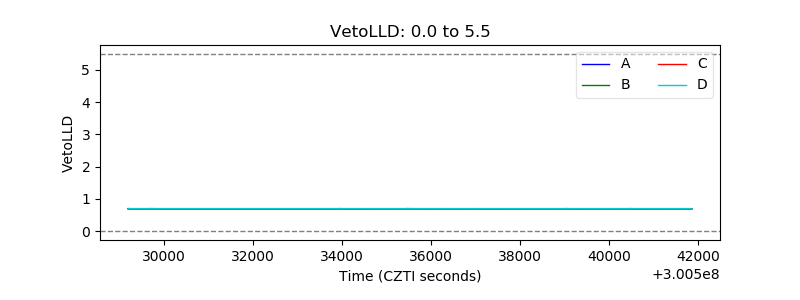 |
| Alpha Counter |  |
| _CPM_Rate | 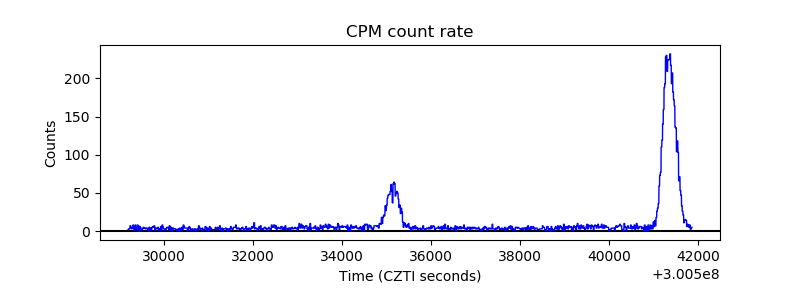 |
| CZT Counter | 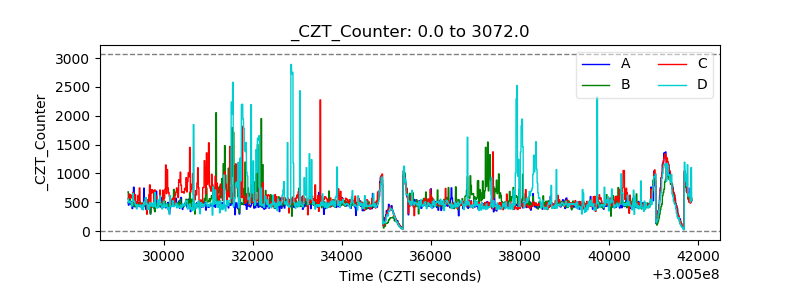 |
| +2.5 Volts monitor |  |
| +5 Volts monitor |  |
| _ROLL_ROT | 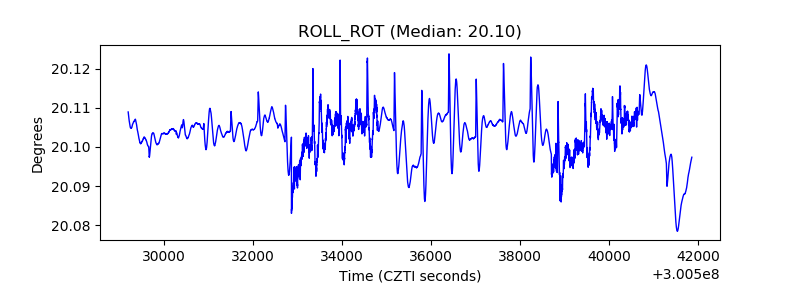 |
| _Roll_DEC | 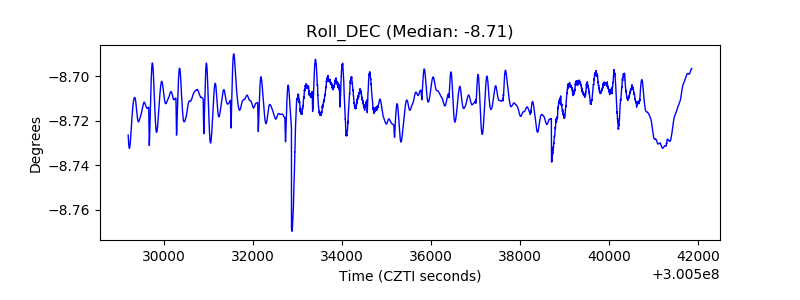 |
| _Roll_RA | 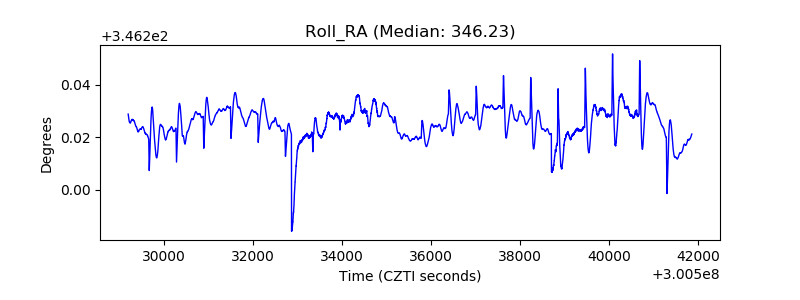 |
| Veto Counter | 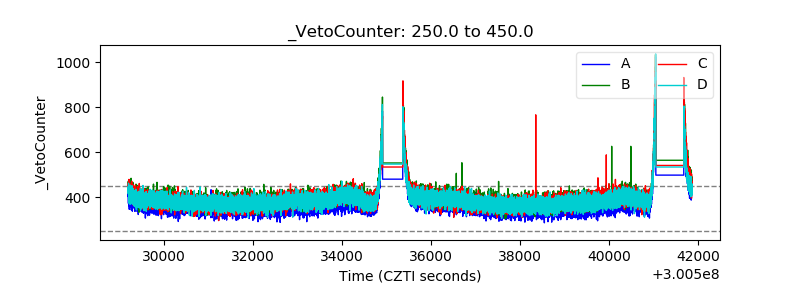 |