| Param | Original file | Final file |
|---|---|---|
| Filename | modeM0/AS1A05_198T01_9000003024_20462cztM0_level2.evt | modeM0/AS1A05_198T01_9000003024_20462cztM0_level2_quad_clean.evt |
| Size (bytes) | 500,748,480 | 70,894,080 |
| Size | 477.6 MB | 67.6 MB |
| Events in quadrant A | 3,290,522 | 435,892 |
| Events in quadrant B | 3,726,820 | 431,933 |
| Events in quadrant C | 3,413,631 | 411,631 |
| Events in quadrant D | 4,282,252 | 402,844 |
| Mode M9 | |||
|---|---|---|---|
| Quadrant | BADHDUFLAG | Total packets | Discarded packets |
| A | 0 | 13 | 0 |
| B | 0 | 14 | 0 |
| C | 0 | 14 | 0 |
| D | 0 | 14 | 0 |
| Mode SS | |||
|---|---|---|---|
| Quadrant | BADHDUFLAG | Total packets | Discarded packets |
| A | 0 | 136 | 0 |
| B | 0 | 136 | 0 |
| C | 0 | 136 | 0 |
| D | 0 | 136 | 0 |
| Mode M0 | |||
|---|---|---|---|
| Quadrant | BADHDUFLAG | Total packets | Discarded packets |
| A | 0 | 13962 | 2 |
| B | 0 | 15466 | 2 |
| C | 0 | 14371 | 2 |
| D | 0 | 17241 | 2 |
| Quadrant | Total seconds | Saturated seconds | Saturation percentage |
|---|---|---|---|
| A | 6656 | 56 | 0.841346% |
| B | 6656 | 116 | 1.742788% |
| C | 6656 | 105 | 1.577524% |
| D | 6656 | 280 | 4.206731% |
Noise dominated data is calculated using 1-second bins in cleaned event files. If a bin has >2000 counts, and if more than 50% of those come from <1% of pixels, then it is considered to be noise-dominated and hence unusable.
| Quadrant | # 1 sec bins | Bins with >0 counts | Bins with >2000 counts | High rate bins dominated by noise | Noise dominated (total time) | Noise dominated (detector-on time) | Marked lightcurve |
|---|---|---|---|---|---|---|---|
| A | 7681 | 6656 | 0 | 0 | 0.00% | 0.00% | 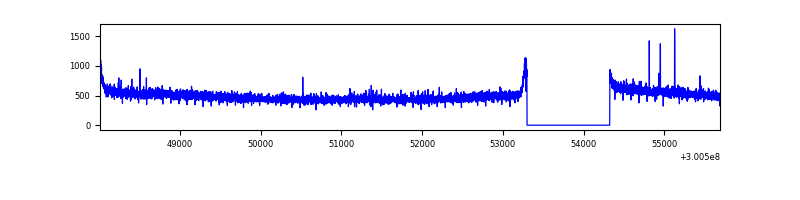 |
| B | 7681 | 6656 | 15 | 15 | 0.20% | 0.23% | 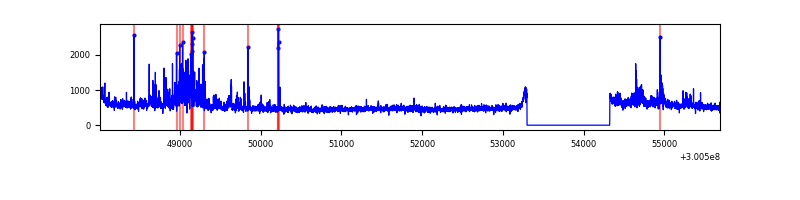 |
| C | 7681 | 6656 | 0 | 0 | 0.00% | 0.00% | 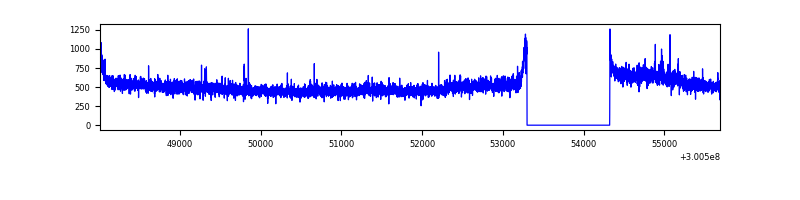 |
| D | 7681 | 6656 | 207 | 207 | 2.69% | 3.11% | 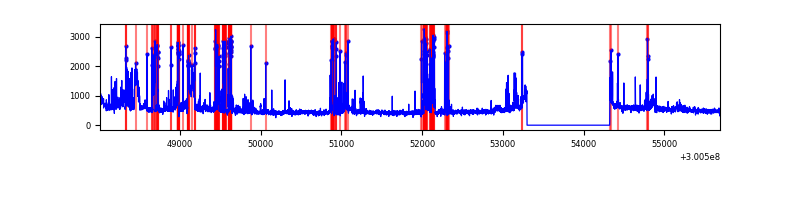 |
Top three noisy pixels from each quadrant. If the there are fewer than three noisy pixels in the level2.evt file, extra rows are filled as -1
| Pixel properties | Quadrant properties | ||||||
|---|---|---|---|---|---|---|---|
| Quadrant | DetID | PixID | Counts | Sigma | Mean | Median | Sigma |
| A | 15 | 222 | 16172 | 90.34 | 849 | 833 | 169.8 |
| A | 13 | 254 | 8868 | 47.32 | 849 | 833 | 169.8 |
| A | 0 | 226 | 7347 | 38.37 | 849 | 833 | 169.8 |
| B | 0 | 197 | 148302 | 922.54 | 839 | 819 | 159.9 |
| B | 7 | 220 | 133511 | 830.02 | 839 | 819 | 159.9 |
| B | 0 | 189 | 108014 | 670.53 | 839 | 819 | 159.9 |
| C | 14 | 238 | 126492 | 664.85 | 809 | 816 | 189.0 |
| C | 3 | 9 | 78434 | 410.61 | 809 | 816 | 189.0 |
| C | 3 | 233 | 51561 | 268.45 | 809 | 816 | 189.0 |
| D | 15 | 0 | 950346 | 4804.16 | 811 | 790 | 197.7 |
| D | 1 | 52 | 120871 | 607.54 | 811 | 790 | 197.7 |
| D | 13 | 153 | 43235 | 214.75 | 811 | 790 | 197.7 |
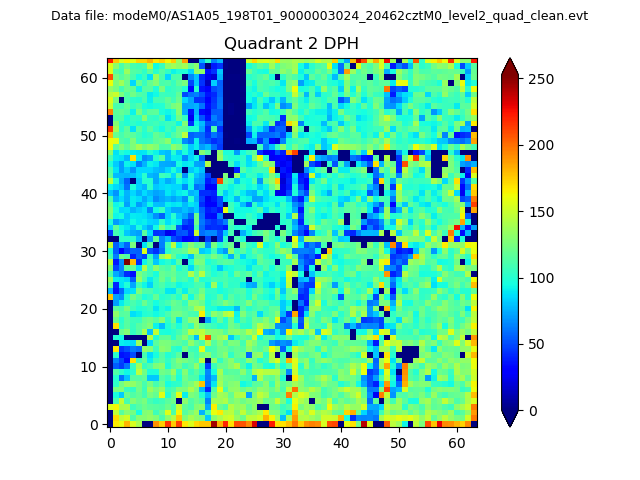
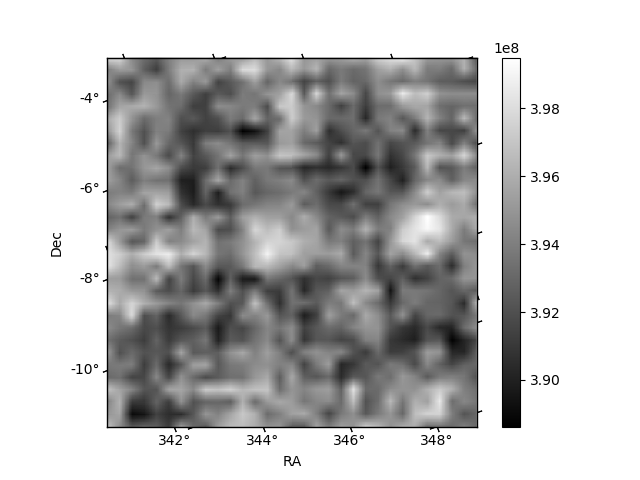
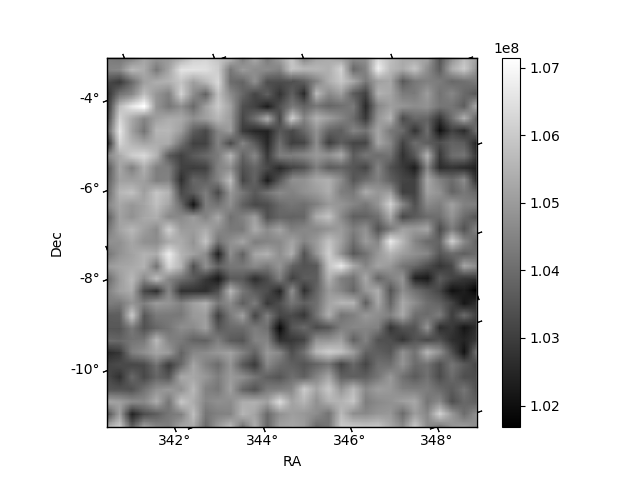
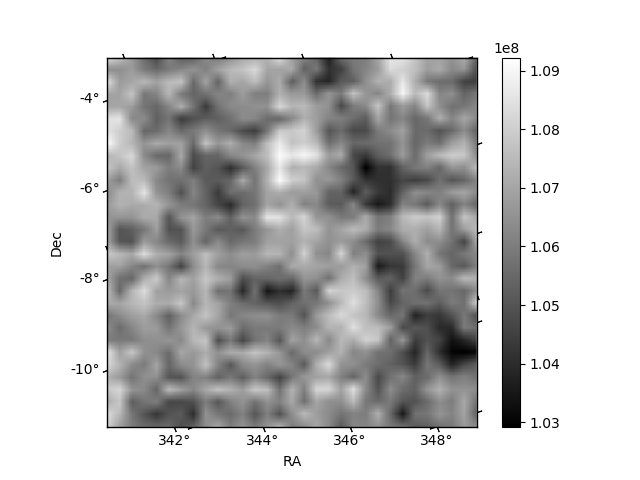
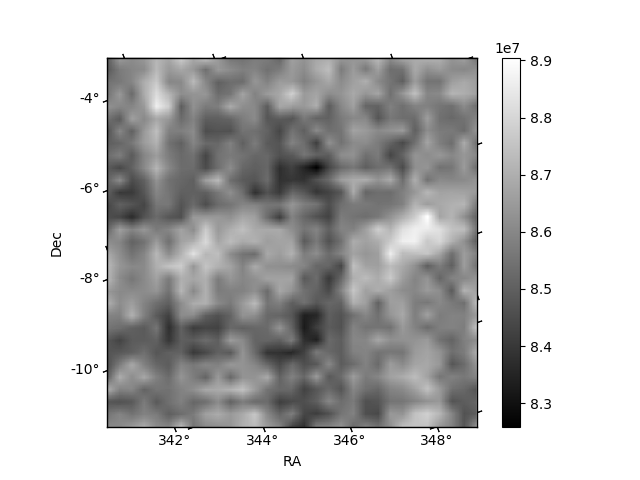
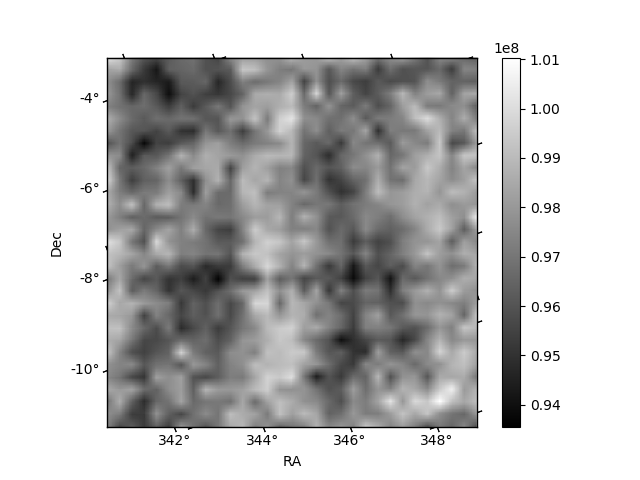
Histogram calculated using DETX and DETY for each event in the final _common_clean file
| Quadrant A | 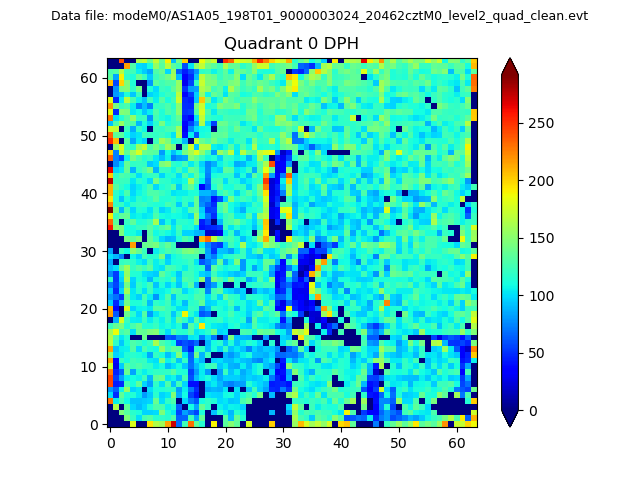 |
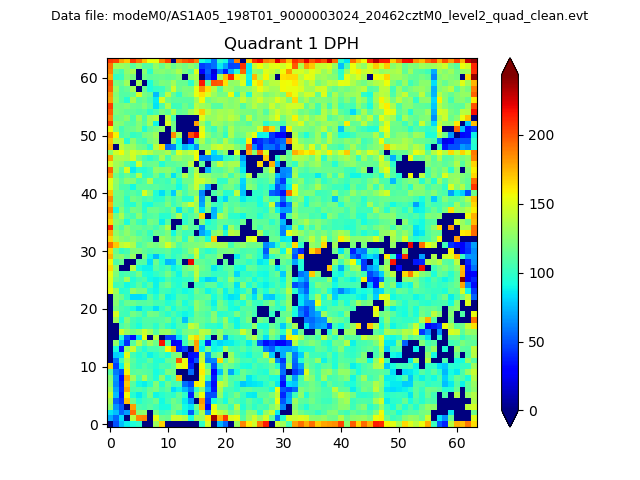 |
Quadrant B |
|---|---|---|---|
| Quadrant D | 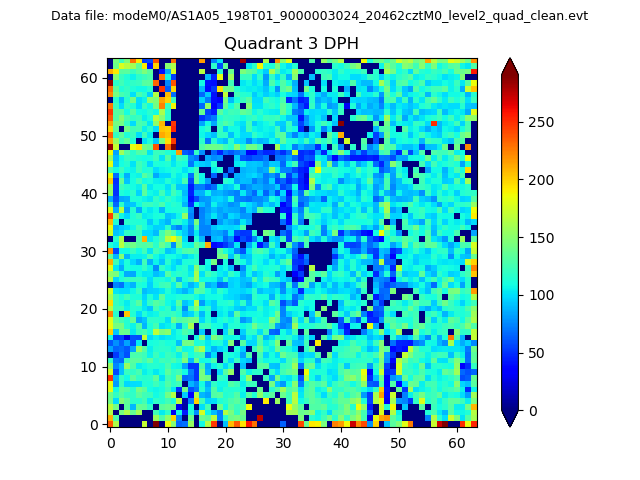 |
 |
Quadrant C |
| Plot type | Count rate plots | Images |
|---|---|---|
| Comparison with Poisson distribution Blue bars denote a histogram of data divided into 1 sec bins. Red curve is a Poisson curve with rate = median count rate of data. |
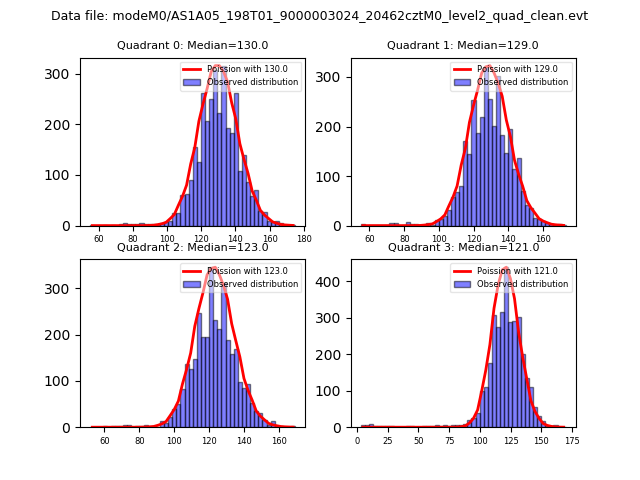 |
 |
| Quadrant-wise count rates Data is divided into 100 sec bins |
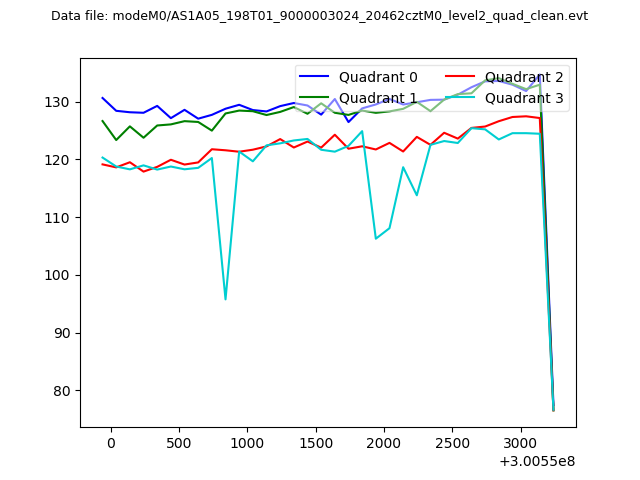 |
|
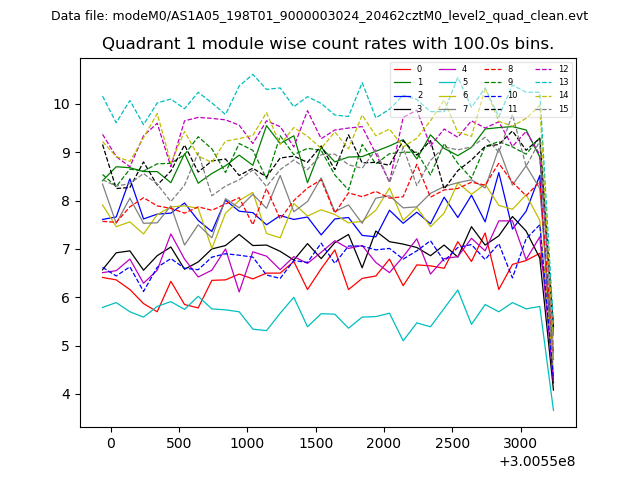
| Module-wise count rates for Quadrant A Data is divided into 100 sec bins |
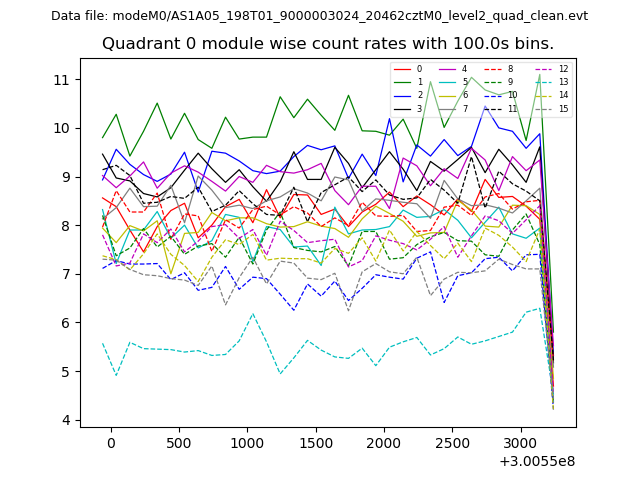 |
 |
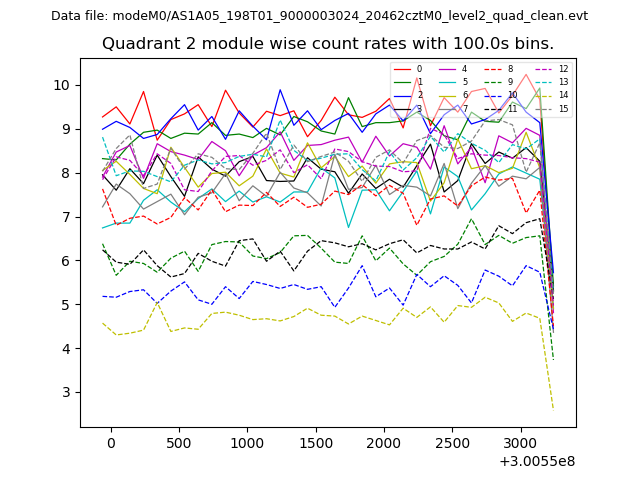
| Module-wise count rates for Quadrant B Data is divided into 100 sec bins |
 |
 |
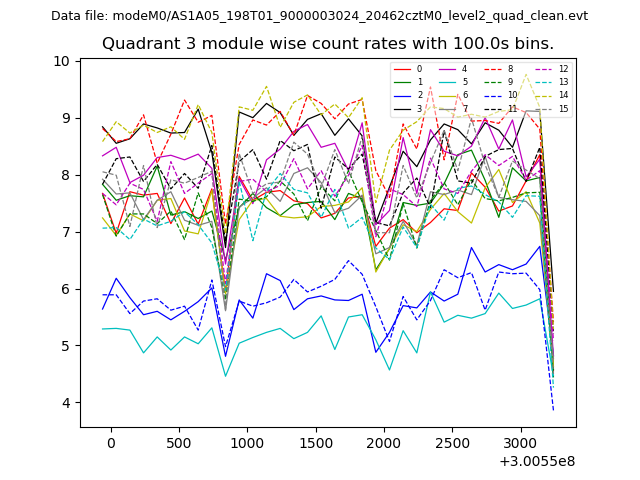
| Module-wise count rates for Quadrant C Data is divided into 100 sec bins |
 |
 |
| Module-wise count rates for Quadrant D Data is divided into 100 sec bins |
 |
 |
| Parameter | Plot |
|---|---|
| CZT HV Monitor | 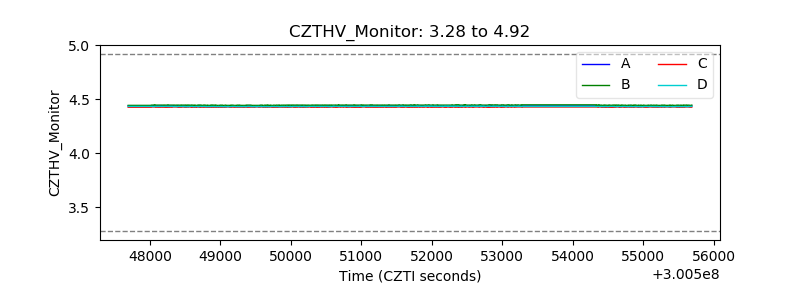 |
| D_VDD | 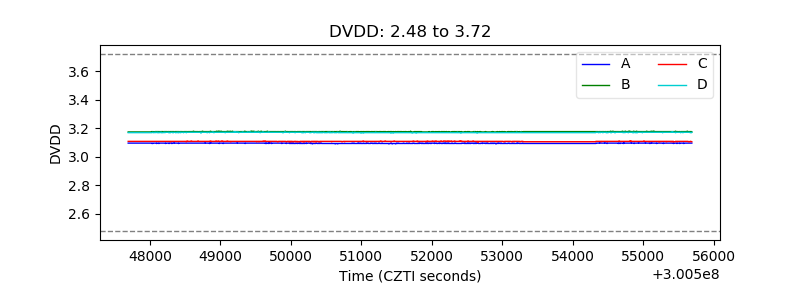 |
| Temperature 1 | 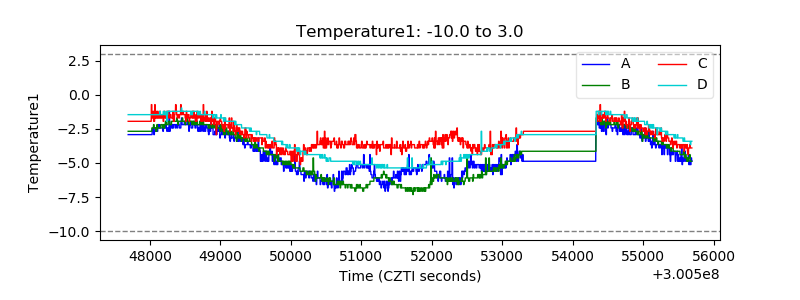 |
| Veto HV Monitor | 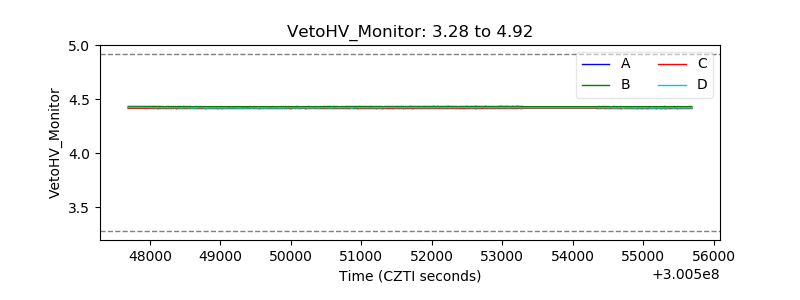 |
| Veto LLD | 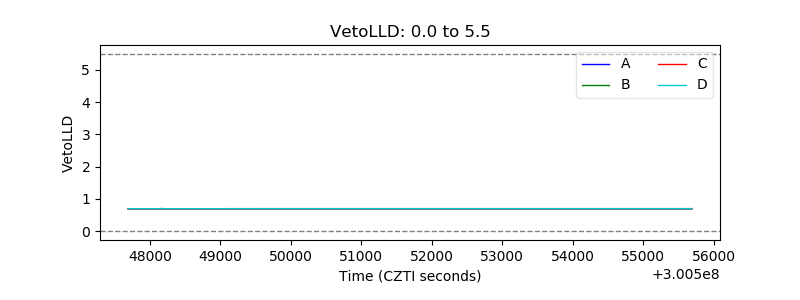 |
| Alpha Counter | 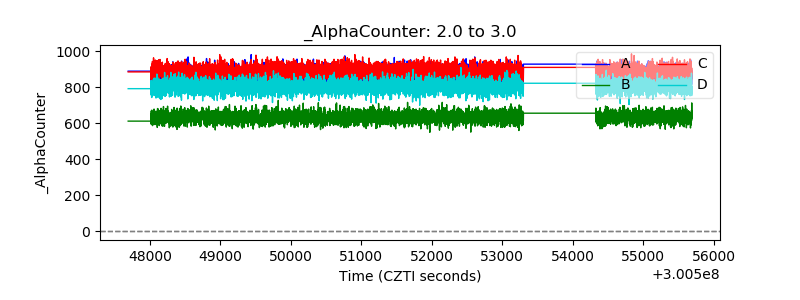 |
| _CPM_Rate | 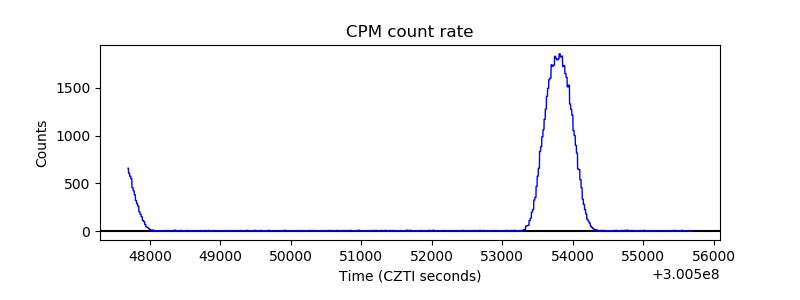 |
| CZT Counter | 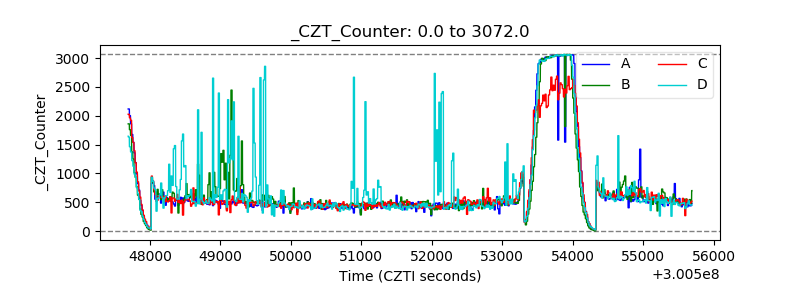 |
| +2.5 Volts monitor |  |
| +5 Volts monitor |  |
| _ROLL_ROT | 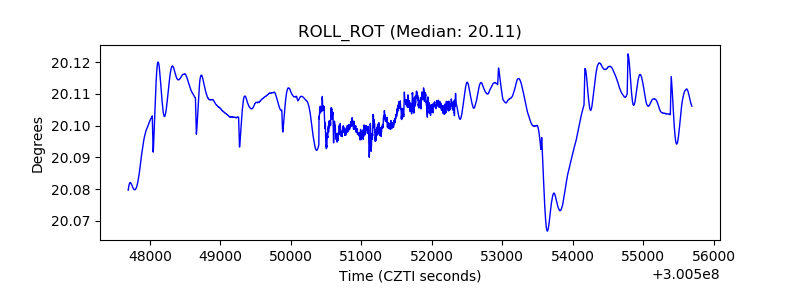 |
| _Roll_DEC | 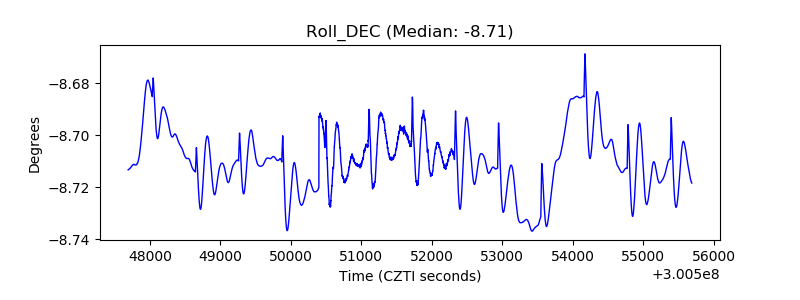 |
| _Roll_RA | 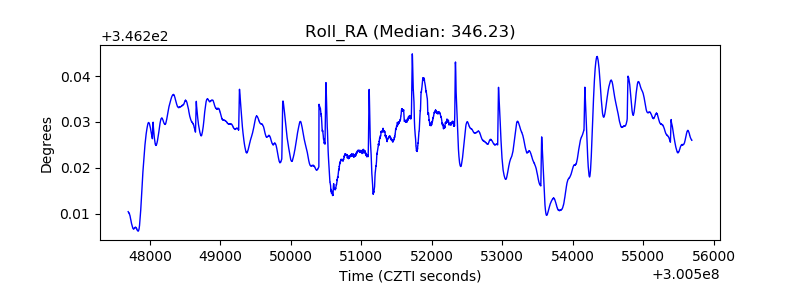 |
| Veto Counter | 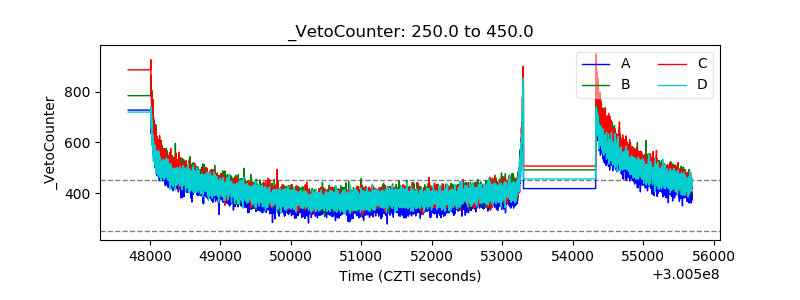 |