| Param | Original file | Final file |
|---|---|---|
| Filename | modeM0/AS1A05_198T01_9000003024_20465cztM0_level2.evt | modeM0/AS1A05_198T01_9000003024_20465cztM0_level2_quad_clean.evt |
| Size (bytes) | 477,167,040 | 91,627,200 |
| Size | 455.1 MB | 87.4 MB |
| Events in quadrant A | 3,237,214 | 598,319 |
| Events in quadrant B | 3,583,654 | 604,554 |
| Events in quadrant C | 3,371,112 | 577,150 |
| Events in quadrant D | 3,840,422 | 564,114 |
| Mode M9 | |||
|---|---|---|---|
| Quadrant | BADHDUFLAG | Total packets | Discarded packets |
| A | 0 | 21 | 0 |
| B | 0 | 22 | 0 |
| C | 0 | 22 | 0 |
| D | 0 | 22 | 0 |
| Mode SS | |||
|---|---|---|---|
| Quadrant | BADHDUFLAG | Total packets | Discarded packets |
| A | 0 | 126 | 0 |
| B | 0 | 126 | 0 |
| C | 0 | 126 | 0 |
| D | 0 | 126 | 0 |
| Mode M0 | |||
|---|---|---|---|
| Quadrant | BADHDUFLAG | Total packets | Discarded packets |
| A | 0 | 13623 | 2 |
| B | 0 | 14641 | 4 |
| C | 0 | 13951 | 2 |
| D | 0 | 15591 | 2 |
| Quadrant | Total seconds | Saturated seconds | Saturation percentage |
|---|---|---|---|
| A | 6168 | 46 | 0.745785% |
| B | 6167 | 93 | 1.508027% |
| C | 6167 | 112 | 1.816118% |
| D | 6167 | 120 | 1.945841% |
Noise dominated data is calculated using 1-second bins in cleaned event files. If a bin has >2000 counts, and if more than 50% of those come from <1% of pixels, then it is considered to be noise-dominated and hence unusable.
| Quadrant | # 1 sec bins | Bins with >0 counts | Bins with >2000 counts | High rate bins dominated by noise | Noise dominated (total time) | Noise dominated (detector-on time) | Marked lightcurve |
|---|---|---|---|---|---|---|---|
| A | 7438 | 6168 | 0 | 0 | 0.00% | 0.00% | 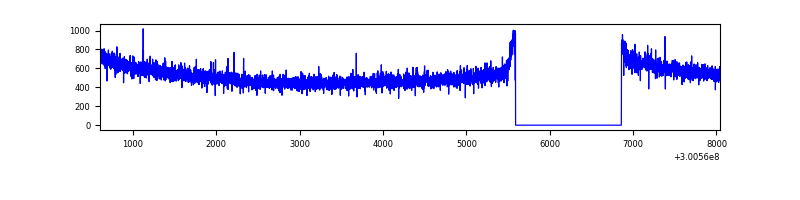 |
| B | 7437 | 6167 | 13 | 13 | 0.17% | 0.21% | 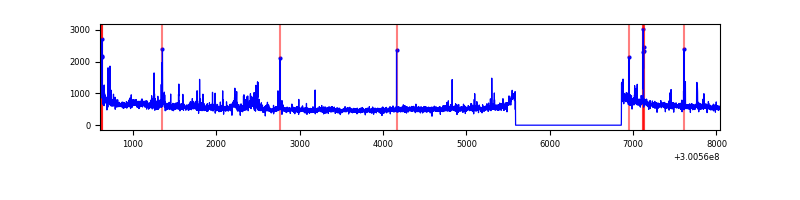 |
| C | 7437 | 6167 | 5 | 5 | 0.07% | 0.08% | 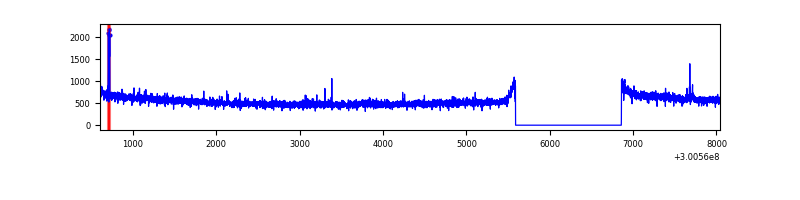 |
| D | 7437 | 6167 | 36 | 36 | 0.48% | 0.58% | 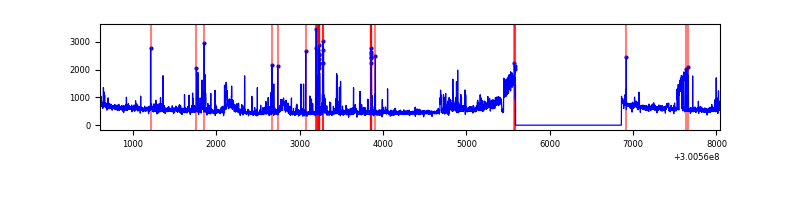 |
Top three noisy pixels from each quadrant. If the there are fewer than three noisy pixels in the level2.evt file, extra rows are filled as -1
| Pixel properties | Quadrant properties | ||||||
|---|---|---|---|---|---|---|---|
| Quadrant | DetID | PixID | Counts | Sigma | Mean | Median | Sigma |
| A | 13 | 254 | 8410 | 45.53 | 839 | 824 | 166.6 |
| A | 0 | 226 | 7254 | 38.59 | 839 | 824 | 166.6 |
| A | 3 | 137 | 6414 | 33.55 | 839 | 824 | 166.6 |
| B | 0 | 198 | 111476 | 699.91 | 837 | 819 | 158.1 |
| B | 0 | 189 | 72628 | 454.2 | 837 | 819 | 158.1 |
| B | 4 | 216 | 31964 | 196.99 | 837 | 819 | 158.1 |
| C | 14 | 238 | 131890 | 701.55 | 811 | 820 | 186.8 |
| C | 9 | 221 | 29338 | 152.64 | 811 | 820 | 186.8 |
| C | 3 | 233 | 26380 | 136.81 | 811 | 820 | 186.8 |
| D | 15 | 0 | 449863 | 2277.89 | 816 | 795 | 197.1 |
| D | 1 | 52 | 106396 | 535.66 | 816 | 795 | 197.1 |
| D | 9 | 1 | 74478 | 373.76 | 816 | 795 | 197.1 |
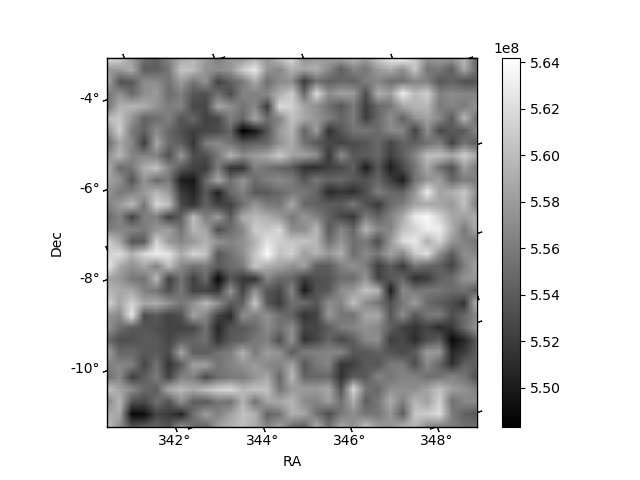
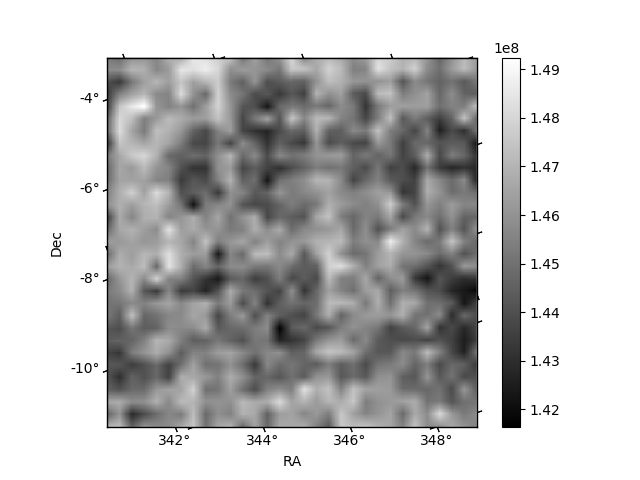
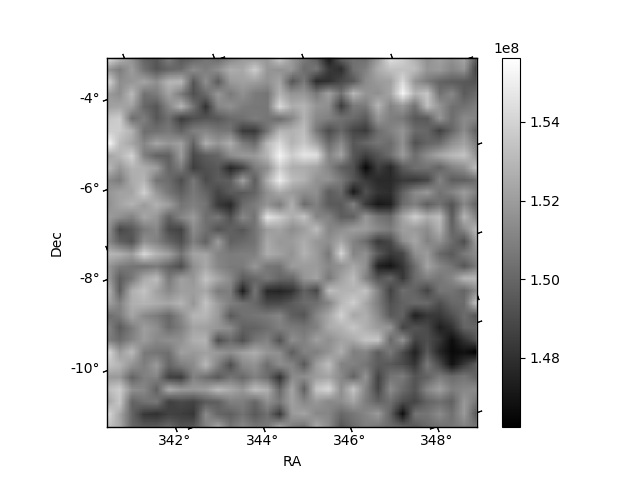
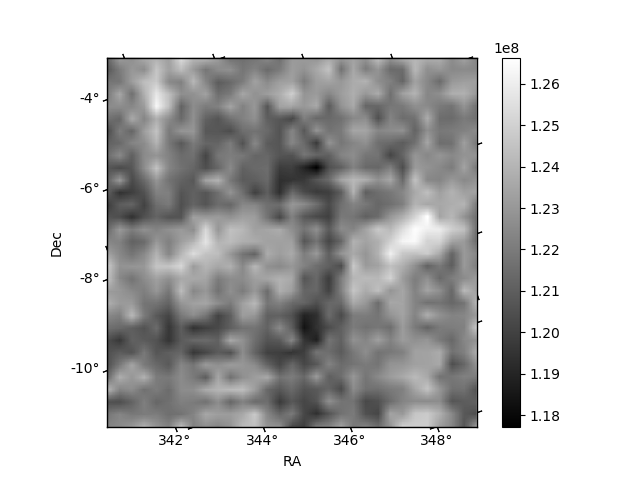
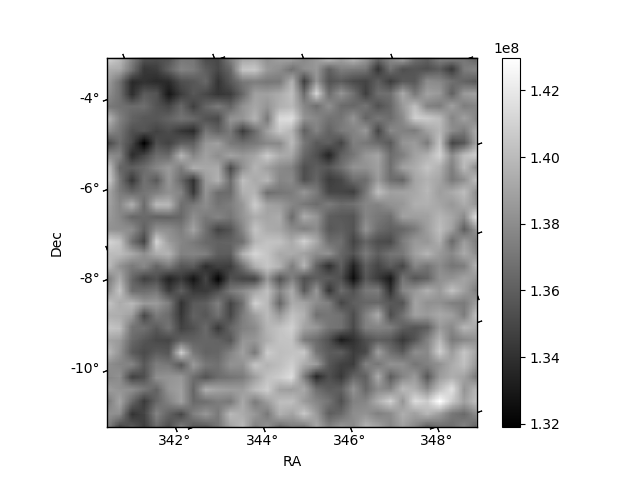
Histogram calculated using DETX and DETY for each event in the final _common_clean file
| Quadrant A | 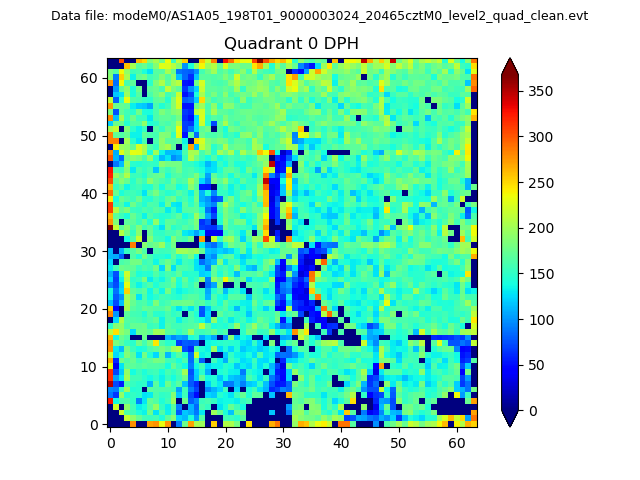 |
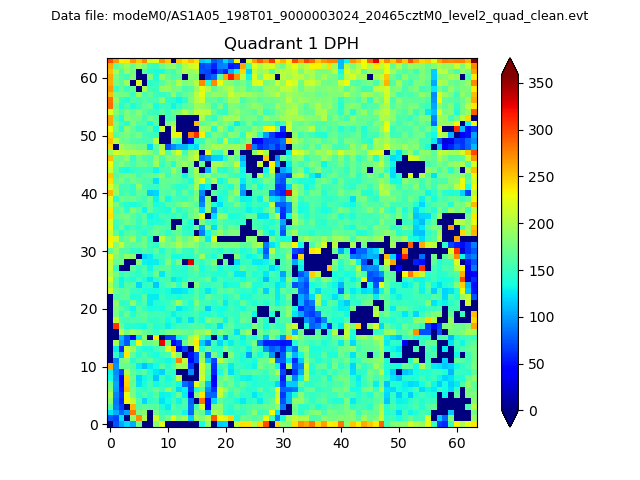 |
Quadrant B |
|---|---|---|---|
| Quadrant D | 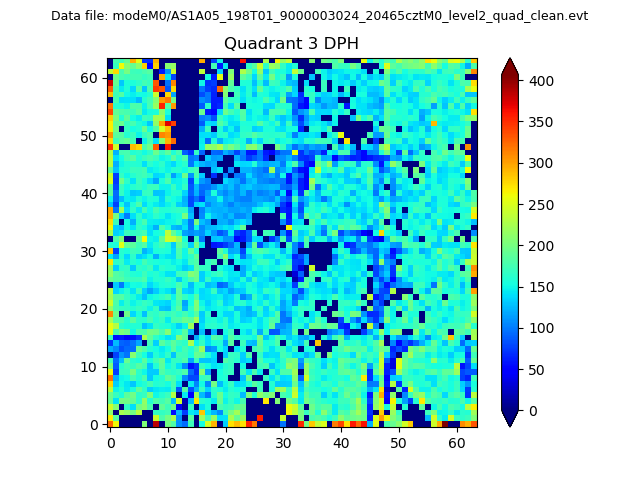 |
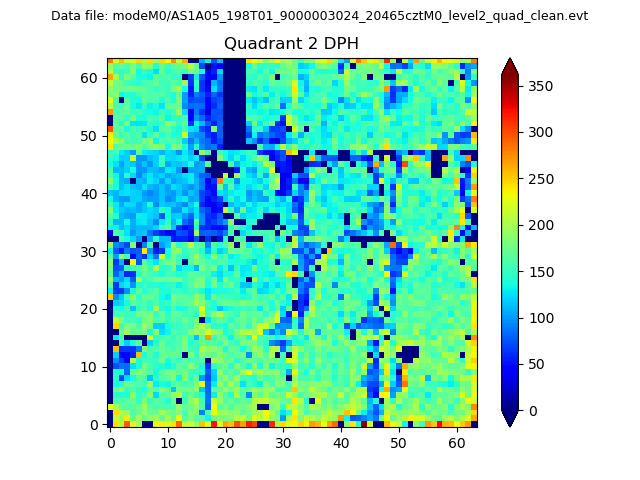 |
Quadrant C |
| Plot type | Count rate plots | Images |
|---|---|---|
| Comparison with Poisson distribution Blue bars denote a histogram of data divided into 1 sec bins. Red curve is a Poisson curve with rate = median count rate of data. |
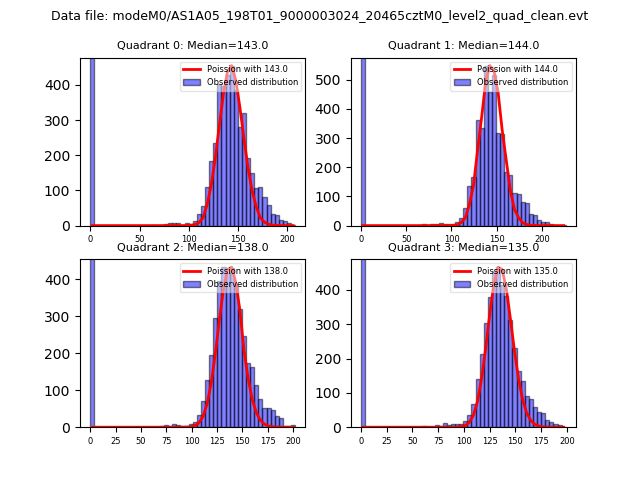 |
 |
| Quadrant-wise count rates Data is divided into 100 sec bins |
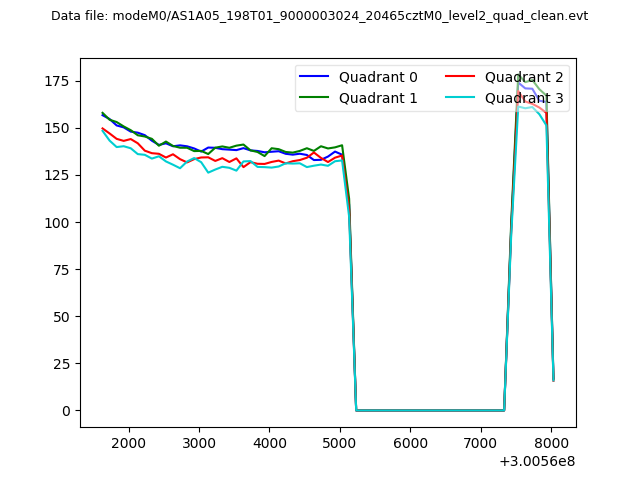 |
|
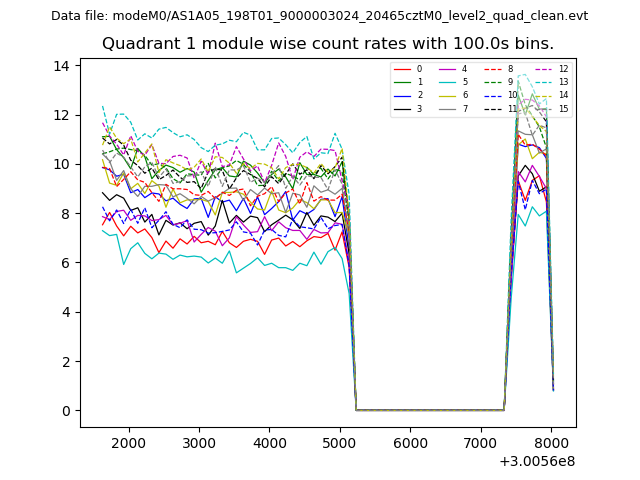
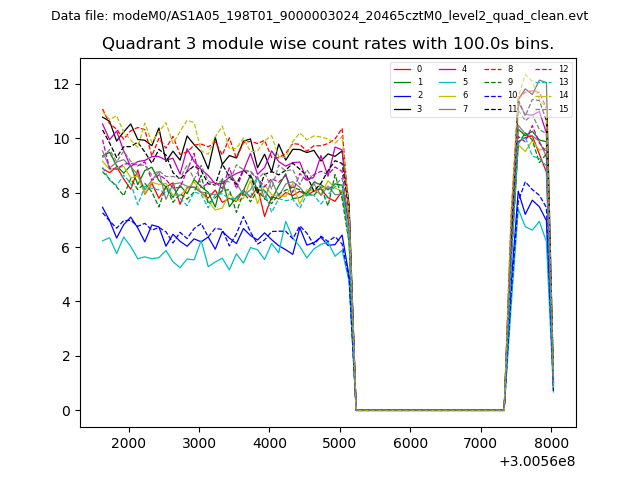
| Module-wise count rates for Quadrant A Data is divided into 100 sec bins |
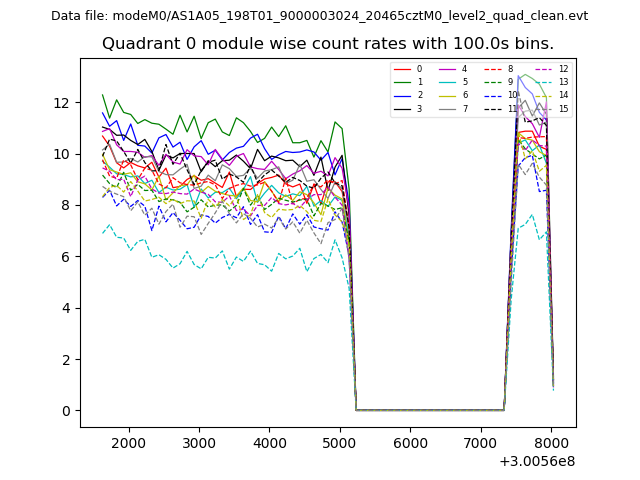 |
 |
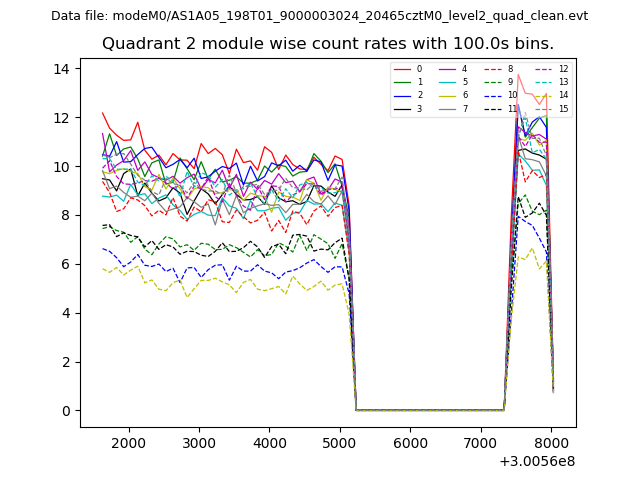
| Module-wise count rates for Quadrant B Data is divided into 100 sec bins |
 |
 |
| Module-wise count rates for Quadrant C Data is divided into 100 sec bins |
 |
 |
| Module-wise count rates for Quadrant D Data is divided into 100 sec bins |
 |
 |
| Parameter | Plot |
|---|---|
| CZT HV Monitor | 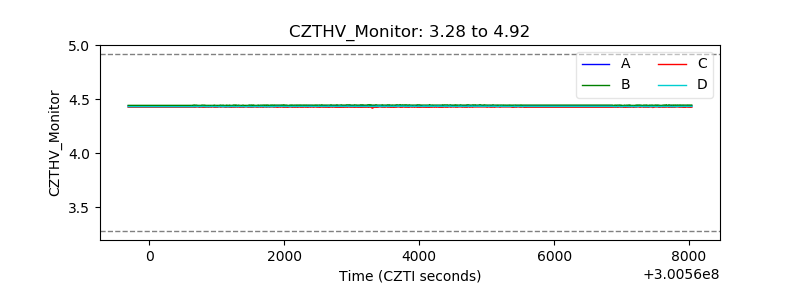 |
| D_VDD | 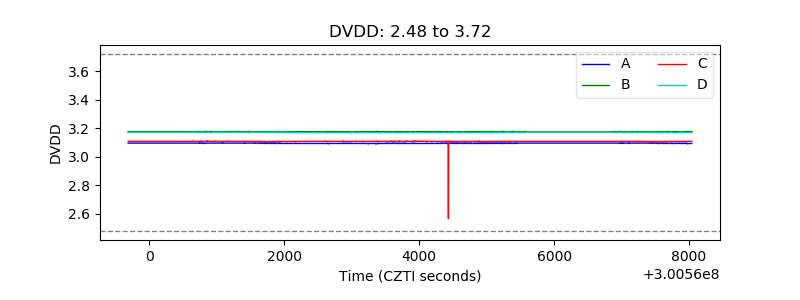 |
| Temperature 1 | 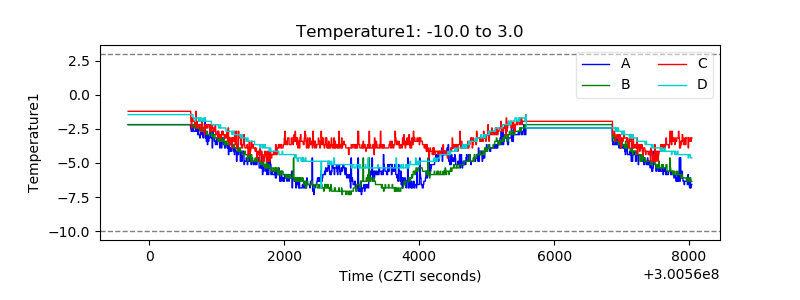 |
| Veto HV Monitor | 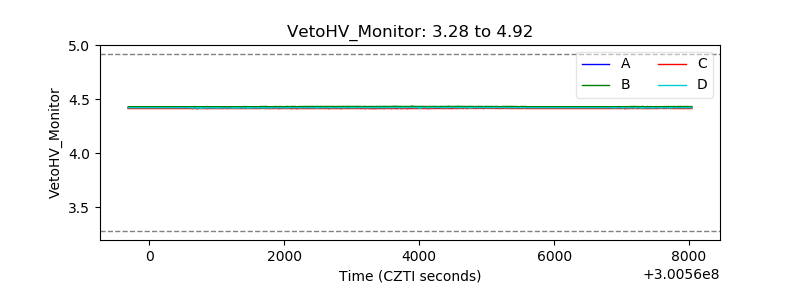 |
| Veto LLD | 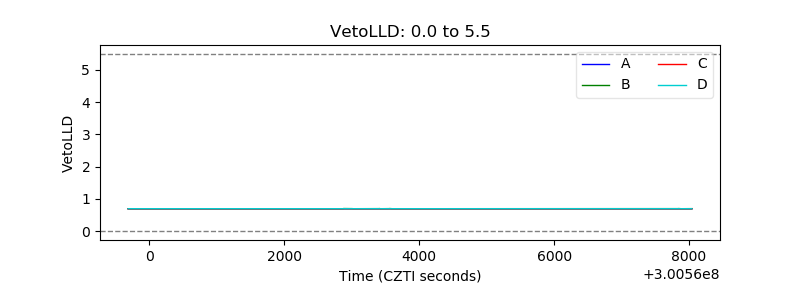 |
| Alpha Counter | 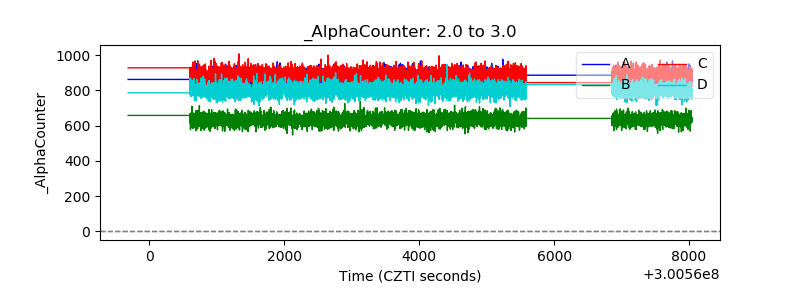 |
| _CPM_Rate | 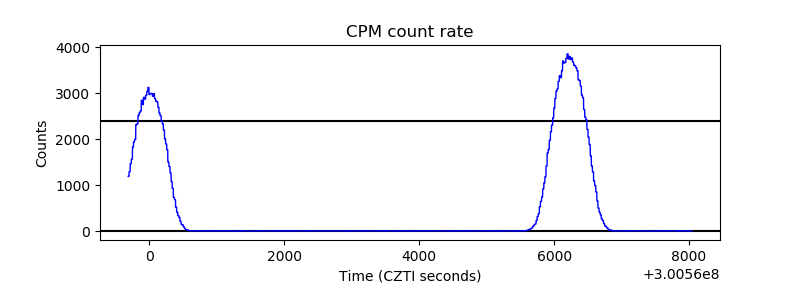 |
| CZT Counter |  |
| +2.5 Volts monitor |  |
| +5 Volts monitor |  |
| _ROLL_ROT | 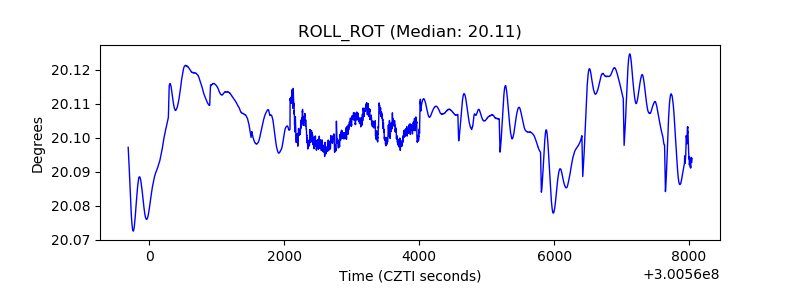 |
| _Roll_DEC | 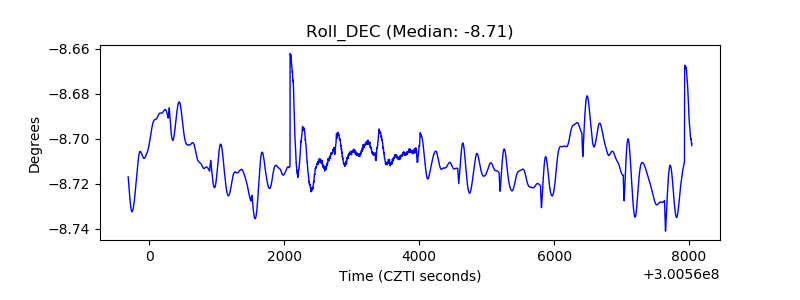 |
| _Roll_RA | 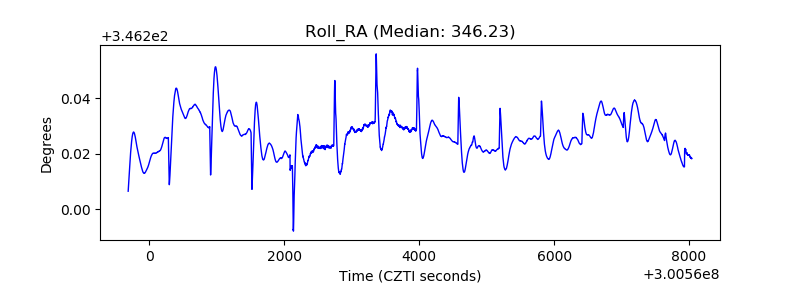 |
| Veto Counter | 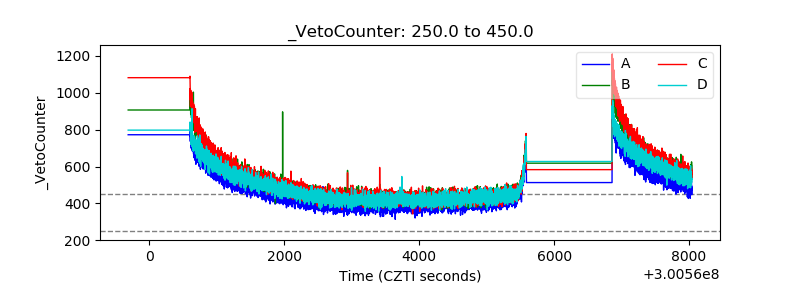 |