| Param | Original file | Final file |
|---|---|---|
| Filename | modeM0/AS1A05_198T01_9000003024_20468cztM0_level2.evt | modeM0/AS1A05_198T01_9000003024_20468cztM0_level2_quad_clean.evt |
| Size (bytes) | 487,460,160 | 104,984,640 |
| Size | 464.9 MB | 100.1 MB |
| Events in quadrant A | 3,142,451 | 702,925 |
| Events in quadrant B | 3,286,735 | 721,933 |
| Events in quadrant C | 3,531,048 | 687,629 |
| Events in quadrant D | 4,382,105 | 634,499 |
| Mode M9 | |||
|---|---|---|---|
| Quadrant | BADHDUFLAG | Total packets | Discarded packets |
| A | 0 | 18 | 0 |
| B | 0 | 19 | 0 |
| C | 0 | 19 | 0 |
| D | 0 | 19 | 0 |
| Mode SS | |||
|---|---|---|---|
| Quadrant | BADHDUFLAG | Total packets | Discarded packets |
| A | 0 | 126 | 0 |
| B | 0 | 126 | 0 |
| C | 0 | 126 | 0 |
| D | 0 | 126 | 0 |
| Mode M0 | |||
|---|---|---|---|
| Quadrant | BADHDUFLAG | Total packets | Discarded packets |
| A | 0 | 13177 | 2 |
| B | 0 | 13569 | 2 |
| C | 0 | 14332 | 2 |
| D | 0 | 17033 | 2 |
| Quadrant | Total seconds | Saturated seconds | Saturation percentage |
|---|---|---|---|
| A | 6193 | 39 | 0.629743% |
| B | 6193 | 64 | 1.033425% |
| C | 6193 | 126 | 2.034555% |
| D | 6193 | 393 | 6.345874% |
Noise dominated data is calculated using 1-second bins in cleaned event files. If a bin has >2000 counts, and if more than 50% of those come from <1% of pixels, then it is considered to be noise-dominated and hence unusable.
| Quadrant | # 1 sec bins | Bins with >0 counts | Bins with >2000 counts | High rate bins dominated by noise | Noise dominated (total time) | Noise dominated (detector-on time) | Marked lightcurve |
|---|---|---|---|---|---|---|---|
| A | 7513 | 6195 | 0 | 0 | 0.00% | 0.00% | 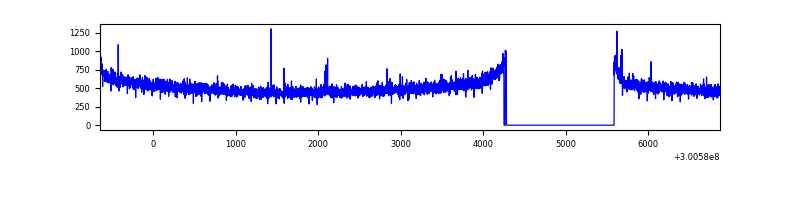 |
| B | 7513 | 6194 | 3 | 3 | 0.04% | 0.05% | 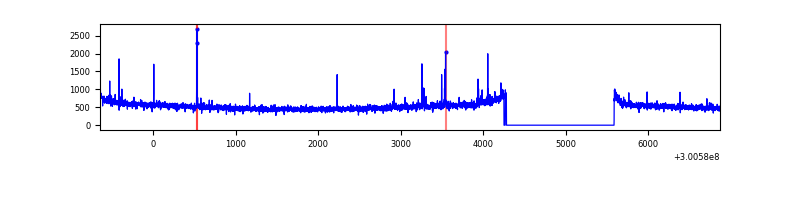 |
| C | 7513 | 6195 | 17 | 17 | 0.23% | 0.27% | 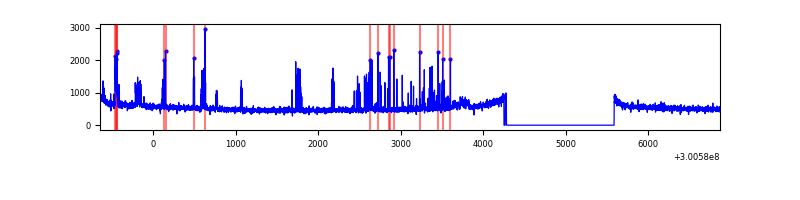 |
| D | 7513 | 6195 | 363 | 363 | 4.83% | 5.86% | 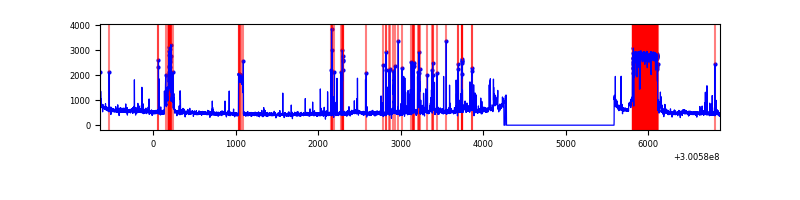 |
Top three noisy pixels from each quadrant. If the there are fewer than three noisy pixels in the level2.evt file, extra rows are filled as -1
| Pixel properties | Quadrant properties | ||||||
|---|---|---|---|---|---|---|---|
| Quadrant | DetID | PixID | Counts | Sigma | Mean | Median | Sigma |
| A | 12 | 16 | 10653 | 60.69 | 812 | 798 | 162.4 |
| A | 13 | 254 | 8307 | 46.24 | 812 | 798 | 162.4 |
| A | 12 | 194 | 7270 | 39.86 | 812 | 798 | 162.4 |
| B | 0 | 189 | 72995 | 465.38 | 816 | 796 | 155.1 |
| B | 12 | 111 | 17880 | 110.12 | 816 | 796 | 155.1 |
| B | 11 | 111 | 16172 | 99.11 | 816 | 796 | 155.1 |
| C | 3 | 9 | 294467 | 1594.55 | 795 | 804 | 184.2 |
| C | 14 | 238 | 126418 | 682.07 | 795 | 804 | 184.2 |
| C | 9 | 221 | 7053 | 33.93 | 795 | 804 | 184.2 |
| D | 15 | 0 | 1097087 | 5858.75 | 770 | 749 | 187.1 |
| D | 1 | 52 | 256908 | 1368.9 | 770 | 749 | 187.1 |
| D | 7 | 238 | 90916 | 481.85 | 770 | 749 | 187.1 |
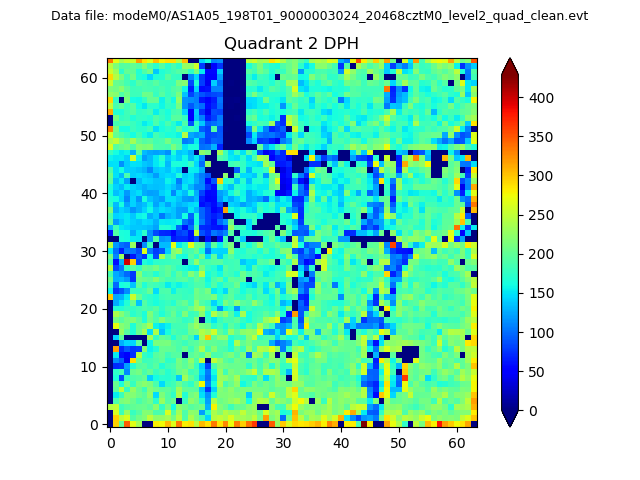
Histogram calculated using DETX and DETY for each event in the final _common_clean file
| Quadrant A | 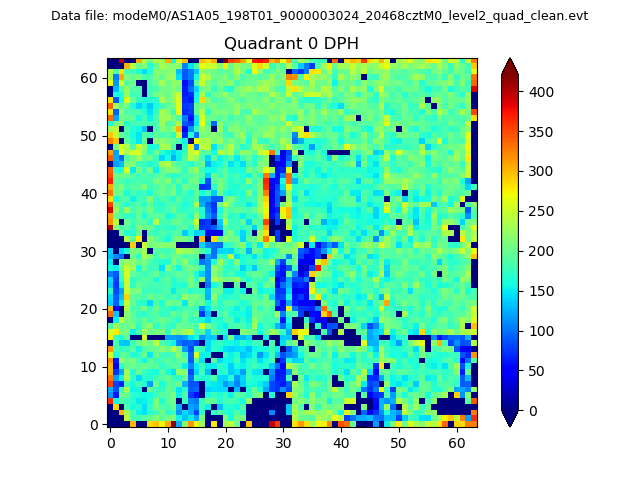 |
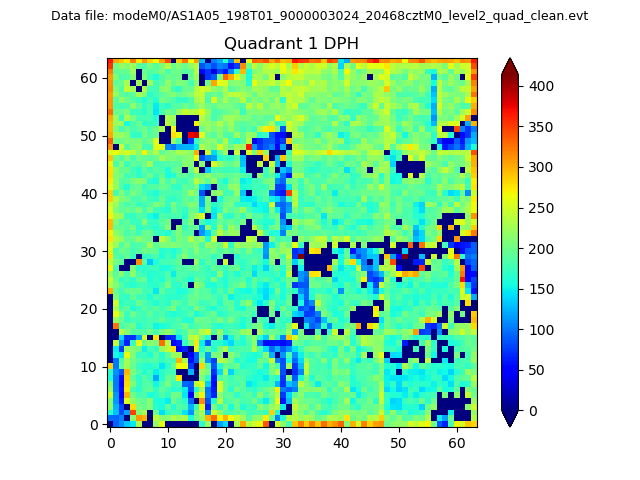 |
Quadrant B |
|---|---|---|---|
| Quadrant D | 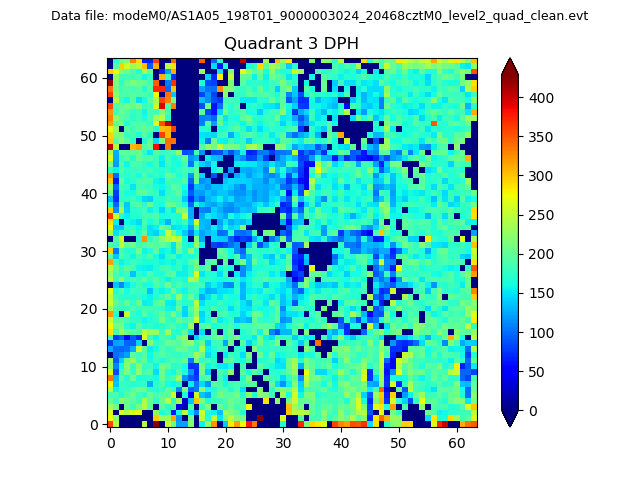 |
 |
Quadrant C |
| Plot type | Count rate plots | Images |
|---|---|---|
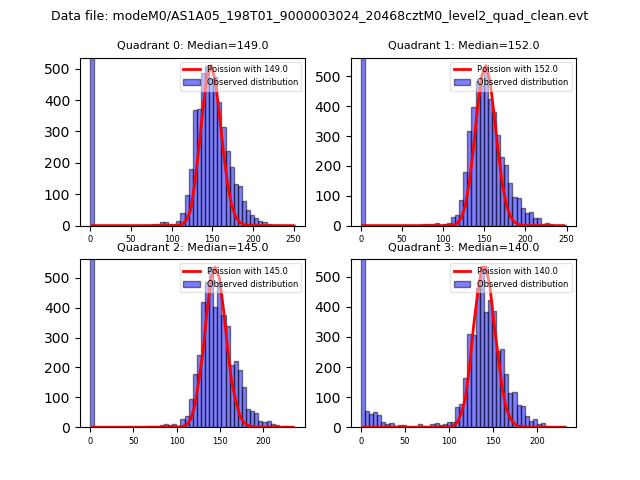
| Comparison with Poisson distribution Blue bars denote a histogram of data divided into 1 sec bins. Red curve is a Poisson curve with rate = median count rate of data. |
 |
 |
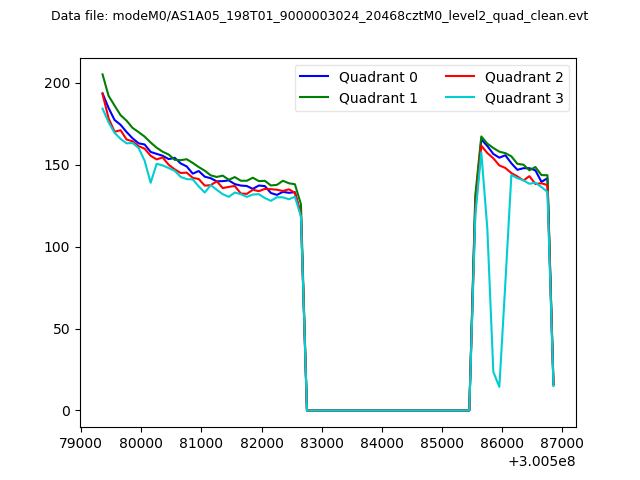
| Quadrant-wise count rates Data is divided into 100 sec bins |
 |
|
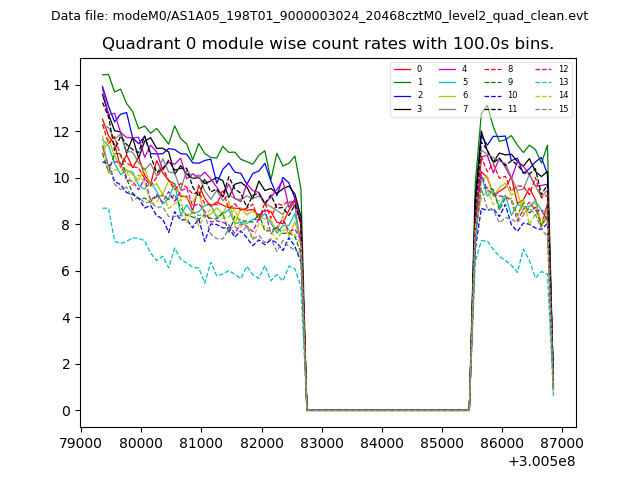
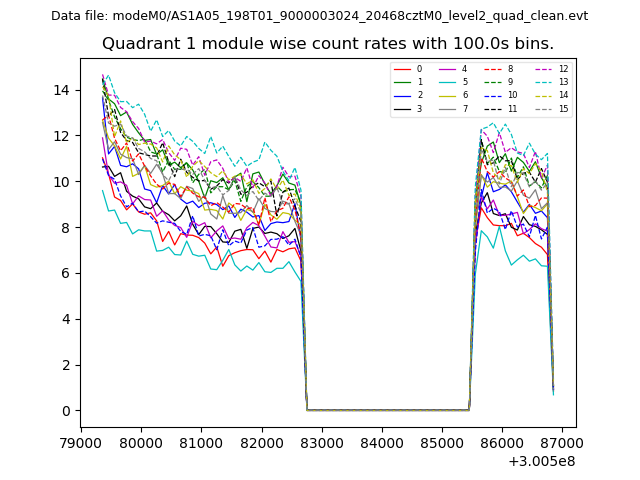
| Module-wise count rates for Quadrant A Data is divided into 100 sec bins |
 |
 |
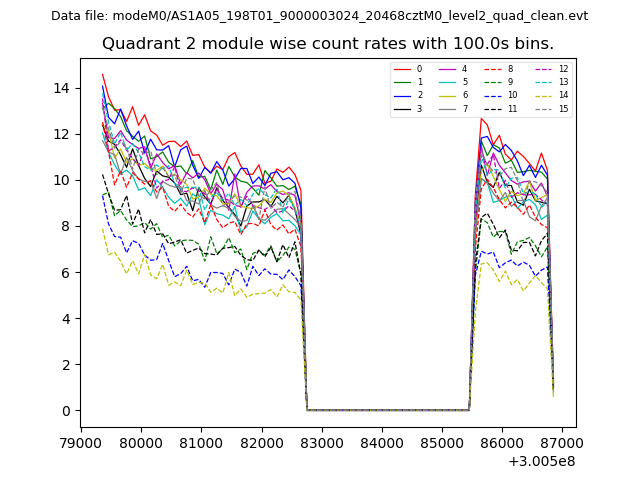
| Module-wise count rates for Quadrant B Data is divided into 100 sec bins |
 |
 |
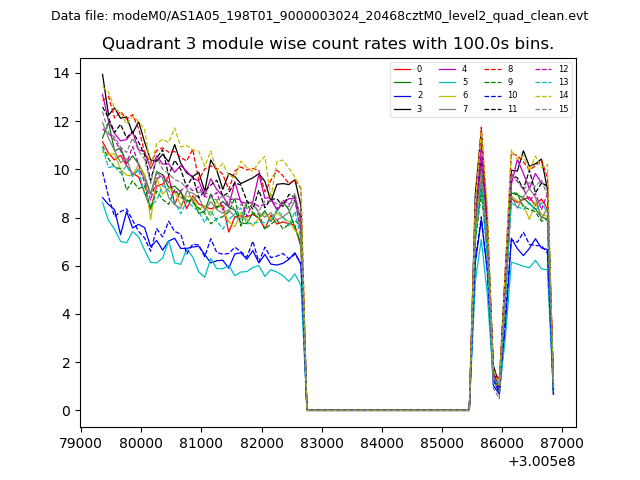
| Module-wise count rates for Quadrant C Data is divided into 100 sec bins |
 |
 |
| Module-wise count rates for Quadrant D Data is divided into 100 sec bins |
 |
 |
| Parameter | Plot |
|---|---|
| CZT HV Monitor | 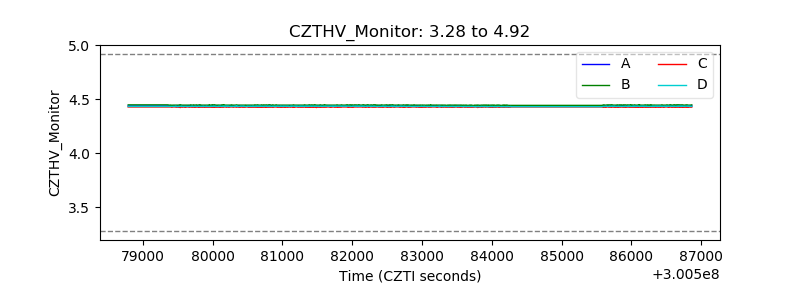 |
| D_VDD | 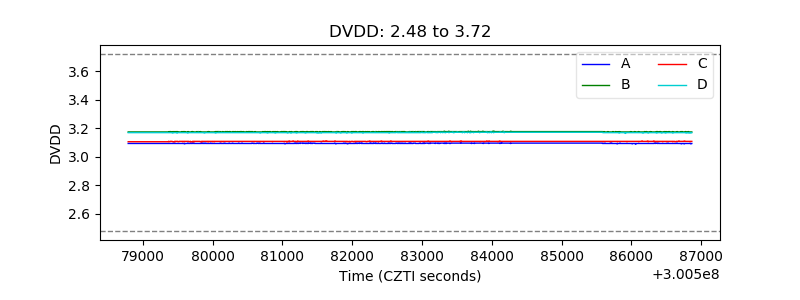 |
| Temperature 1 | 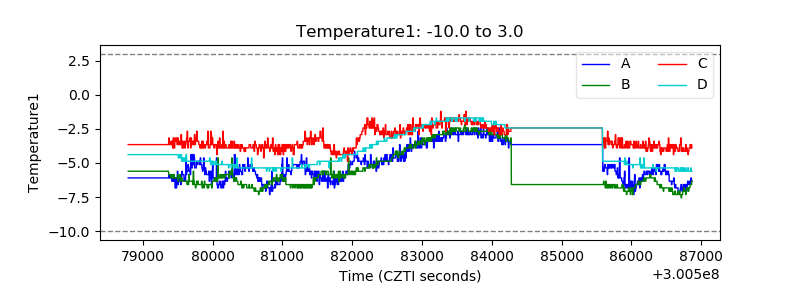 |
| Veto HV Monitor | 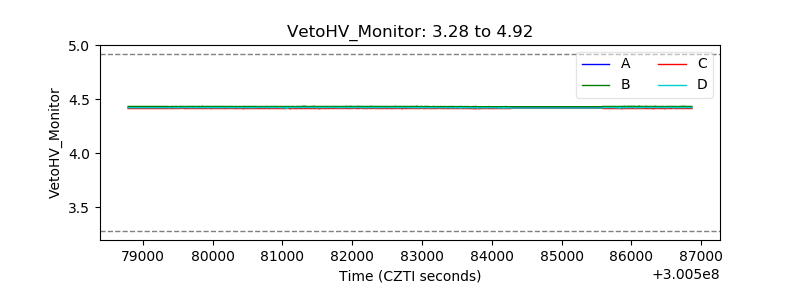 |
| Veto LLD | 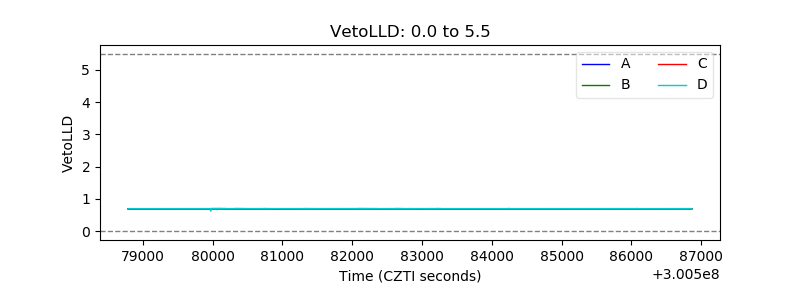 |
| Alpha Counter | 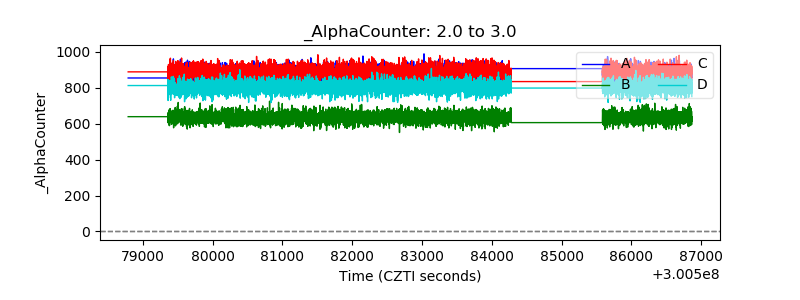 |
| _CPM_Rate | 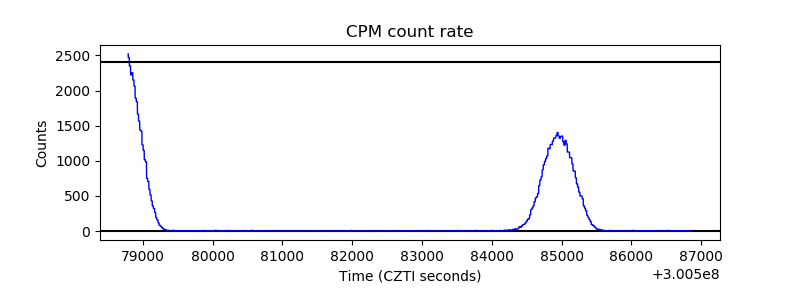 |
| CZT Counter | 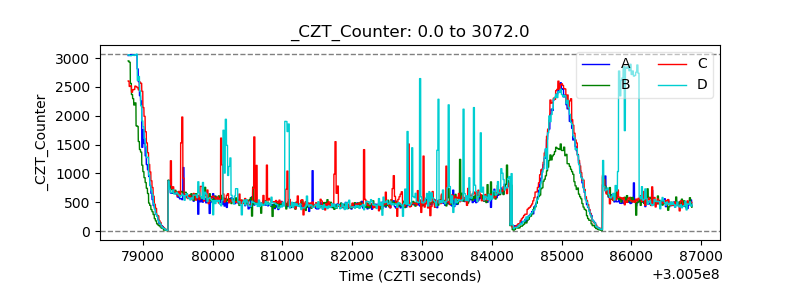 |
| +2.5 Volts monitor |  |
| +5 Volts monitor |  |
| _ROLL_ROT | 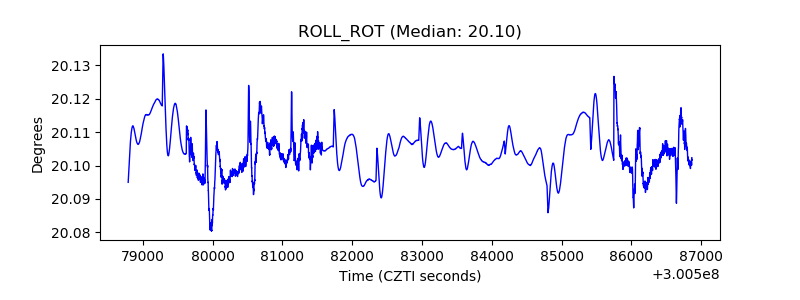 |
| _Roll_DEC | 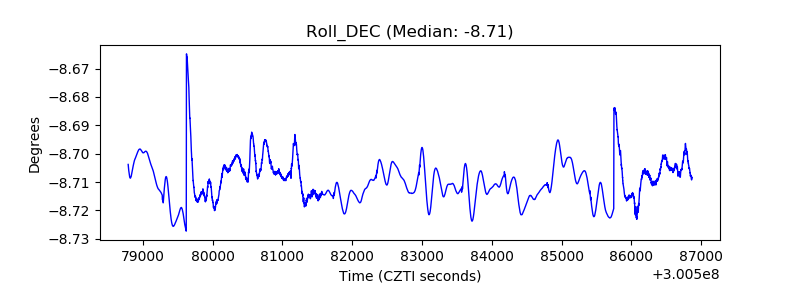 |
| _Roll_RA | 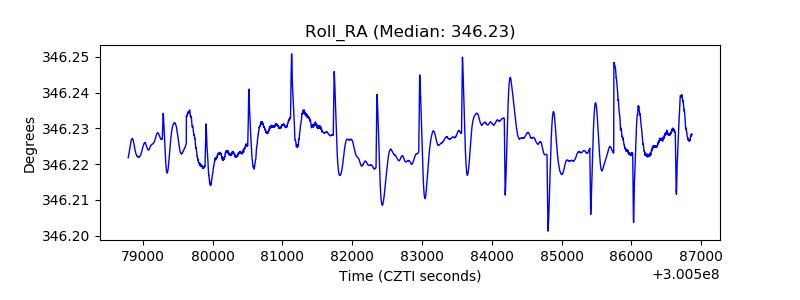 |
| Veto Counter | 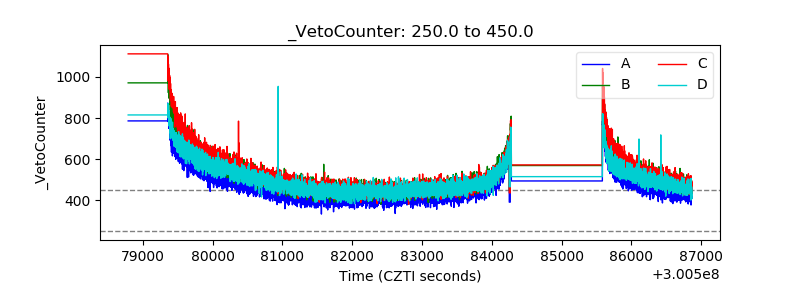 |