| Param | Original file | Final file |
|---|---|---|
| Filename | modeM0/AS1A05_198T01_9000003024_20470cztM0_level2.evt | modeM0/AS1A05_198T01_9000003024_20470cztM0_level2_quad_clean.evt |
| Size (bytes) | 1,631,548,800 | 322,632,000 |
| Size | 1.5 GB | 307.7 MB |
| Events in quadrant A | 10,730,479 | 2,117,411 |
| Events in quadrant B | 11,258,118 | 2,167,925 |
| Events in quadrant C | 11,857,607 | 2,071,464 |
| Events in quadrant D | 14,148,592 | 1,969,942 |
| Mode M9 | |||
|---|---|---|---|
| Quadrant | BADHDUFLAG | Total packets | Discarded packets |
| A | 0 | 64 | 0 |
| B | 0 | 64 | 0 |
| C | 0 | 64 | 0 |
| D | 0 | 64 | 0 |
| Mode SS | |||
|---|---|---|---|
| Quadrant | BADHDUFLAG | Total packets | Discarded packets |
| A | 0 | 430 | 0 |
| B | 0 | 430 | 0 |
| C | 0 | 430 | 0 |
| D | 0 | 430 | 0 |
| Mode M0 | |||
|---|---|---|---|
| Quadrant | BADHDUFLAG | Total packets | Discarded packets |
| A | 0 | 45030 | 5 |
| B | 0 | 46619 | 5 |
| C | 0 | 48444 | 5 |
| D | 0 | 55870 | 5 |
| Quadrant | Total seconds | Saturated seconds | Saturation percentage |
|---|---|---|---|
| A | 20997 | 172 | 0.819165% |
| B | 20997 | 301 | 1.433538% |
| C | 20998 | 450 | 2.143061% |
| D | 20998 | 1099 | 5.233832% |
Noise dominated data is calculated using 1-second bins in cleaned event files. If a bin has >2000 counts, and if more than 50% of those come from <1% of pixels, then it is considered to be noise-dominated and hence unusable.
| Quadrant | # 1 sec bins | Bins with >0 counts | Bins with >2000 counts | High rate bins dominated by noise | Noise dominated (total time) | Noise dominated (detector-on time) | Marked lightcurve |
|---|---|---|---|---|---|---|---|
| A | 27382 | 21001 | 0 | 0 | 0.00% | 0.00% | 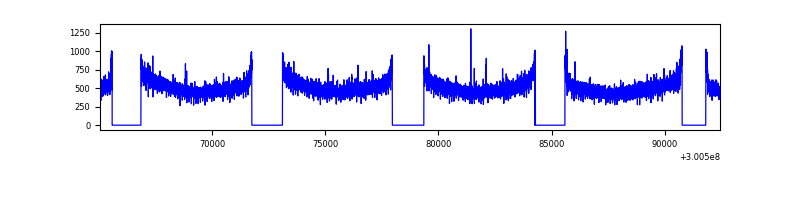 |
| B | 27382 | 21000 | 16 | 16 | 0.06% | 0.08% | 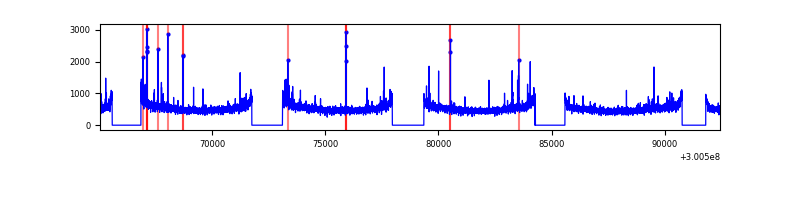 |
| C | 27383 | 21002 | 61 | 61 | 0.22% | 0.29% |  |
| D | 27383 | 21003 | 815 | 815 | 2.98% | 3.88% | 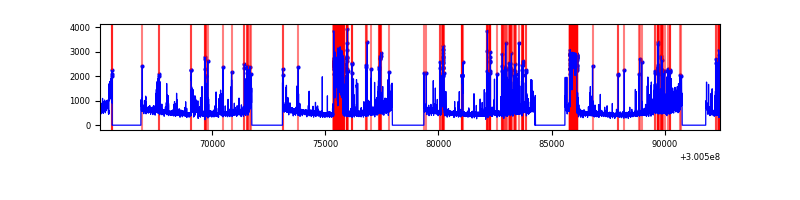 |
Top three noisy pixels from each quadrant. If the there are fewer than three noisy pixels in the level2.evt file, extra rows are filled as -1
| Pixel properties | Quadrant properties | ||||||
|---|---|---|---|---|---|---|---|
| Quadrant | DetID | PixID | Counts | Sigma | Mean | Median | Sigma |
| A | 12 | 16 | 38930 | 65.68 | 2774 | 2724 | 551.3 |
| A | 12 | 194 | 26467 | 43.07 | 2774 | 2724 | 551.3 |
| A | 13 | 254 | 25219 | 40.81 | 2774 | 2724 | 551.3 |
| B | 0 | 189 | 217982 | 413.77 | 2777 | 2715 | 520.3 |
| B | 12 | 111 | 61592 | 113.17 | 2777 | 2715 | 520.3 |
| B | 11 | 111 | 55003 | 100.5 | 2777 | 2715 | 520.3 |
| C | 3 | 9 | 823256 | 1320.4 | 2698 | 2725 | 621.4 |
| C | 14 | 238 | 427736 | 683.93 | 2698 | 2725 | 621.4 |
| C | 3 | 233 | 44064 | 66.52 | 2698 | 2725 | 621.4 |
| D | 1 | 52 | 2205213 | 3413.19 | 2680 | 2617 | 645.3 |
| D | 15 | 0 | 1539987 | 2382.34 | 2680 | 2617 | 645.3 |
| D | 7 | 238 | 113173 | 171.32 | 2680 | 2617 | 645.3 |
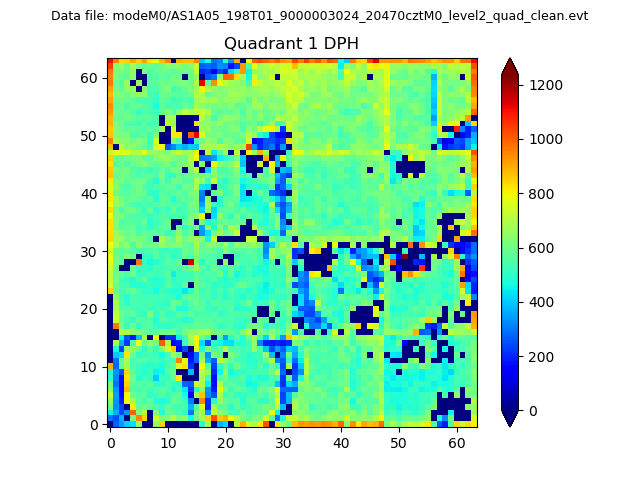
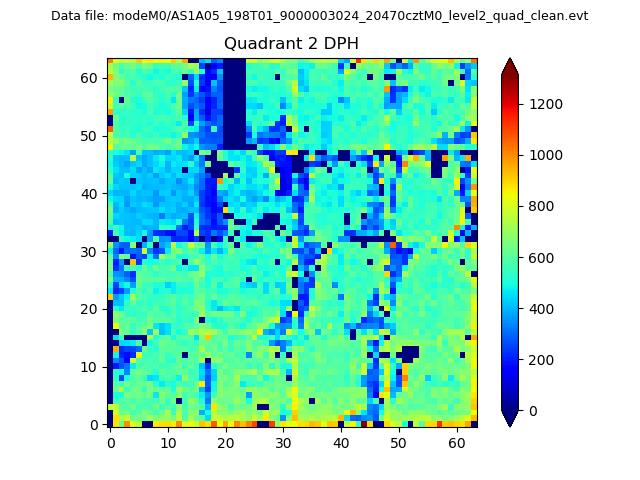
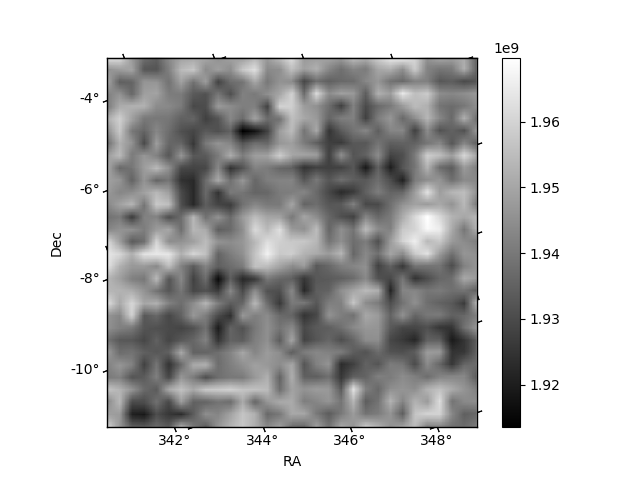
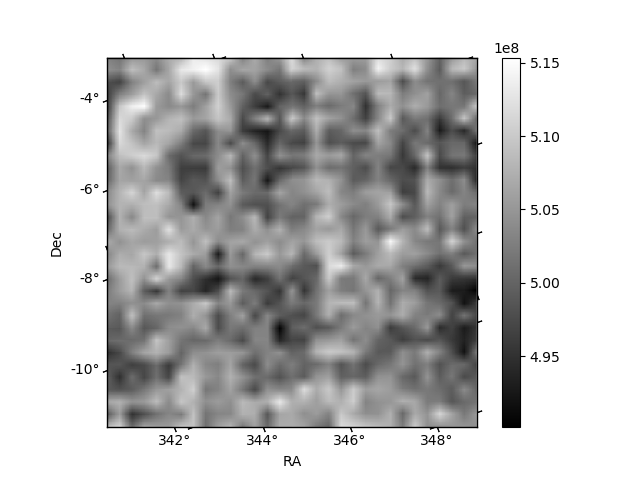
Histogram calculated using DETX and DETY for each event in the final _common_clean file
| Quadrant A | 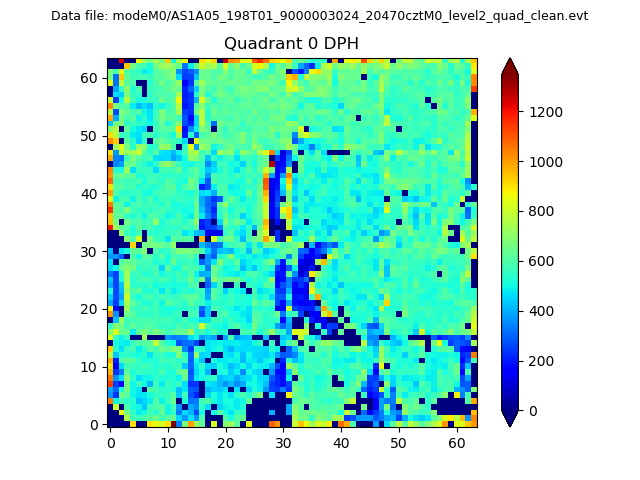 |
 |
Quadrant B |
|---|---|---|---|
| Quadrant D | 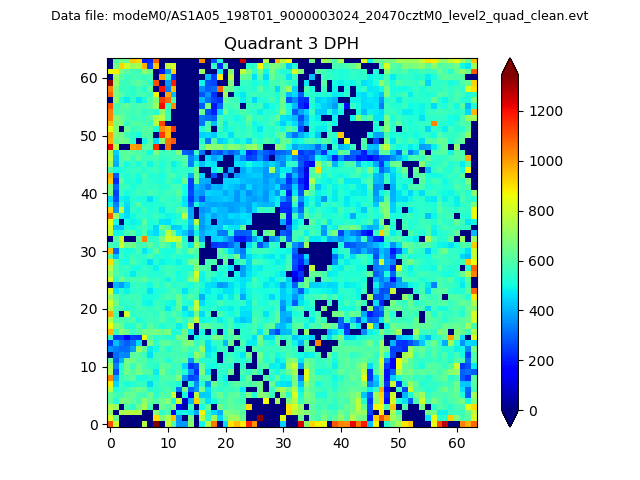 |
 |
Quadrant C |
| Plot type | Count rate plots | Images |
|---|---|---|
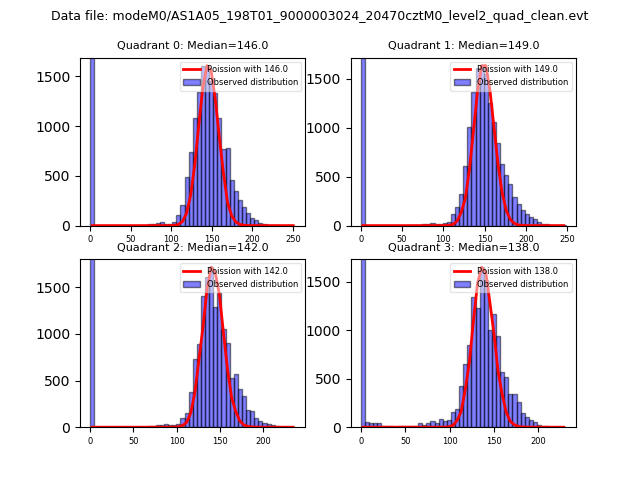
| Comparison with Poisson distribution Blue bars denote a histogram of data divided into 1 sec bins. Red curve is a Poisson curve with rate = median count rate of data. |
 |
 |
| Quadrant-wise count rates Data is divided into 100 sec bins |
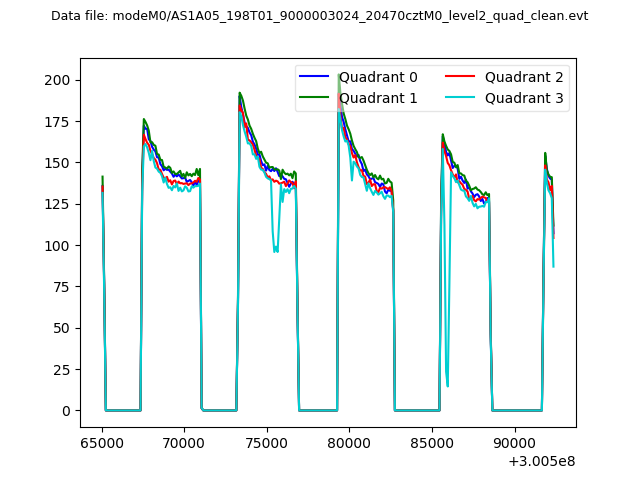 |
|
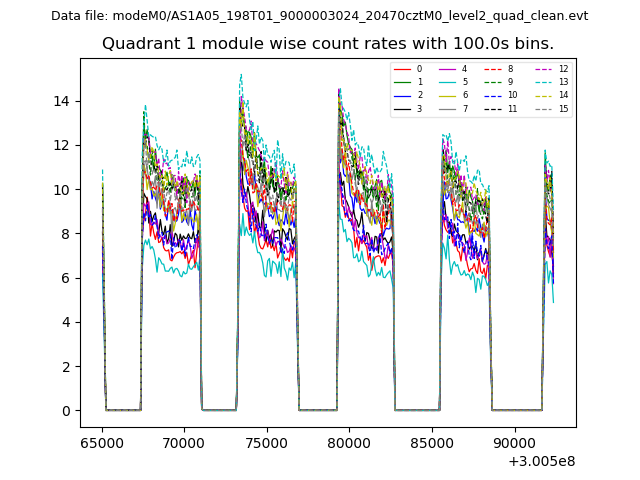
| Module-wise count rates for Quadrant A Data is divided into 100 sec bins |
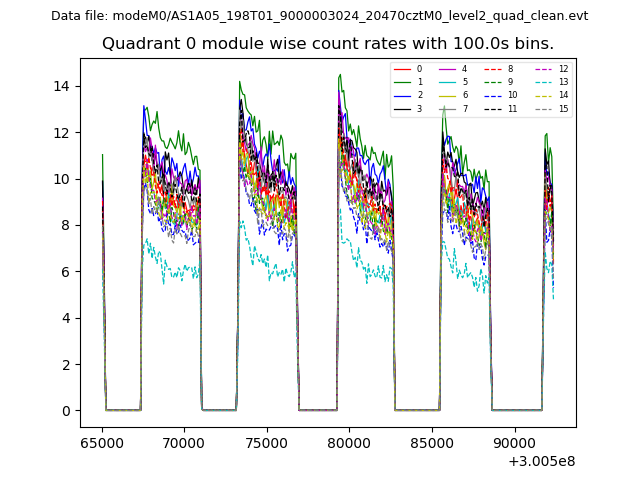 |
 |
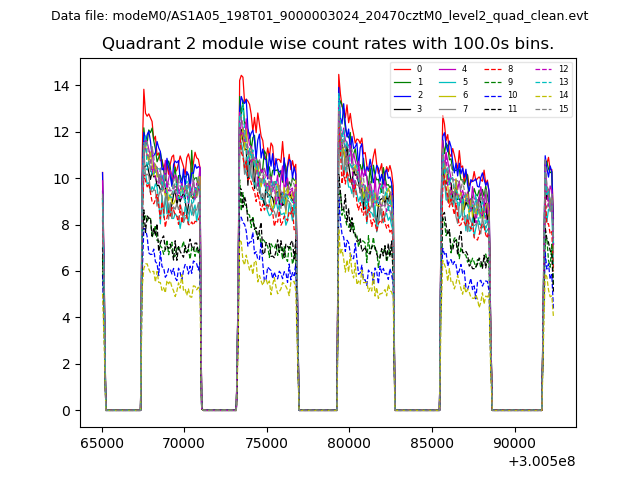
| Module-wise count rates for Quadrant B Data is divided into 100 sec bins |
 |
 |
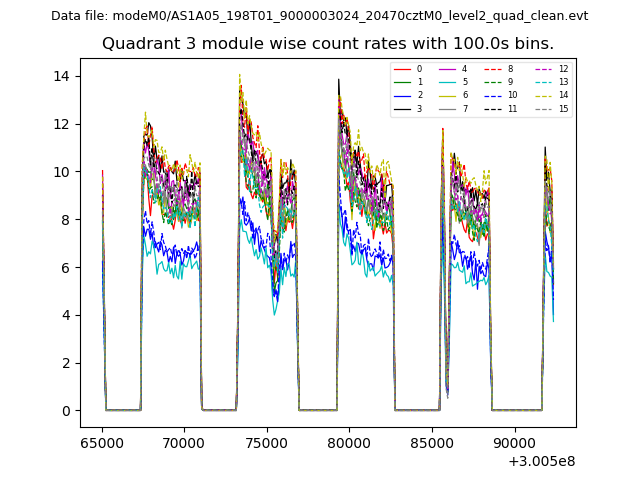
| Module-wise count rates for Quadrant C Data is divided into 100 sec bins |
 |
 |
| Module-wise count rates for Quadrant D Data is divided into 100 sec bins |
 |
 |
| Parameter | Plot |
|---|---|
| CZT HV Monitor | 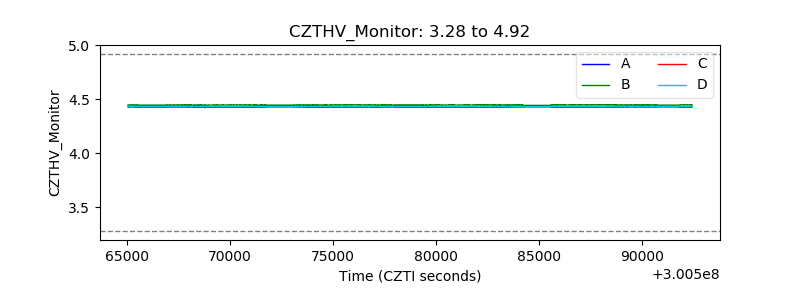 |
| D_VDD | 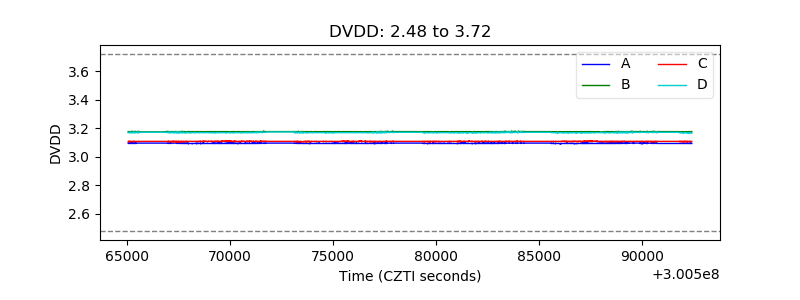 |
| Temperature 1 | 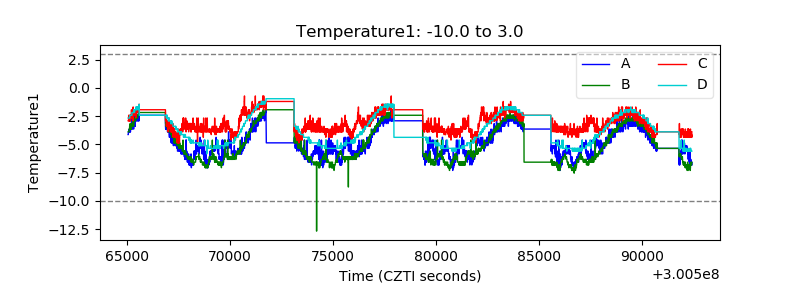 |
| Veto HV Monitor | 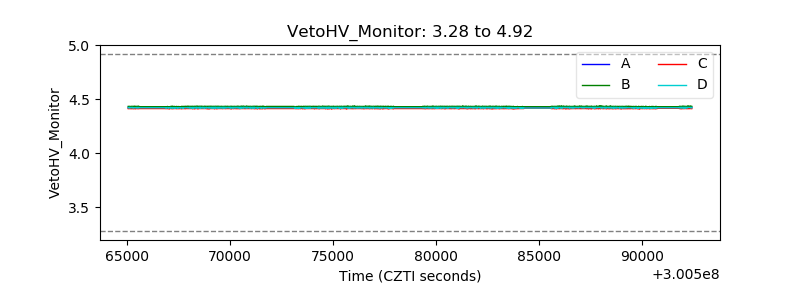 |
| Veto LLD | 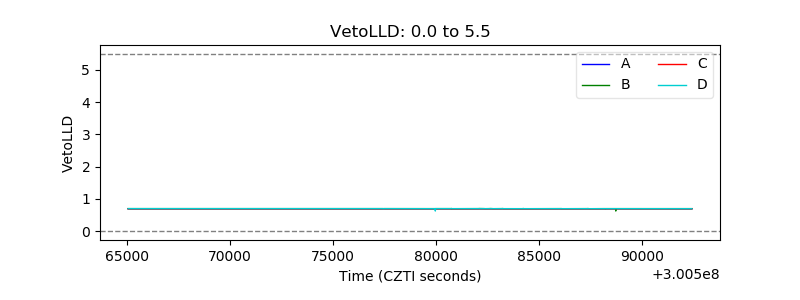 |
| Alpha Counter | 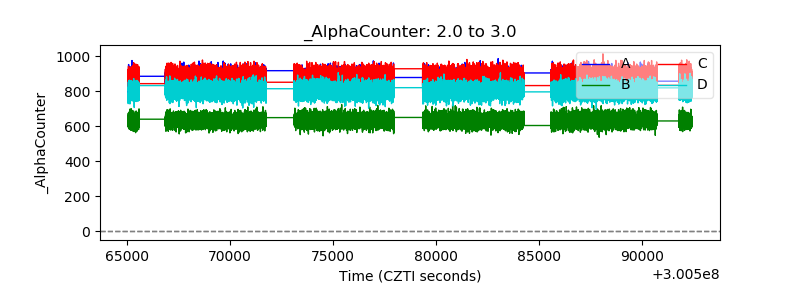 |
| _CPM_Rate | 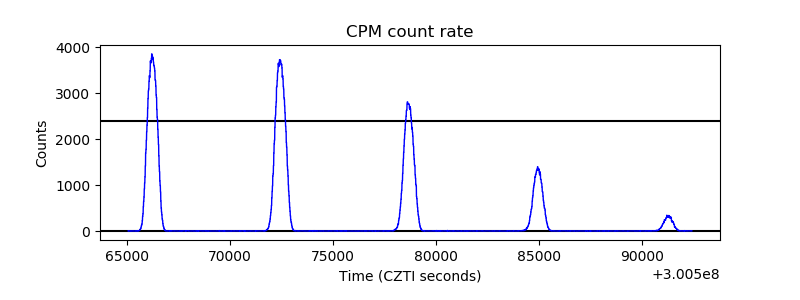 |
| CZT Counter | 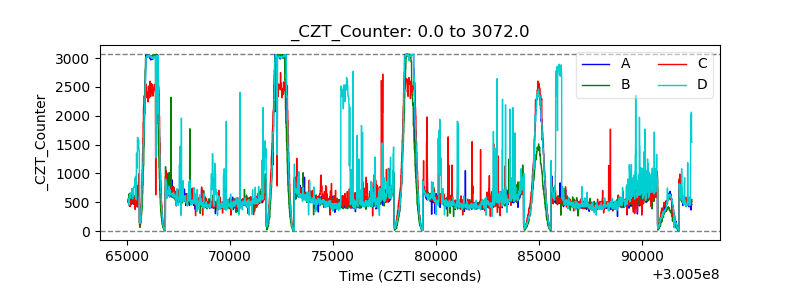 |
| +2.5 Volts monitor |  |
| +5 Volts monitor |  |
| _ROLL_ROT | 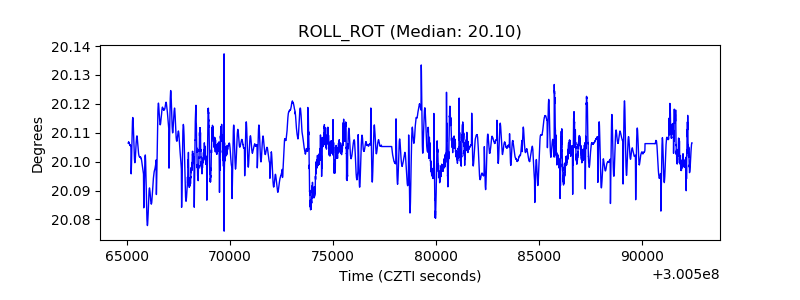 |
| _Roll_DEC | 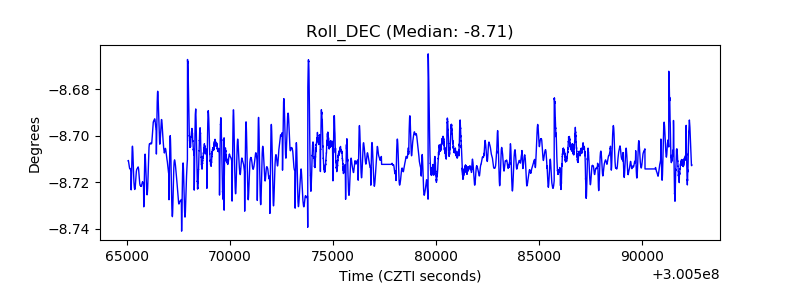 |
| _Roll_RA | 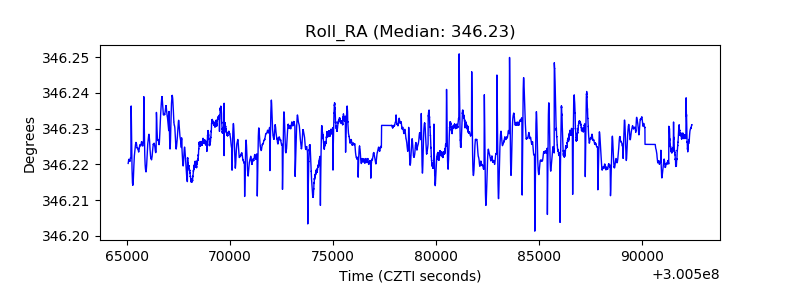 |
| Veto Counter | 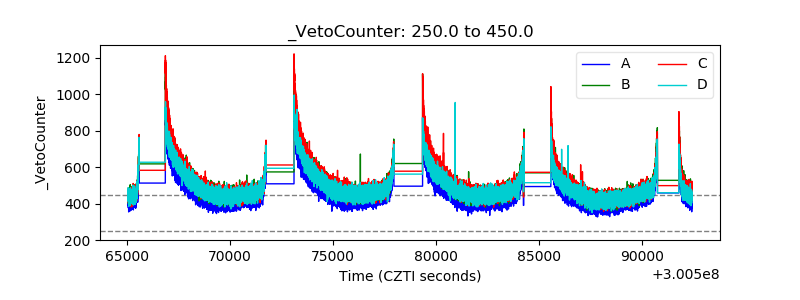 |