| Param | Original file | Final file |
|---|---|---|
| Filename | modeM0/AS1A05_208T03_9000003026cztM0_level2.fits | modeM0/AS1A05_208T03_9000003026cztM0_level2_quad_clean.evt |
| Size (bytes) | 911,926,080 | 852,315,840 |
| Size | 869.7 MB | 812.8 MB |
| Events in quadrant A | 5,588,080 | 5,084,917 |
| Events in quadrant B | 5,376,582 | 5,101,386 |
| Events in quadrant C | 5,508,712 | 4,873,167 |
| Events in quadrant D | 4,567,230 | 4,179,121 |
| Mode M0 | |||
|---|---|---|---|
| Quadrant | BADHDUFLAG | Total packets | Discarded packets |
| A | 0 | 210307 | 0 |
| B | 0 | 216914 | 0 |
| C | 0 | 199404 | 0 |
| D | 0 | 311713 | 0 |
| Mode SS | |||
|---|---|---|---|
| Quadrant | BADHDUFLAG | Total packets | Discarded packets |
| A | 0 | 1952 | 0 |
| B | 0 | 1952 | 0 |
| C | 0 | 1952 | 0 |
| D | 0 | 1952 | 0 |
| Mode M9 | |||
|---|---|---|---|
| Quadrant | BADHDUFLAG | Total packets | Discarded packets |
| A | 0 | 130 | 0 |
| B | 0 | 130 | 0 |
| C | 0 | 130 | 0 |
| D | 0 | 130 | 0 |
| Quadrant | Total seconds | Saturated seconds | Saturation percentage |
|---|---|---|---|
| A | 95904 | 2037 | 2.123999% |
| B | 95905 | 2113 | 2.203222% |
| C | 95905 | 1594 | 1.662061% |
| D | 95905 | 7714 | 8.043376% |
Noise dominated data is calculated using 1-second bins in cleaned event files. If a bin has >2000 counts, and if more than 50% of those come from <1% of pixels, then it is considered to be noise-dominated and hence unusable.
| Quadrant | # 1 sec bins | Bins with >0 counts | Bins with >2000 counts | High rate bins dominated by noise | Noise dominated (total time) | Noise dominated (detector-on time) | Marked lightcurve |
|---|---|---|---|---|---|---|---|
| A | 108779 | 95886 | 0 | 0 | 0.00% | 0.00% | 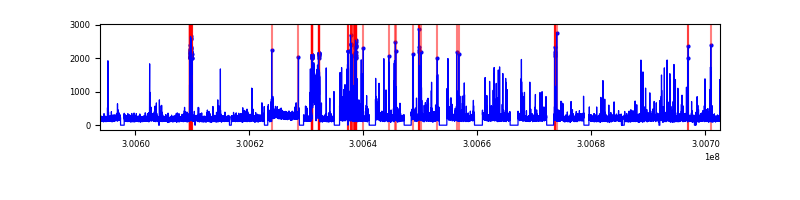 |
| B | 108780 | 95889 | 0 | 0 | 0.00% | 0.00% | 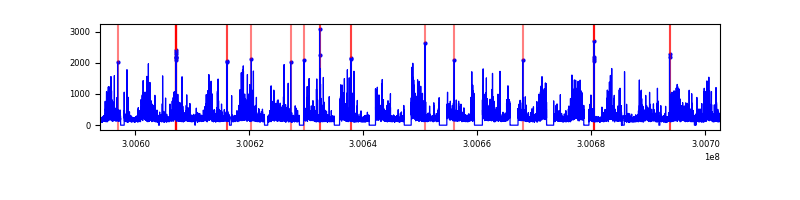 |
| C | 108780 | 95891 | 0 | 0 | 0.00% | 0.00% | 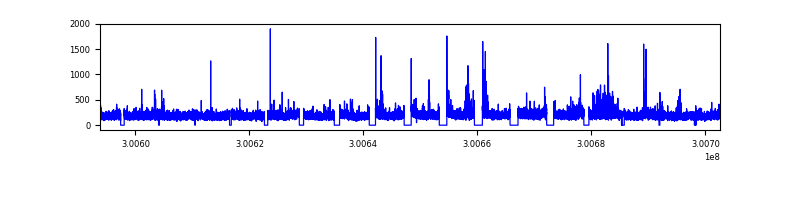 |
| D | 108779 | 95811 | 0 | 0 | 0.00% | 0.00% | 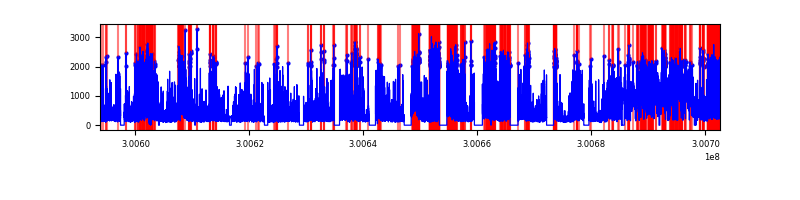 |
Top three noisy pixels from each quadrant. If the there are fewer than three noisy pixels in the level2.evt file, extra rows are filled as -1
| Pixel properties | Quadrant properties | ||||||
|---|---|---|---|---|---|---|---|
| Quadrant | DetID | PixID | Counts | Sigma | Mean | Median | Sigma |
| A | 0 | 29 | 5494 | 11.42 | 1455 | 1364 | 361.8 |
| A | 7 | 110 | 4591 | 8.92 | 1455 | 1364 | 361.8 |
| A | 9 | 19 | 4249 | 7.97 | 1455 | 1364 | 361.8 |
| B | 2 | 9 | 4425 | 11.09 | 1425 | 1363 | 276.0 |
| B | 2 | 8 | 3714 | 8.52 | 1425 | 1363 | 276.0 |
| B | 5 | 225 | 3531 | 7.86 | 1425 | 1363 | 276.0 |
| C | 12 | 241 | 3946 | 6.95 | 1455 | 1360 | 372.1 |
| C | 2 | 191 | 3825 | 6.62 | 1455 | 1360 | 372.1 |
| C | 3 | 126 | 3652 | 6.16 | 1455 | 1360 | 372.1 |
| D | 6 | 231 | 3308 | 6.1 | 1308 | 1190 | 347.1 |
| D | 3 | 14 | 3288 | 6.04 | 1308 | 1190 | 347.1 |
| D | 10 | 189 | 3232 | 5.88 | 1308 | 1190 | 347.1 |
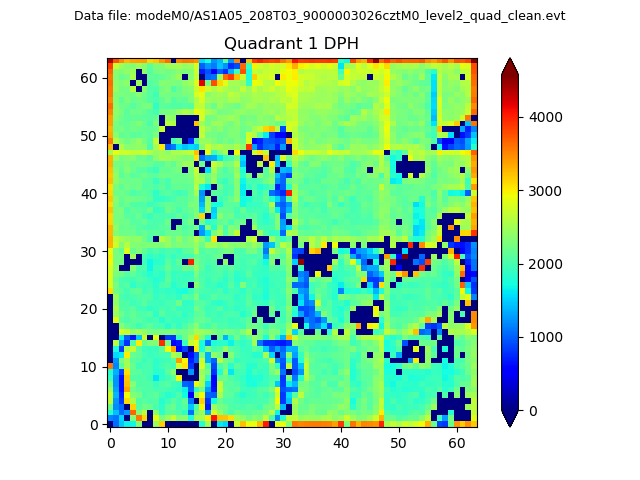
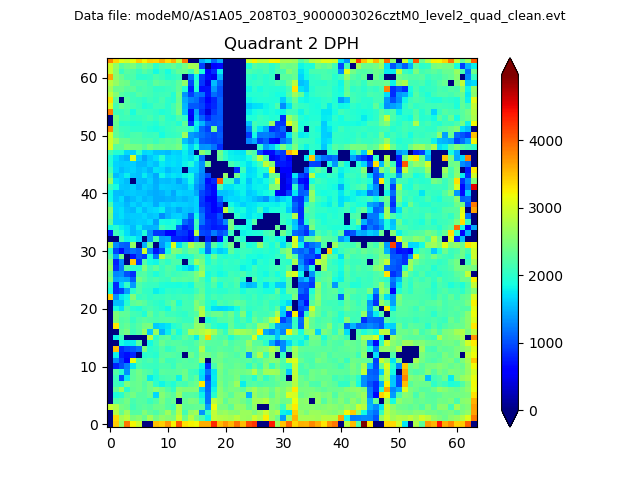
Histogram calculated using DETX and DETY for each event in the final _common_clean file
| Quadrant A |  |
 |
Quadrant B |
|---|---|---|---|
| Quadrant D | 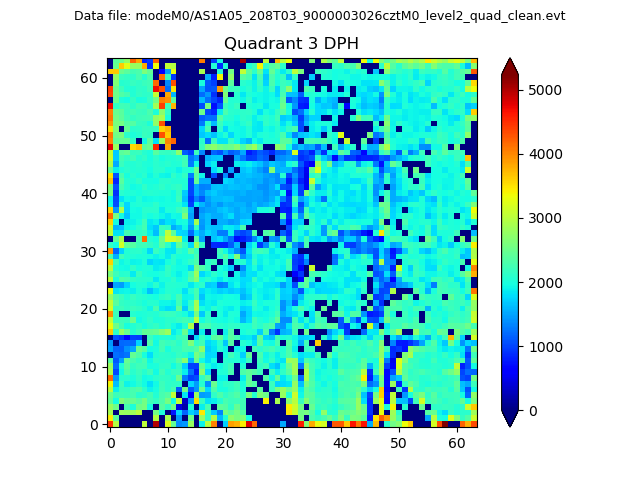 |
 |
Quadrant C |
| Plot type | Count rate plots | Images |
|---|---|---|
| Comparison with Poisson distribution Blue bars denote a histogram of data divided into 1 sec bins. Red curve is a Poisson curve with rate = median count rate of data. |
 |
 |
| Quadrant-wise count rates Data is divided into 100 sec bins |
 |
|
| Module-wise count rates for Quadrant A Data is divided into 100 sec bins |
 |
 |
| Module-wise count rates for Quadrant B Data is divided into 100 sec bins |
 |
 |
| Module-wise count rates for Quadrant C Data is divided into 100 sec bins |
 |
 |
| Module-wise count rates for Quadrant D Data is divided into 100 sec bins |
 |
 |
| Parameter | Plot |
|---|---|
| CZT HV Monitor |  |
| D_VDD | 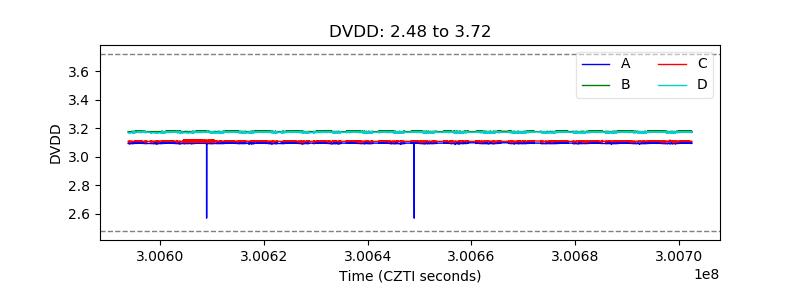 |
| Temperature 1 |  |
| Veto HV Monitor |  |
| Veto LLD | 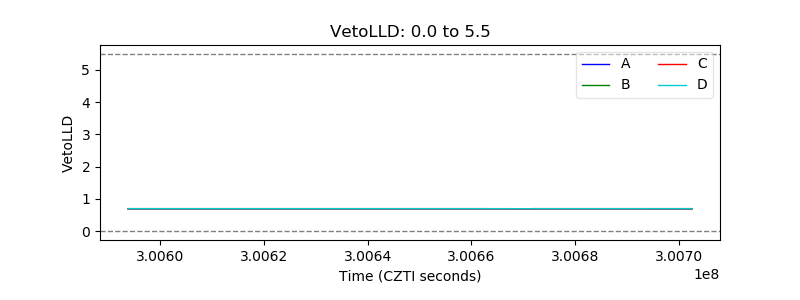 |
| Alpha Counter | 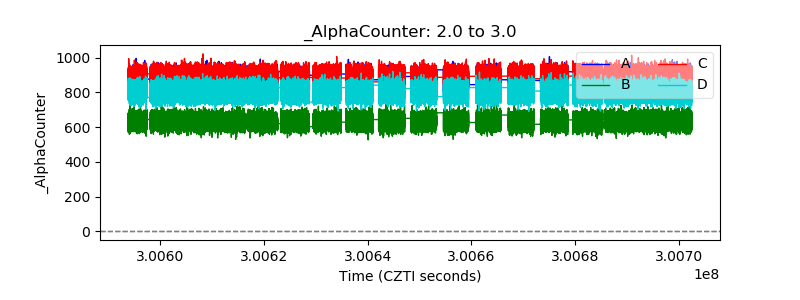 |
| _CPM_Rate |  |
| CZT Counter | 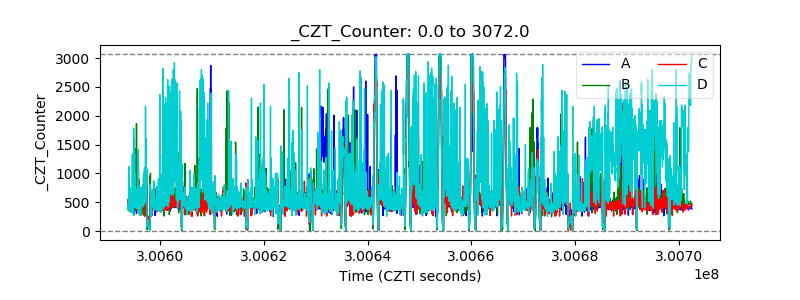 |
| +2.5 Volts monitor |  |
| +5 Volts monitor |  |
| _ROLL_ROT |  |
| _Roll_DEC |  |
| _Roll_RA |  |
| Veto Counter | 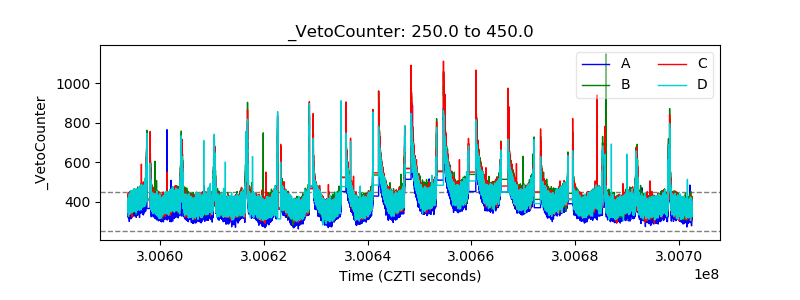 |