| Param | Original file | Final file |
|---|---|---|
| Filename | modeM0/AS1A05_208T03_9000003026_20470cztM0_level2.evt | modeM0/AS1A05_208T03_9000003026_20470cztM0_level2_quad_clean.evt |
| Size (bytes) | 369,803,520 | 67,835,520 |
| Size | 352.7 MB | 64.7 MB |
| Events in quadrant A | 2,466,413 | 429,077 |
| Events in quadrant B | 2,774,271 | 432,056 |
| Events in quadrant C | 2,486,385 | 420,088 |
| Events in quadrant D | 3,118,252 | 408,163 |
| Mode M0 | |||
|---|---|---|---|
| Quadrant | BADHDUFLAG | Total packets | Discarded packets |
| A | 0 | 10701 | 2 |
| B | 0 | 11491 | 1 |
| C | 0 | 10705 | 1 |
| D | 0 | 12651 | 1 |
| Mode SS | |||
|---|---|---|---|
| Quadrant | BADHDUFLAG | Total packets | Discarded packets |
| A | 0 | 108 | 0 |
| B | 0 | 108 | 0 |
| C | 0 | 108 | 0 |
| D | 0 | 108 | 0 |
| Mode M9 | |||
|---|---|---|---|
| Quadrant | BADHDUFLAG | Total packets | Discarded packets |
| A | 0 | 6 | 0 |
| B | 0 | 6 | 0 |
| C | 0 | 6 | 0 |
| D | 0 | 6 | 0 |
| Quadrant | Total seconds | Saturated seconds | Saturation percentage |
|---|---|---|---|
| A | 5198 | 77 | 1.481339% |
| B | 5198 | 121 | 2.327818% |
| C | 5198 | 99 | 1.904579% |
| D | 5198 | 127 | 2.443247% |
Noise dominated data is calculated using 1-second bins in cleaned event files. If a bin has >2000 counts, and if more than 50% of those come from <1% of pixels, then it is considered to be noise-dominated and hence unusable.
| Quadrant | # 1 sec bins | Bins with >0 counts | Bins with >2000 counts | High rate bins dominated by noise | Noise dominated (total time) | Noise dominated (detector-on time) | Marked lightcurve |
|---|---|---|---|---|---|---|---|
| A | 5838 | 5198 | 2 | 2 | 0.03% | 0.04% | 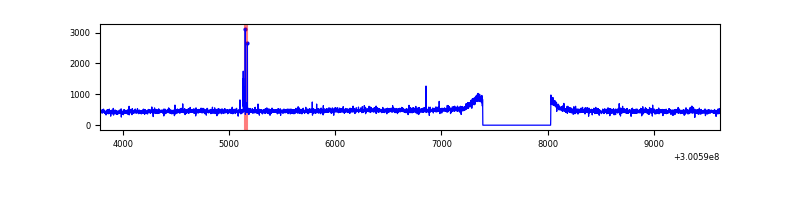 |
| B | 5838 | 5198 | 17 | 17 | 0.29% | 0.33% | 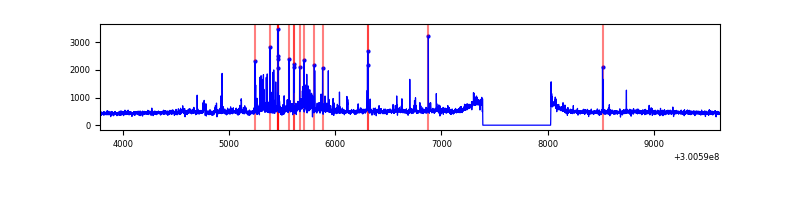 |
| C | 5838 | 5198 | 0 | 0 | 0.00% | 0.00% | 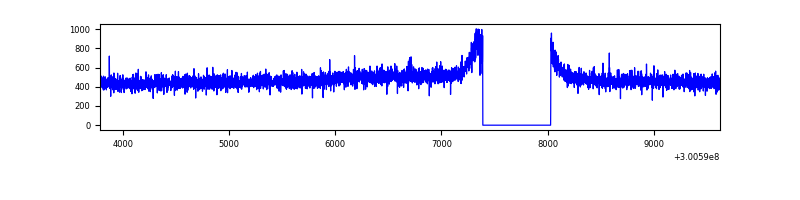 |
| D | 5838 | 5198 | 54 | 54 | 0.92% | 1.04% | 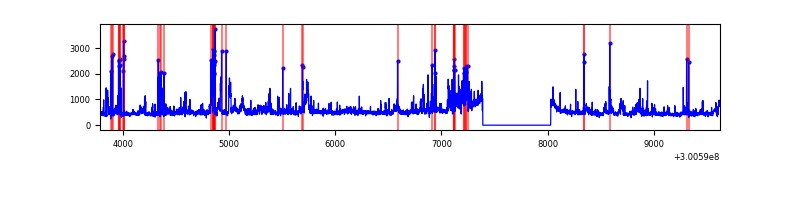 |
Top three noisy pixels from each quadrant. If the there are fewer than three noisy pixels in the level2.evt file, extra rows are filled as -1
| Pixel properties | Quadrant properties | ||||||
|---|---|---|---|---|---|---|---|
| Quadrant | DetID | PixID | Counts | Sigma | Mean | Median | Sigma |
| A | 9 | 143 | 17552 | 132.02 | 633 | 618 | 128.3 |
| A | 13 | 254 | 6846 | 48.55 | 633 | 618 | 128.3 |
| A | 0 | 226 | 5492 | 38.0 | 633 | 618 | 128.3 |
| B | 7 | 220 | 131242 | 1074.04 | 631 | 613 | 121.6 |
| B | 0 | 189 | 83222 | 679.21 | 631 | 613 | 121.6 |
| B | 0 | 197 | 17379 | 137.85 | 631 | 613 | 121.6 |
| C | 14 | 238 | 94505 | 655.34 | 611 | 616 | 143.3 |
| C | 9 | 221 | 7949 | 51.18 | 611 | 616 | 143.3 |
| C | 13 | 61 | 4286 | 25.62 | 611 | 616 | 143.3 |
| D | 1 | 52 | 549878 | 3637.68 | 618 | 600 | 151.0 |
| D | 5 | 222 | 114815 | 756.41 | 618 | 600 | 151.0 |
| D | 15 | 0 | 58037 | 380.39 | 618 | 600 | 151.0 |
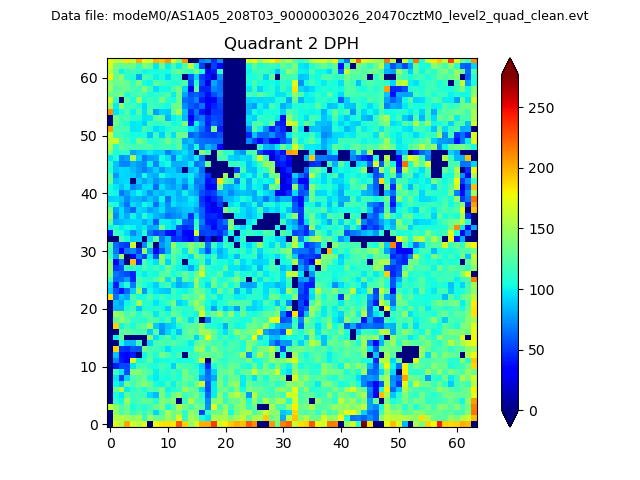
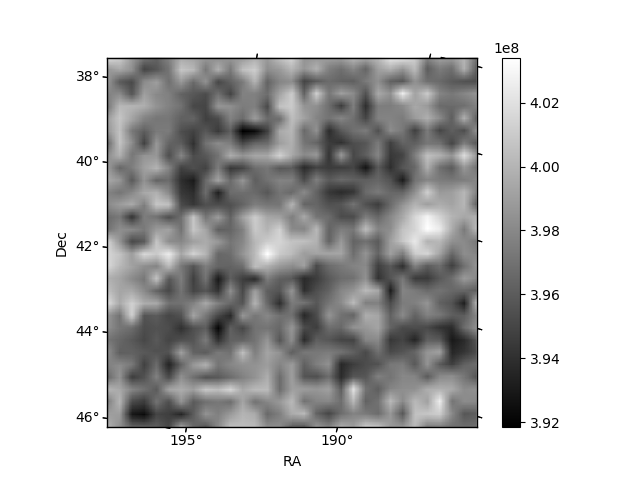
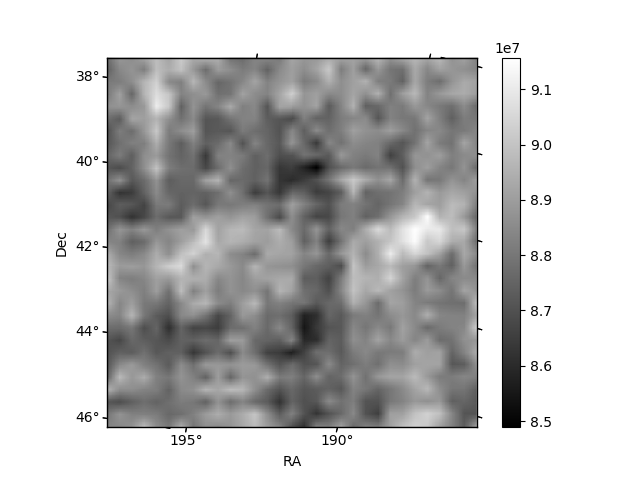
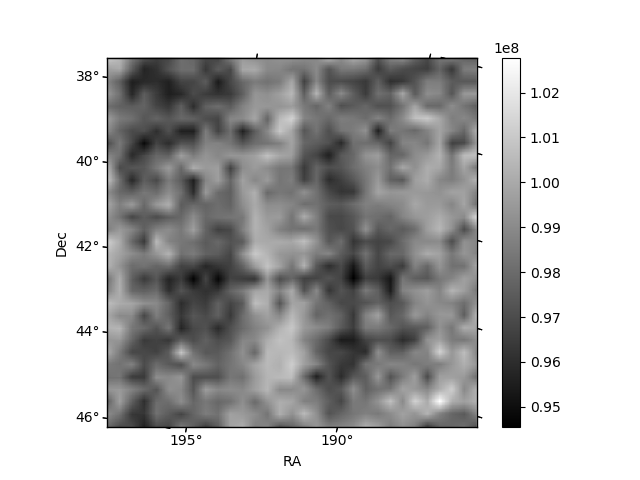
Histogram calculated using DETX and DETY for each event in the final _common_clean file
| Quadrant A | 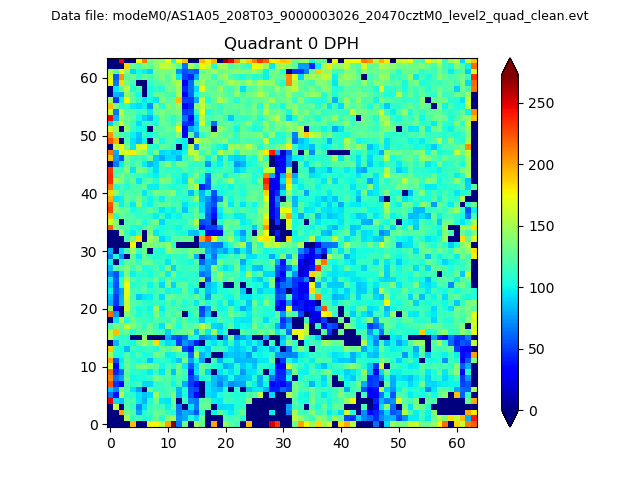 |
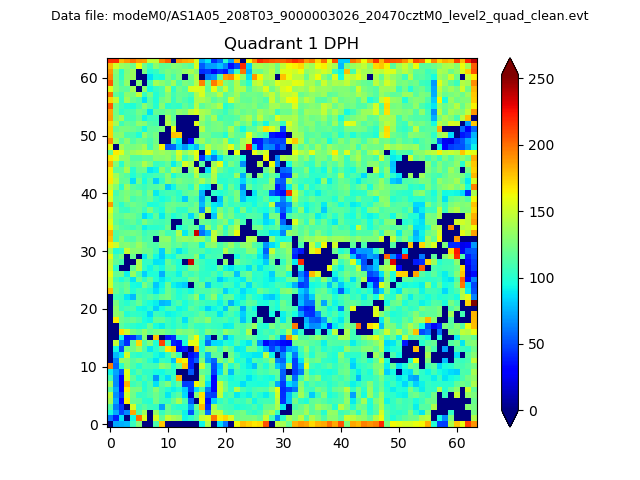 |
Quadrant B |
|---|---|---|---|
| Quadrant D | 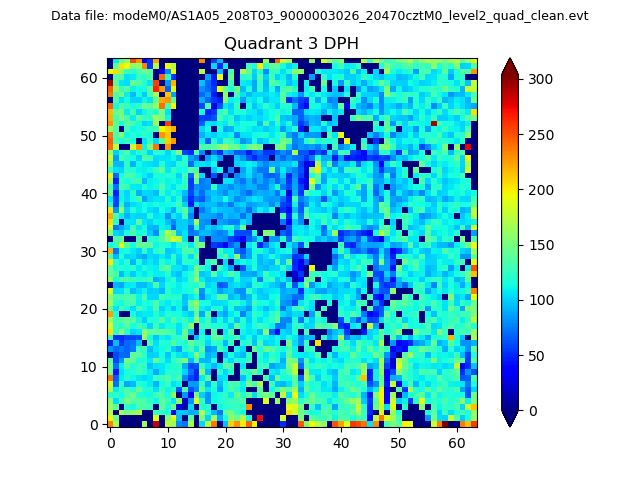 |
 |
Quadrant C |
| Plot type | Count rate plots | Images |
|---|---|---|
| Comparison with Poisson distribution Blue bars denote a histogram of data divided into 1 sec bins. Red curve is a Poisson curve with rate = median count rate of data. |
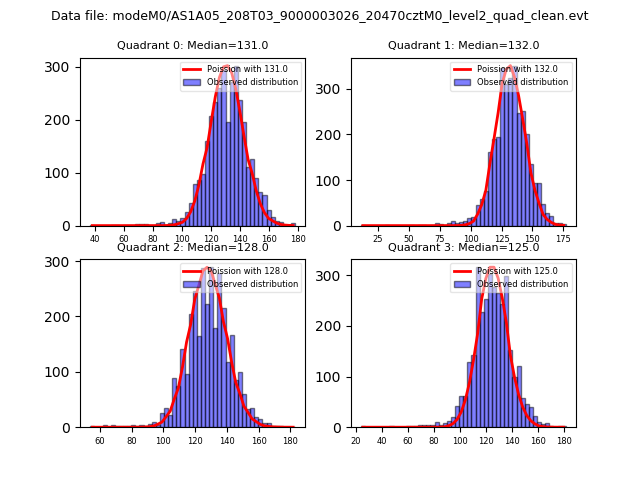 |
 |
| Quadrant-wise count rates Data is divided into 100 sec bins |
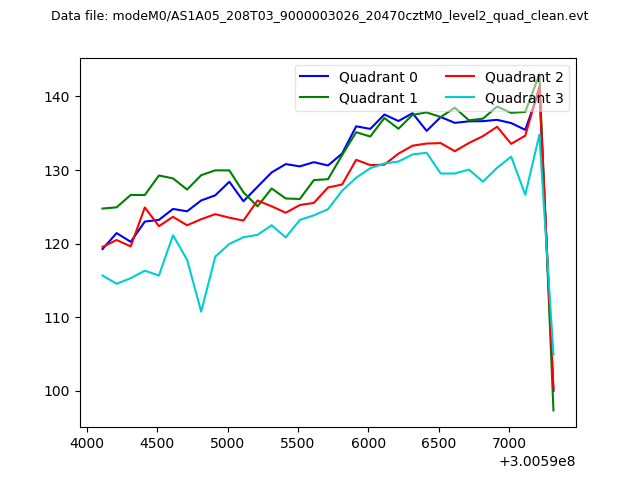 |
|
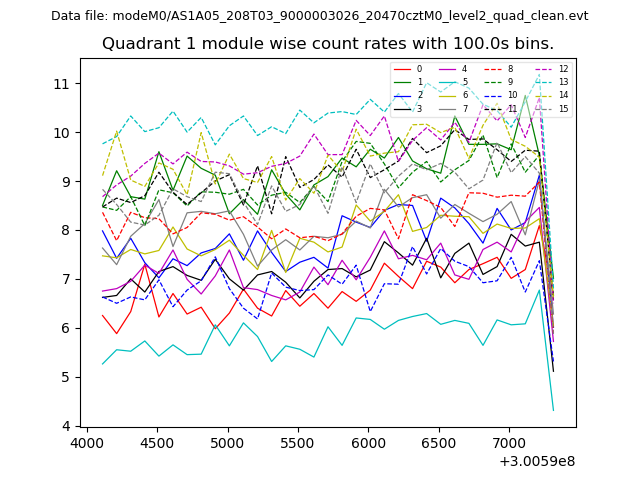
| Module-wise count rates for Quadrant A Data is divided into 100 sec bins |
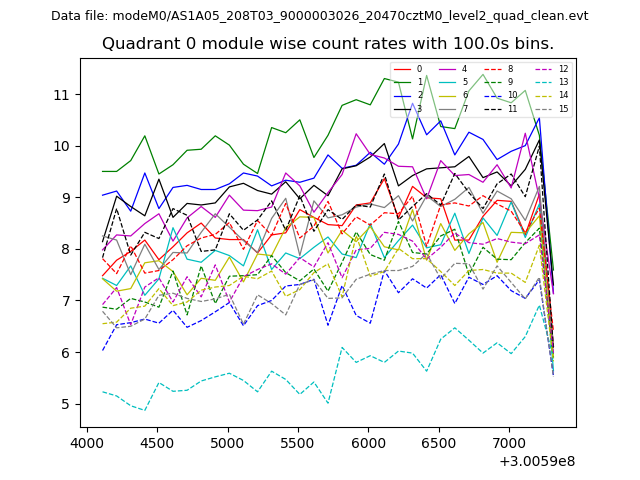 |
 |
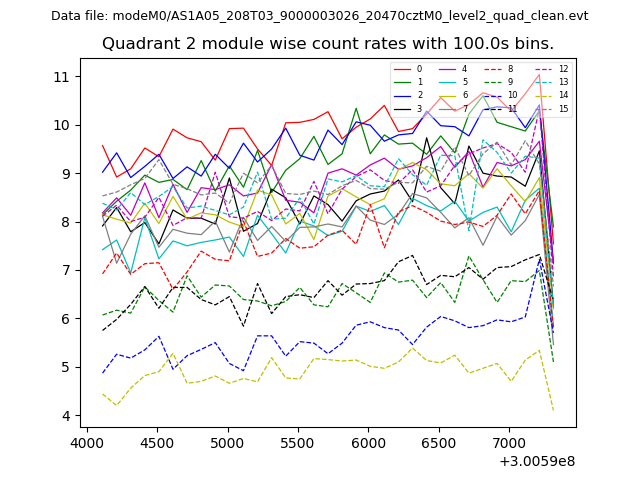
| Module-wise count rates for Quadrant B Data is divided into 100 sec bins |
 |
 |
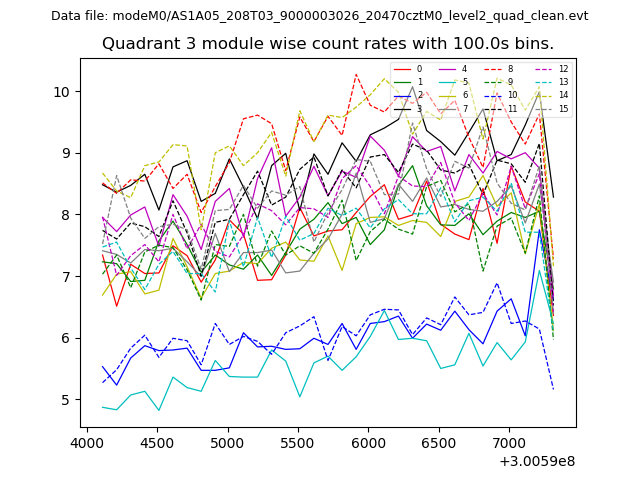
| Module-wise count rates for Quadrant C Data is divided into 100 sec bins |
 |
 |
| Module-wise count rates for Quadrant D Data is divided into 100 sec bins |
 |
 |
| Parameter | Plot |
|---|---|
| CZT HV Monitor | 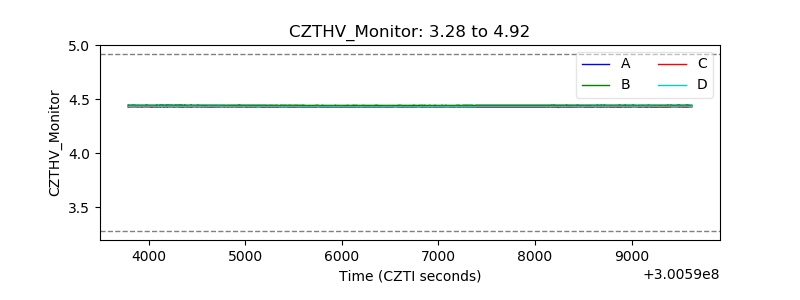 |
| D_VDD | 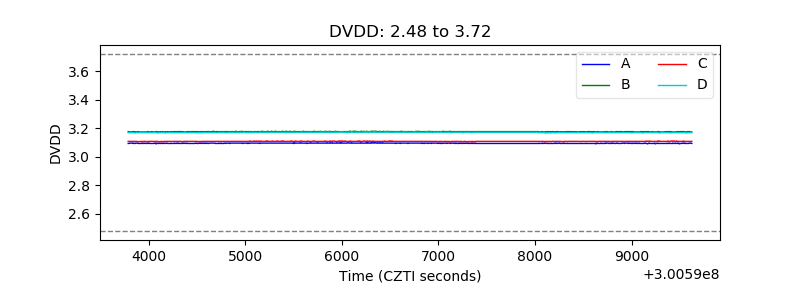 |
| Temperature 1 | 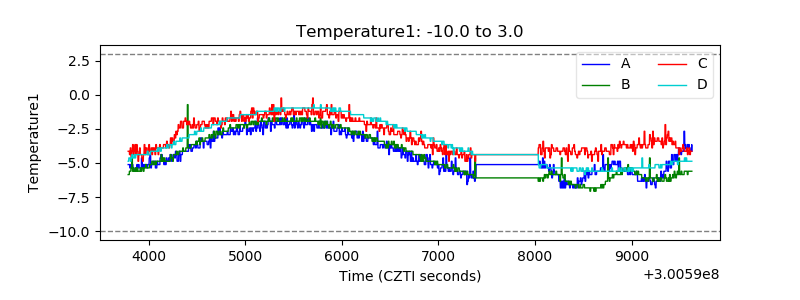 |
| Veto HV Monitor | 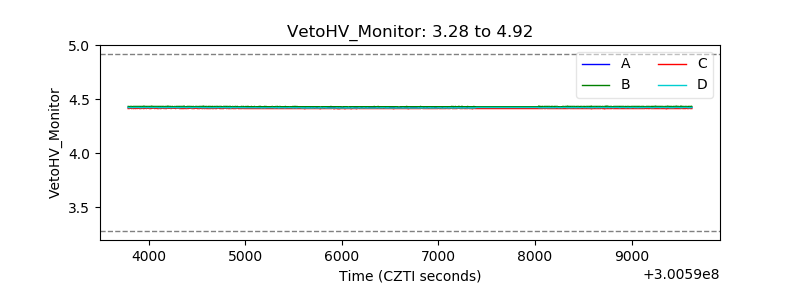 |
| Veto LLD | 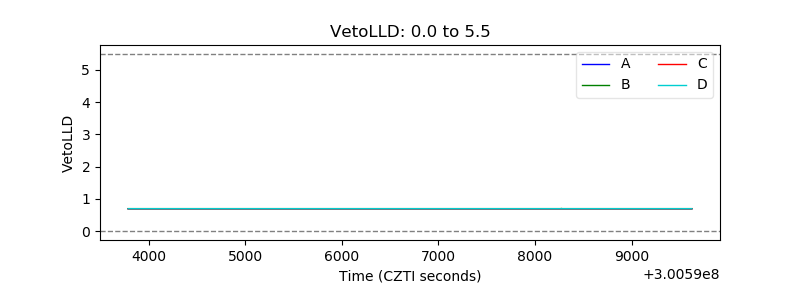 |
| Alpha Counter | 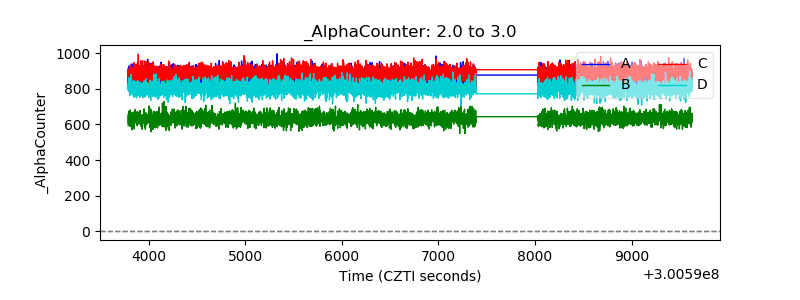 |
| _CPM_Rate | 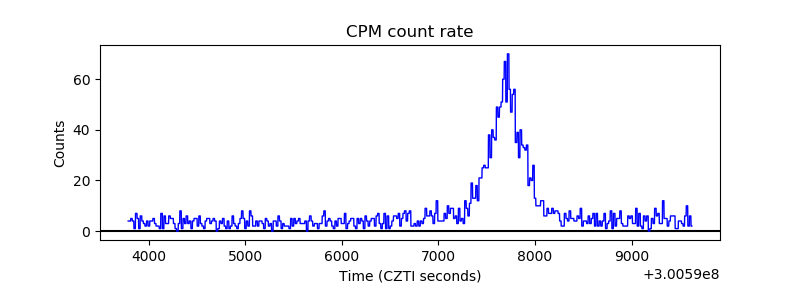 |
| CZT Counter | 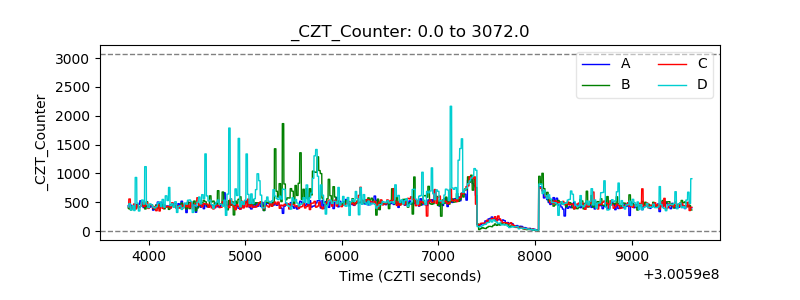 |
| +2.5 Volts monitor |  |
| +5 Volts monitor | 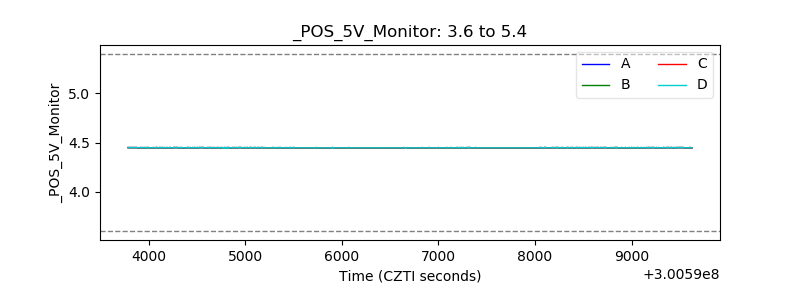 |
| _ROLL_ROT | 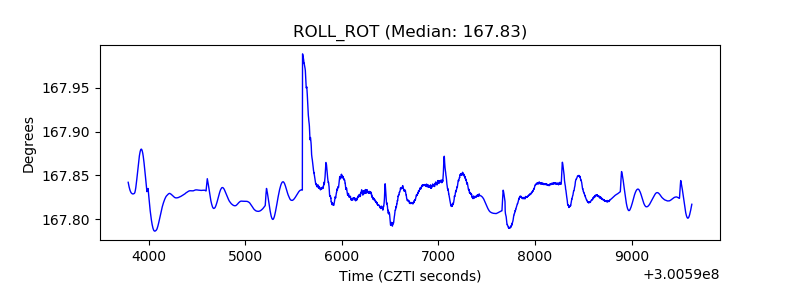 |
| _Roll_DEC | 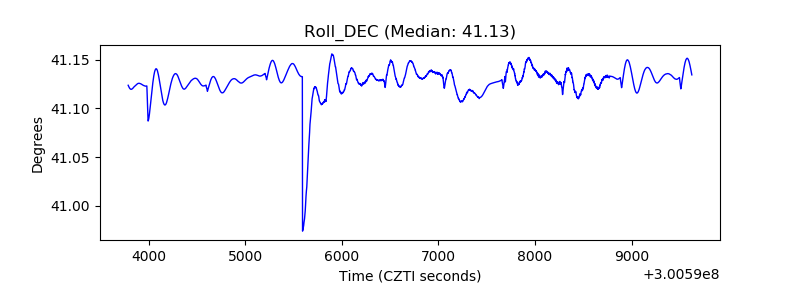 |
| _Roll_RA | 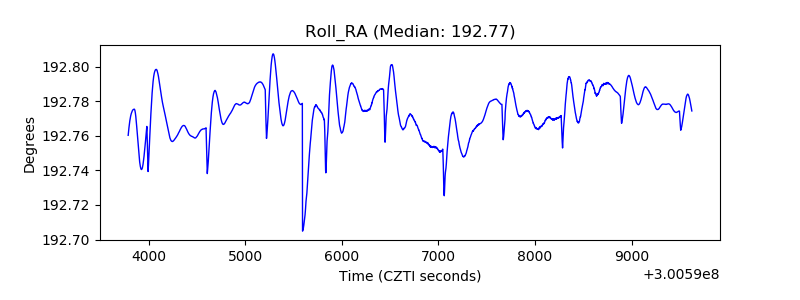 |
| Veto Counter | 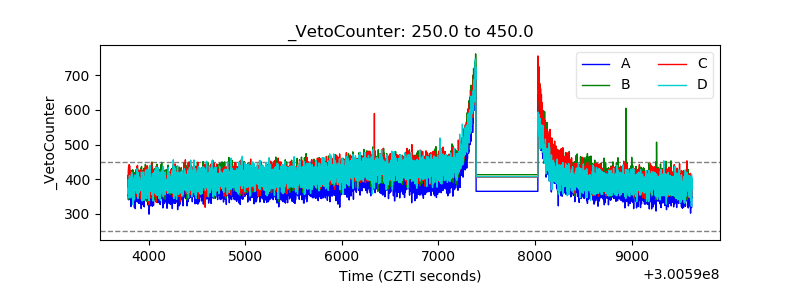 |