| Param | Original file | Final file |
|---|---|---|
| Filename | modeM0/AS1A05_208T03_9000003026_20471cztM0_level2.evt | modeM0/AS1A05_208T03_9000003026_20471cztM0_level2_quad_clean.evt |
| Size (bytes) | 574,289,280 | 79,254,720 |
| Size | 547.7 MB | 75.6 MB |
| Events in quadrant A | 3,373,957 | 493,497 |
| Events in quadrant B | 3,875,331 | 495,475 |
| Events in quadrant C | 3,449,211 | 480,098 |
| Events in quadrant D | 6,202,010 | 425,754 |
| Mode M0 | |||
|---|---|---|---|
| Quadrant | BADHDUFLAG | Total packets | Discarded packets |
| A | 0 | 14926 | 1 |
| B | 0 | 16183 | 1 |
| C | 0 | 14971 | 1 |
| D | 0 | 23440 | 1 |
| Mode SS | |||
|---|---|---|---|
| Quadrant | BADHDUFLAG | Total packets | Discarded packets |
| A | 0 | 146 | 0 |
| B | 0 | 146 | 0 |
| C | 0 | 146 | 0 |
| D | 0 | 146 | 0 |
| Mode M9 | |||
|---|---|---|---|
| Quadrant | BADHDUFLAG | Total packets | Discarded packets |
| A | 0 | 2 | 0 |
| B | 0 | 2 | 0 |
| C | 0 | 2 | 0 |
| D | 0 | 2 | 0 |
| Quadrant | Total seconds | Saturated seconds | Saturation percentage |
|---|---|---|---|
| A | 7251 | 181 | 2.496207% |
| B | 7252 | 240 | 3.309432% |
| C | 7252 | 220 | 3.033646% |
| D | 7252 | 885 | 12.203530% |
Noise dominated data is calculated using 1-second bins in cleaned event files. If a bin has >2000 counts, and if more than 50% of those come from <1% of pixels, then it is considered to be noise-dominated and hence unusable.
| Quadrant | # 1 sec bins | Bins with >0 counts | Bins with >2000 counts | High rate bins dominated by noise | Noise dominated (total time) | Noise dominated (detector-on time) | Marked lightcurve |
|---|---|---|---|---|---|---|---|
| A | 7406 | 7251 | 1 | 1 | 0.01% | 0.01% | 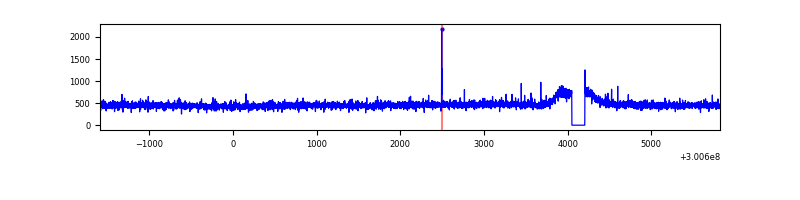 |
| B | 7407 | 7252 | 7 | 7 | 0.09% | 0.10% | 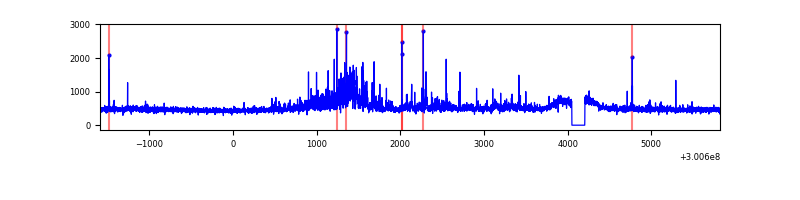 |
| C | 7407 | 7252 | 0 | 0 | 0.00% | 0.00% | 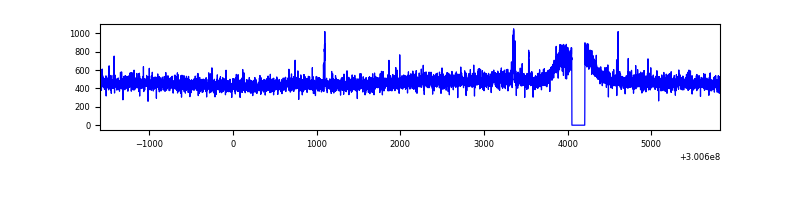 |
| D | 7407 | 7252 | 605 | 605 | 8.17% | 8.34% | 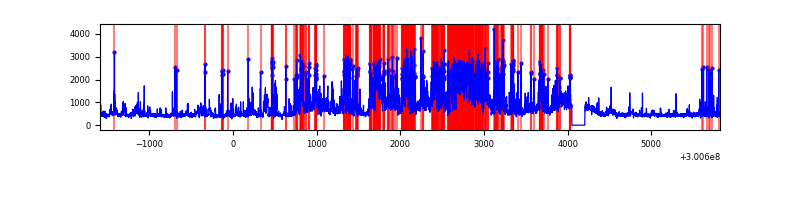 |
Top three noisy pixels from each quadrant. If the there are fewer than three noisy pixels in the level2.evt file, extra rows are filled as -1
| Pixel properties | Quadrant properties | ||||||
|---|---|---|---|---|---|---|---|
| Quadrant | DetID | PixID | Counts | Sigma | Mean | Median | Sigma |
| A | 9 | 143 | 18230 | 98.76 | 867 | 845 | 176.0 |
| A | 13 | 254 | 9374 | 48.45 | 867 | 845 | 176.0 |
| A | 8 | 205 | 8965 | 46.13 | 867 | 845 | 176.0 |
| B | 0 | 197 | 145432 | 869.54 | 870 | 848 | 166.3 |
| B | 0 | 189 | 144235 | 862.34 | 870 | 848 | 166.3 |
| B | 7 | 220 | 82469 | 490.88 | 870 | 848 | 166.3 |
| C | 14 | 238 | 128583 | 648.6 | 841 | 844 | 196.9 |
| C | 9 | 221 | 31480 | 155.56 | 841 | 844 | 196.9 |
| C | 3 | 233 | 6181 | 27.1 | 841 | 844 | 196.9 |
| D | 1 | 52 | 1456691 | 7381.07 | 813 | 789 | 197.2 |
| D | 5 | 222 | 1163940 | 5896.89 | 813 | 789 | 197.2 |
| D | 7 | 38 | 172084 | 868.42 | 813 | 789 | 197.2 |
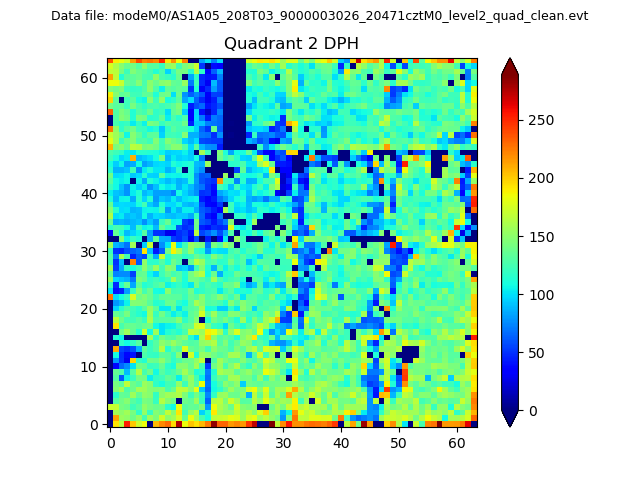
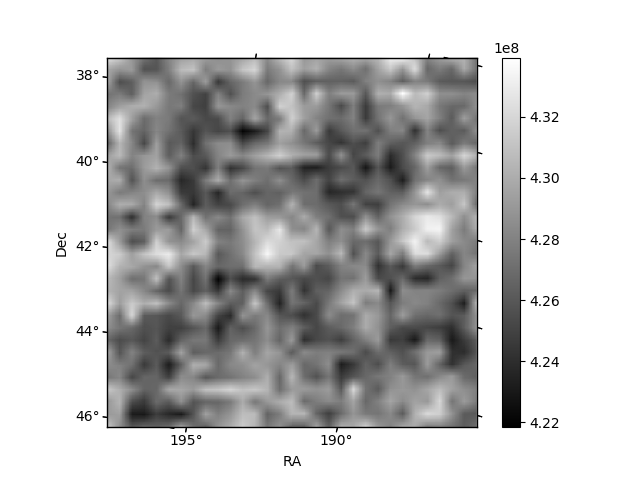
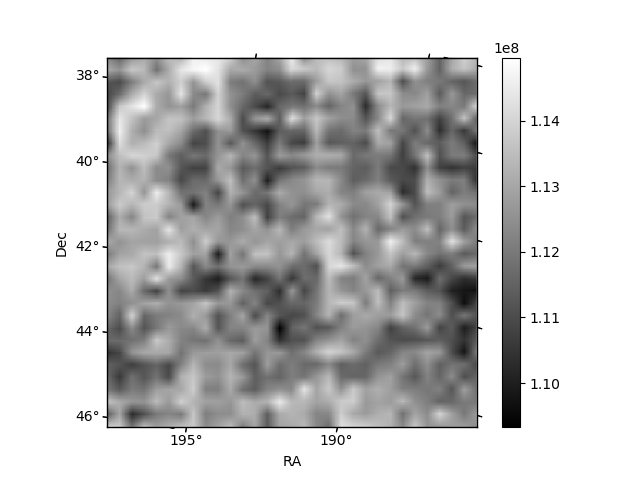
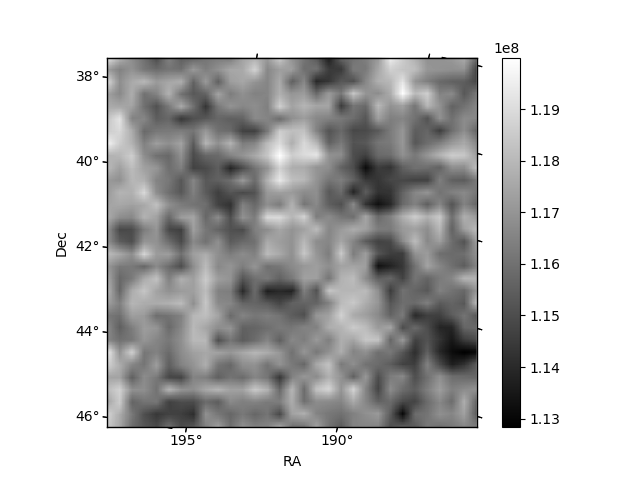
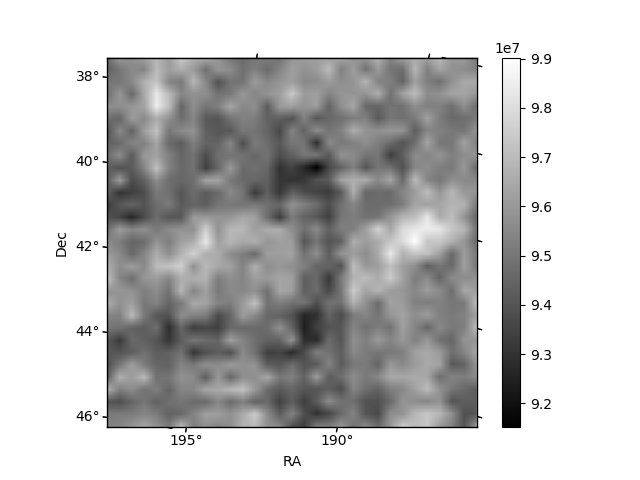
Histogram calculated using DETX and DETY for each event in the final _common_clean file
| Quadrant A | 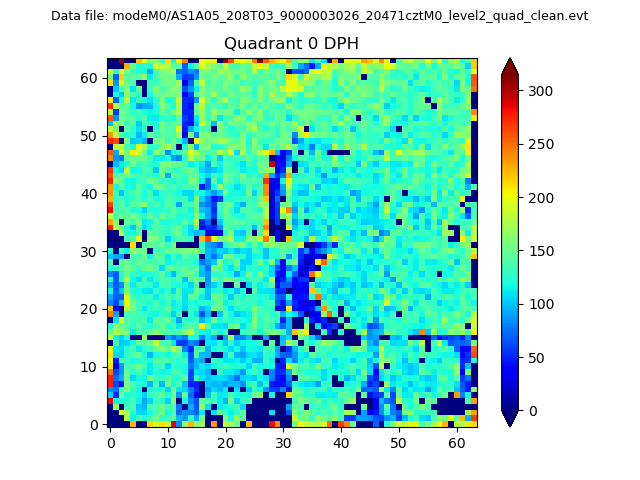 |
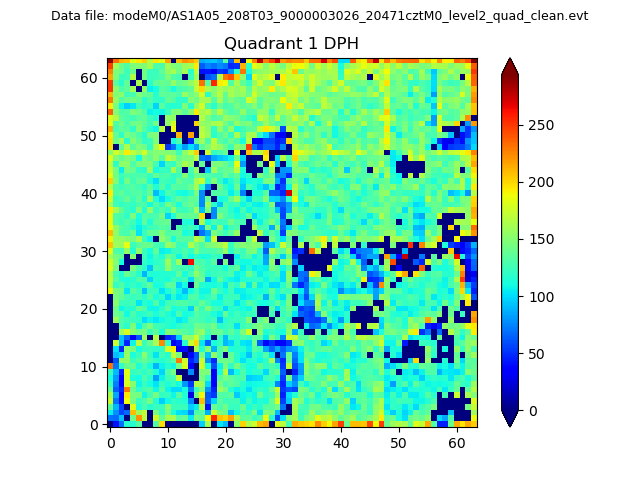 |
Quadrant B |
|---|---|---|---|
| Quadrant D | 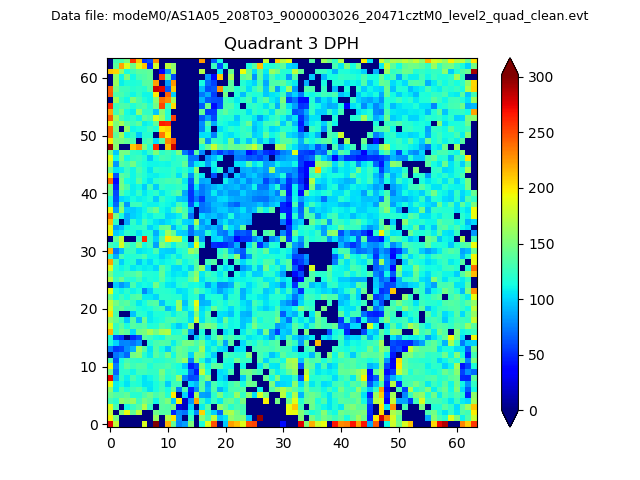 |
 |
Quadrant C |
| Plot type | Count rate plots | Images |
|---|---|---|
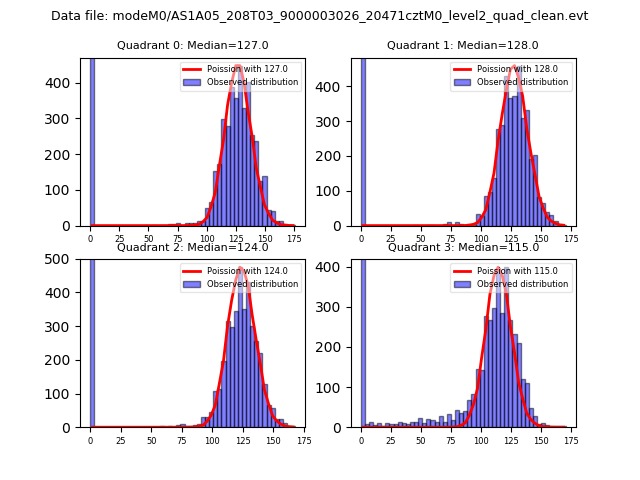
| Comparison with Poisson distribution Blue bars denote a histogram of data divided into 1 sec bins. Red curve is a Poisson curve with rate = median count rate of data. |
 |
 |
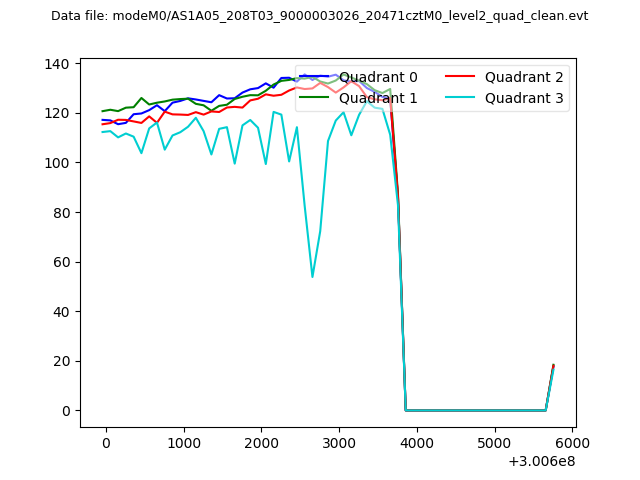
| Quadrant-wise count rates Data is divided into 100 sec bins |
 |
|
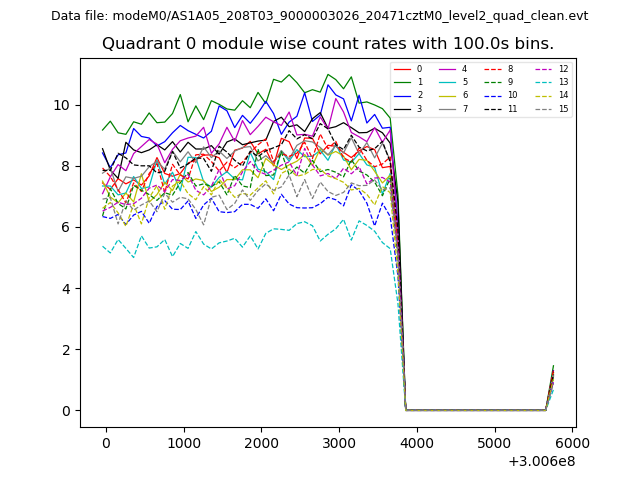
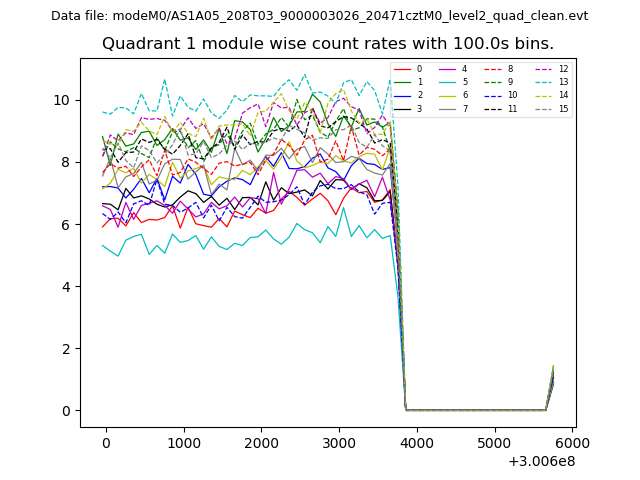
| Module-wise count rates for Quadrant A Data is divided into 100 sec bins |
 |
 |
| Module-wise count rates for Quadrant B Data is divided into 100 sec bins |
 |
 |
| Module-wise count rates for Quadrant C Data is divided into 100 sec bins |
 |
 |
| Module-wise count rates for Quadrant D Data is divided into 100 sec bins |
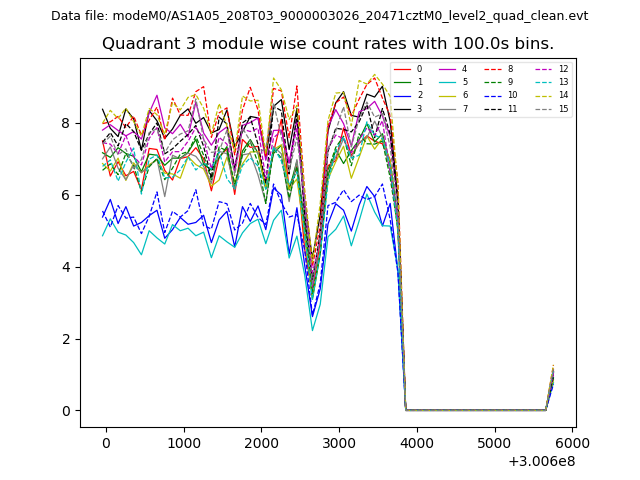 |
 |
| Parameter | Plot |
|---|---|
| CZT HV Monitor |  |
| D_VDD | 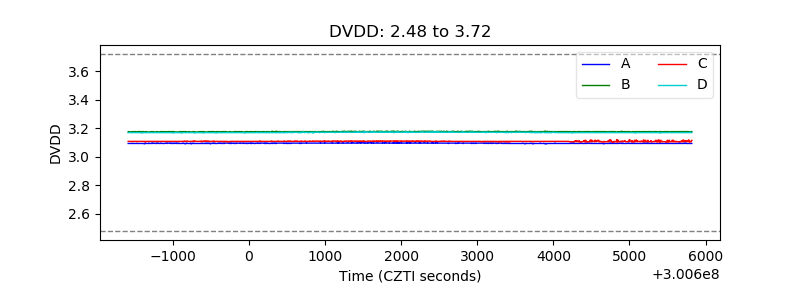 |
| Temperature 1 | 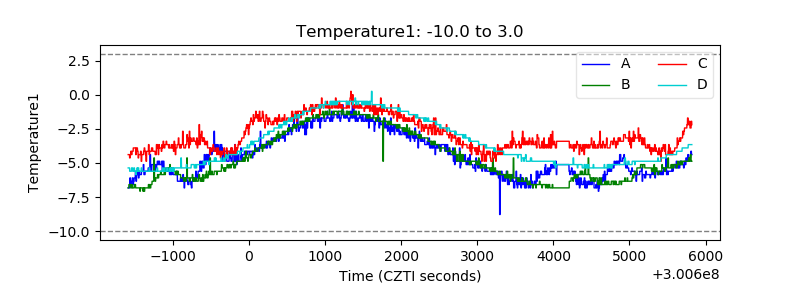 |
| Veto HV Monitor | 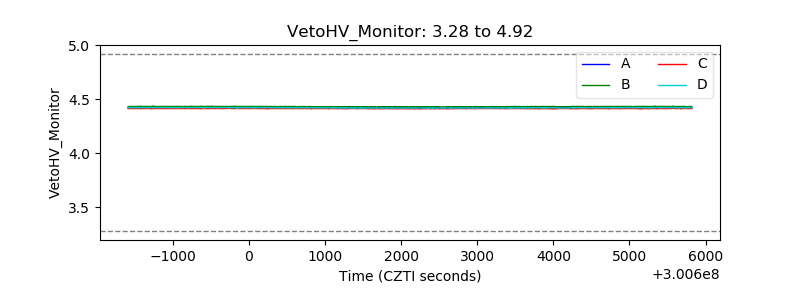 |
| Veto LLD | 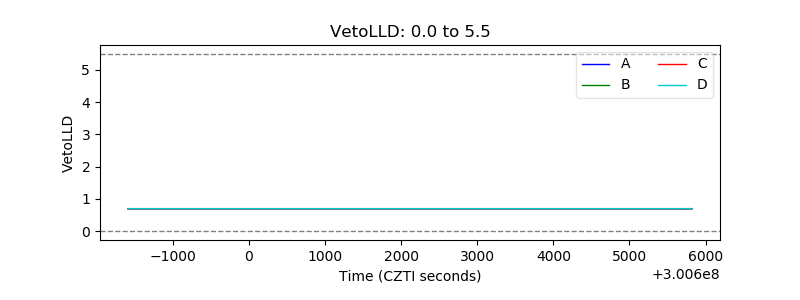 |
| Alpha Counter | 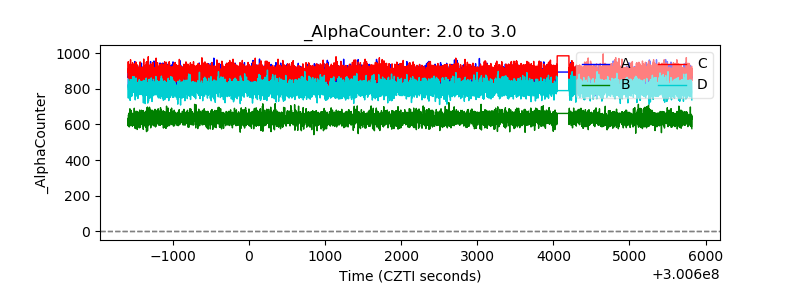 |
| _CPM_Rate | 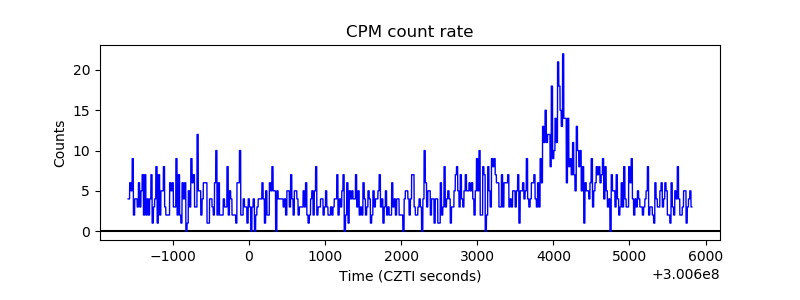 |
| CZT Counter | 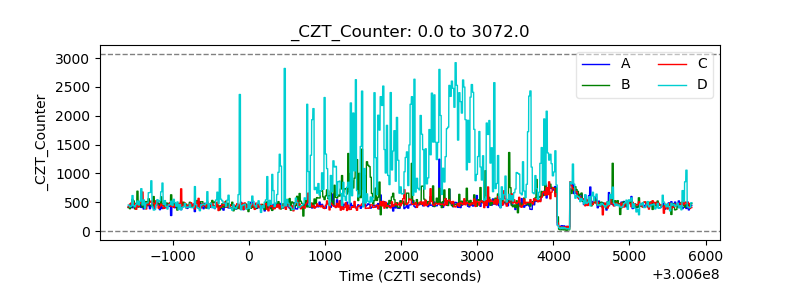 |
| +2.5 Volts monitor | 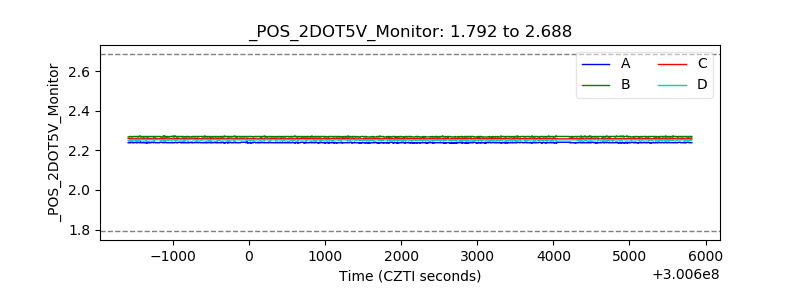 |
| +5 Volts monitor |  |
| _ROLL_ROT | 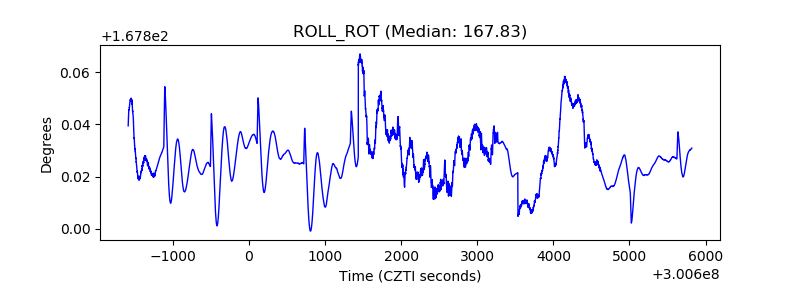 |
| _Roll_DEC | 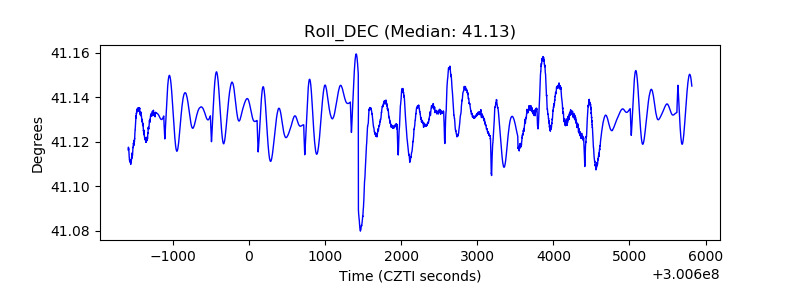 |
| _Roll_RA | 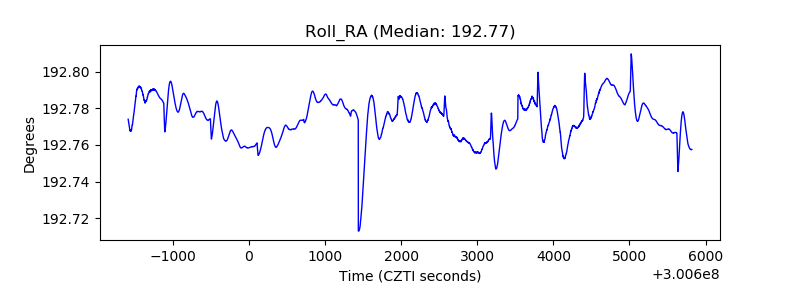 |
| Veto Counter | 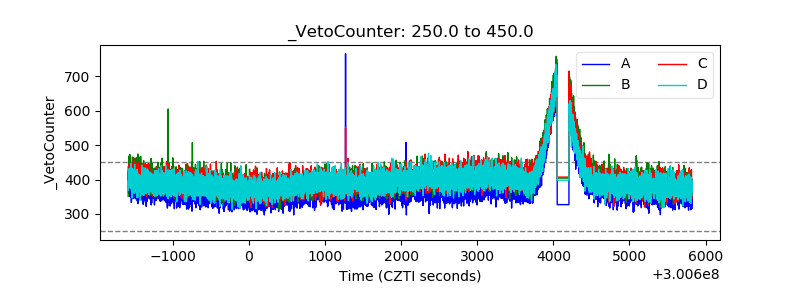 |