| Param | Original file | Final file |
|---|---|---|
| Filename | modeM0/AS1A05_208T03_9000003026_20472cztM0_level2.evt | modeM0/AS1A05_208T03_9000003026_20472cztM0_level2_quad_clean.evt |
| Size (bytes) | 580,343,040 | 86,990,400 |
| Size | 553.5 MB | 83.0 MB |
| Events in quadrant A | 3,934,466 | 540,384 |
| Events in quadrant B | 3,950,069 | 549,569 |
| Events in quadrant C | 3,555,772 | 529,780 |
| Events in quadrant D | 5,622,743 | 488,889 |
| Mode M0 | |||
|---|---|---|---|
| Quadrant | BADHDUFLAG | Total packets | Discarded packets |
| A | 0 | 16819 | 1 |
| B | 0 | 16506 | 1 |
| C | 0 | 15477 | 1 |
| D | 0 | 21856 | 1 |
| Mode SS | |||
|---|---|---|---|
| Quadrant | BADHDUFLAG | Total packets | Discarded packets |
| A | 0 | 152 | 0 |
| B | 0 | 152 | 0 |
| C | 0 | 152 | 0 |
| D | 0 | 152 | 0 |
| Mode M9 | |||
|---|---|---|---|
| Quadrant | BADHDUFLAG | Total packets | Discarded packets |
| A | 0 | 1 | 0 |
| B | 0 | 1 | 0 |
| C | 0 | 1 | 0 |
| D | 0 | 1 | 0 |
| Quadrant | Total seconds | Saturated seconds | Saturation percentage |
|---|---|---|---|
| A | 7555 | 359 | 4.751820% |
| B | 7556 | 247 | 3.268925% |
| C | 7556 | 211 | 2.792483% |
| D | 7555 | 673 | 8.908008% |
Noise dominated data is calculated using 1-second bins in cleaned event files. If a bin has >2000 counts, and if more than 50% of those come from <1% of pixels, then it is considered to be noise-dominated and hence unusable.
| Quadrant | # 1 sec bins | Bins with >0 counts | Bins with >2000 counts | High rate bins dominated by noise | Noise dominated (total time) | Noise dominated (detector-on time) | Marked lightcurve |
|---|---|---|---|---|---|---|---|
| A | 7635 | 7555 | 140 | 140 | 1.83% | 1.85% | 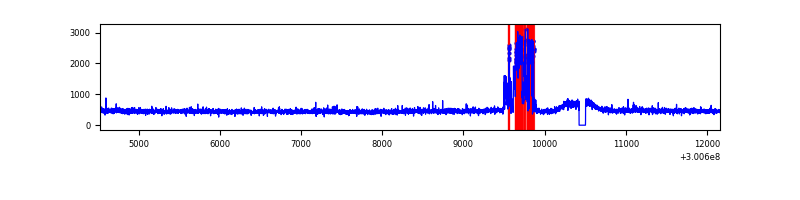 |
| B | 7636 | 7556 | 11 | 11 | 0.14% | 0.15% | 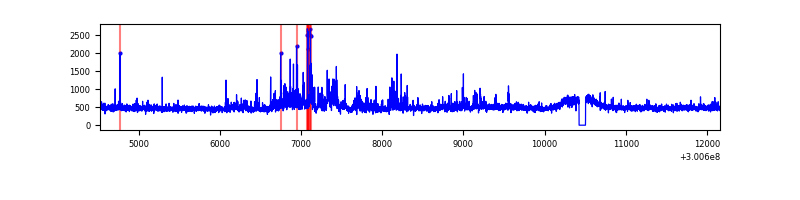 |
| C | 7636 | 7556 | 0 | 0 | 0.00% | 0.00% | 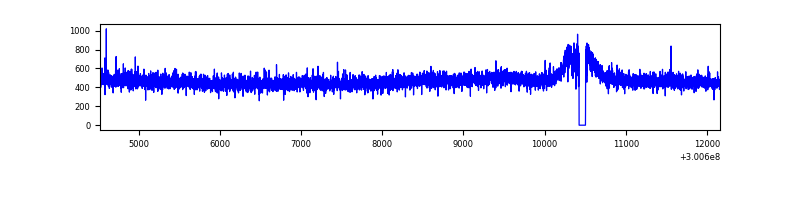 |
| D | 7635 | 7555 | 509 | 509 | 6.67% | 6.74% | 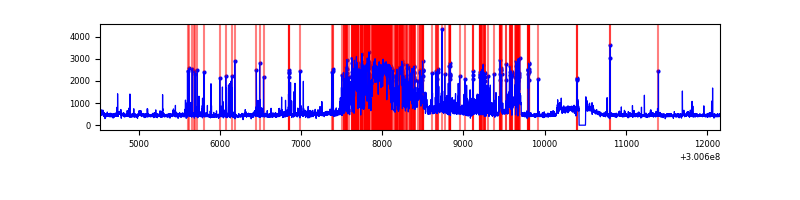 |
Top three noisy pixels from each quadrant. If the there are fewer than three noisy pixels in the level2.evt file, extra rows are filled as -1
| Pixel properties | Quadrant properties | ||||||
|---|---|---|---|---|---|---|---|
| Quadrant | DetID | PixID | Counts | Sigma | Mean | Median | Sigma |
| A | 9 | 143 | 482809 | 2665.61 | 893 | 873 | 180.8 |
| A | 13 | 254 | 9550 | 47.99 | 893 | 873 | 180.8 |
| A | 0 | 226 | 7911 | 38.93 | 893 | 873 | 180.8 |
| B | 0 | 189 | 169479 | 965.04 | 904 | 882 | 174.7 |
| B | 7 | 220 | 61132 | 344.87 | 904 | 882 | 174.7 |
| B | 0 | 197 | 54211 | 305.25 | 904 | 882 | 174.7 |
| C | 14 | 238 | 136752 | 670.12 | 869 | 872 | 202.8 |
| C | 8 | 128 | 11003 | 49.96 | 869 | 872 | 202.8 |
| C | 9 | 221 | 6860 | 29.53 | 869 | 872 | 202.8 |
| D | 1 | 52 | 823963 | 3895.7 | 860 | 833 | 211.3 |
| D | 7 | 38 | 505125 | 2386.71 | 860 | 833 | 211.3 |
| D | 15 | 0 | 449266 | 2122.34 | 860 | 833 | 211.3 |
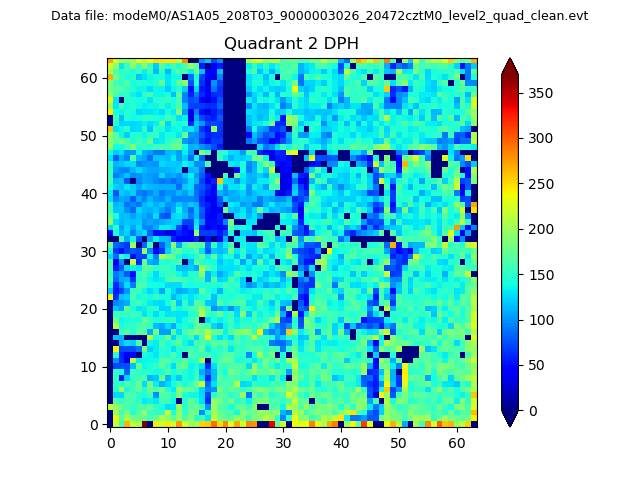
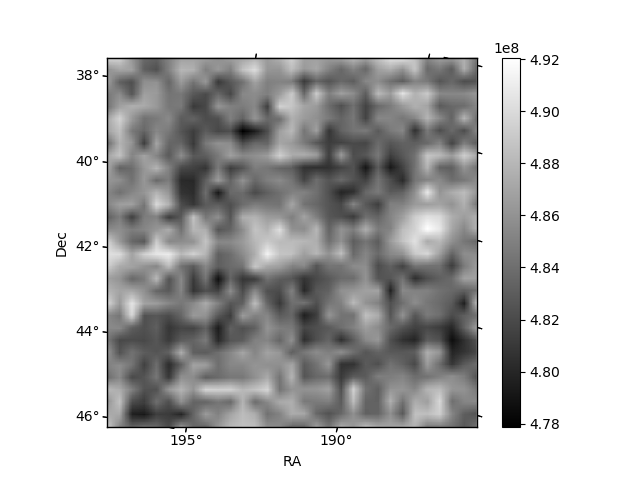
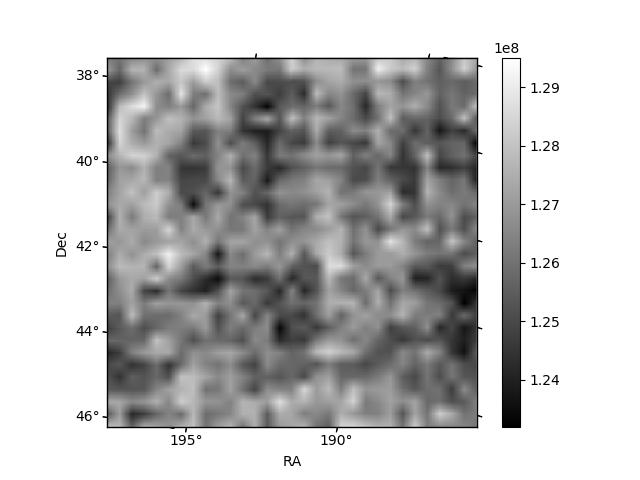
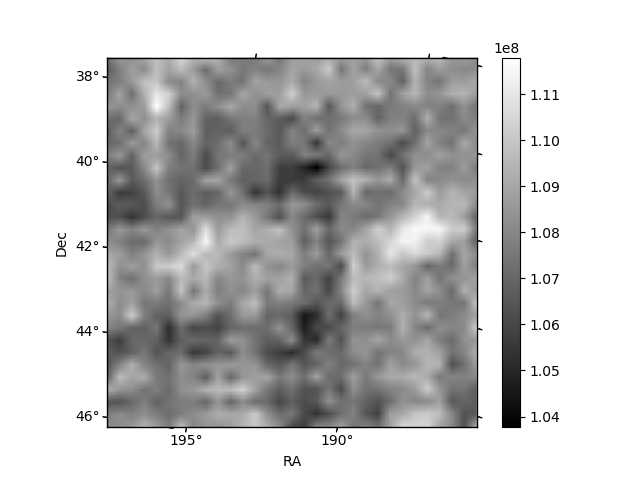
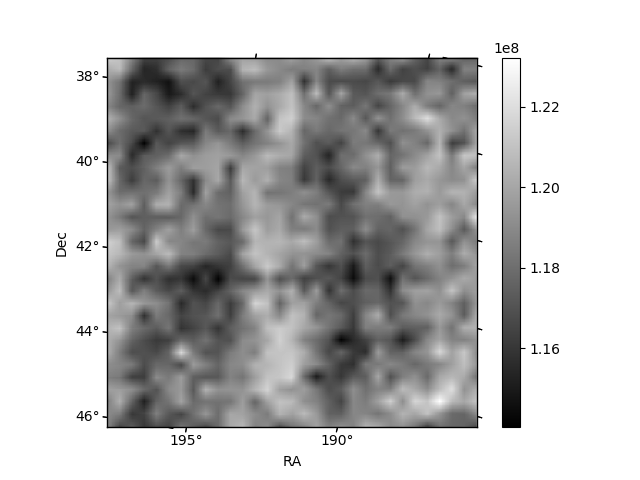
Histogram calculated using DETX and DETY for each event in the final _common_clean file
| Quadrant A | 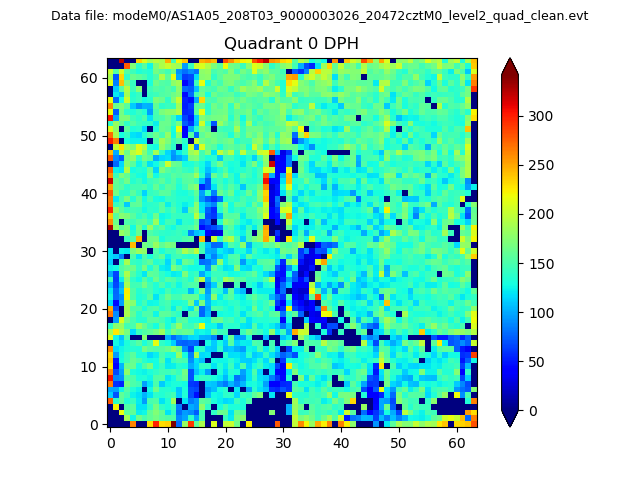 |
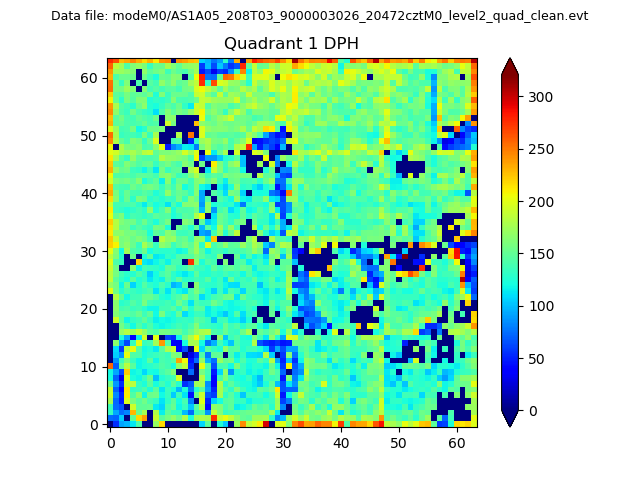 |
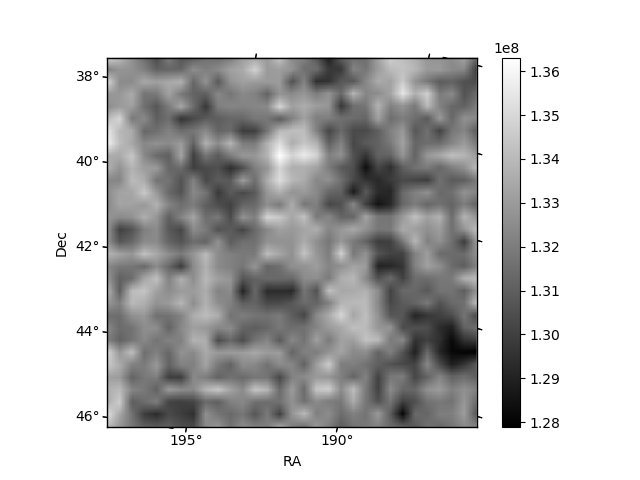
Quadrant B |
|---|---|---|---|
| Quadrant D | 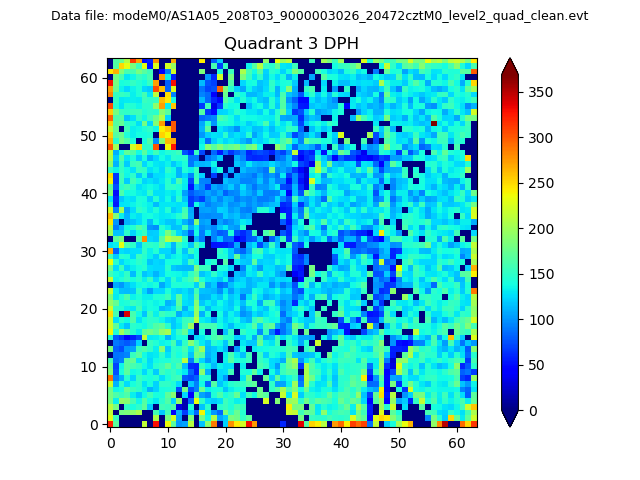 |
 |
Quadrant C |
| Plot type | Count rate plots | Images |
|---|---|---|
| Comparison with Poisson distribution Blue bars denote a histogram of data divided into 1 sec bins. Red curve is a Poisson curve with rate = median count rate of data. |
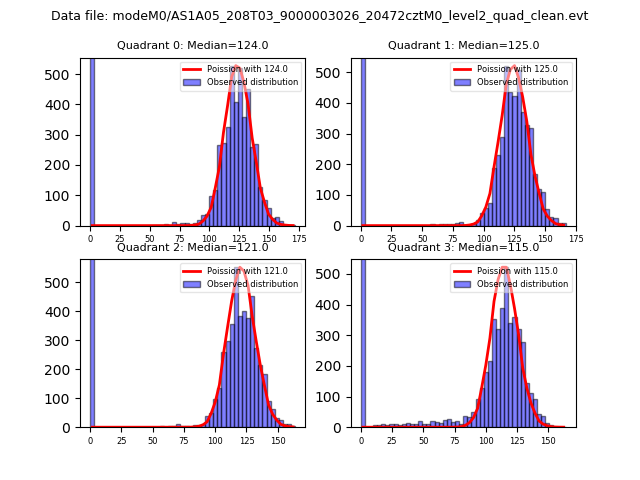 |
 |
| Quadrant-wise count rates Data is divided into 100 sec bins |
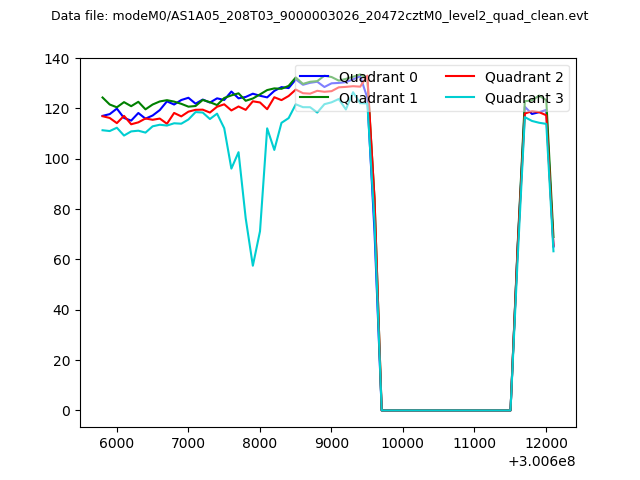 |
|
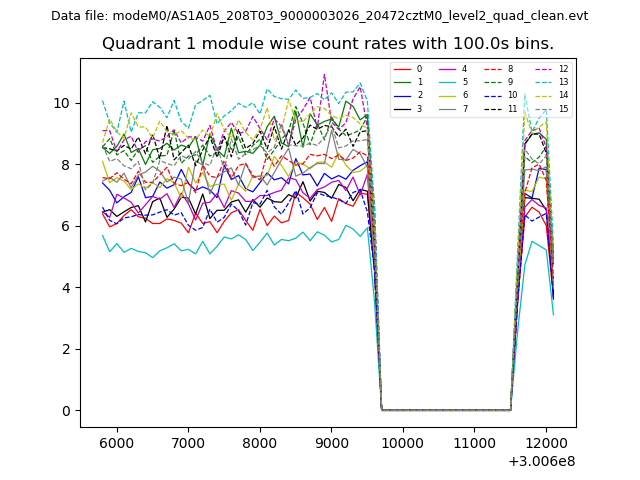
| Module-wise count rates for Quadrant A Data is divided into 100 sec bins |
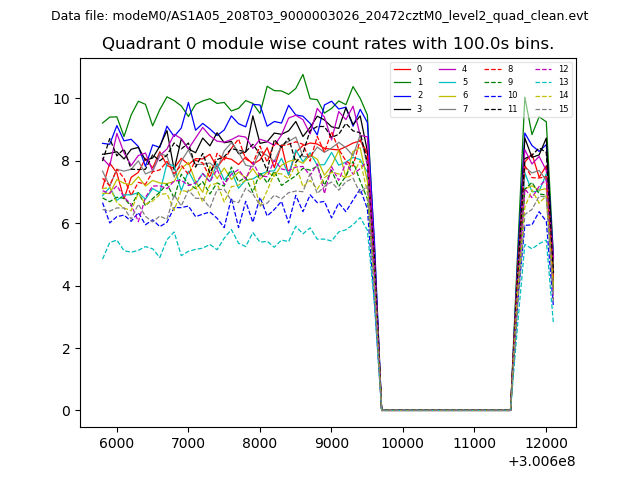 |
 |
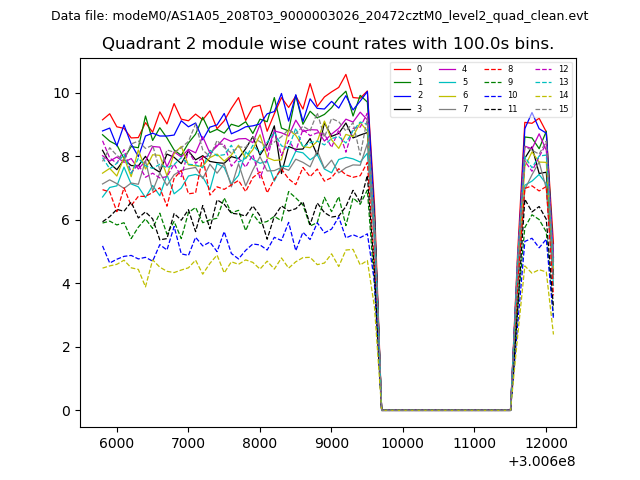
| Module-wise count rates for Quadrant B Data is divided into 100 sec bins |
 |
 |
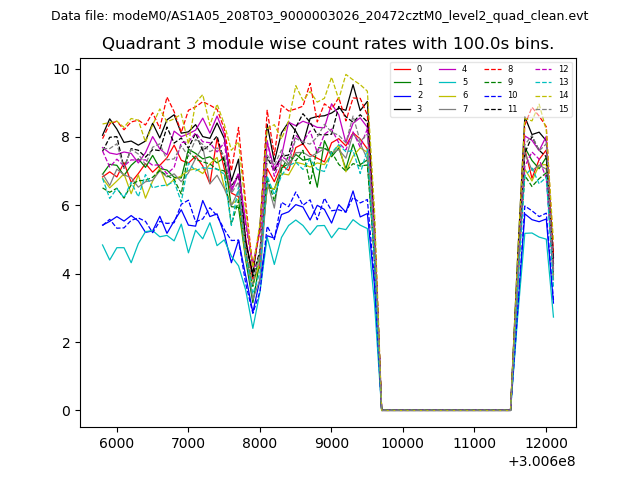
| Module-wise count rates for Quadrant C Data is divided into 100 sec bins |
 |
 |
| Module-wise count rates for Quadrant D Data is divided into 100 sec bins |
 |
 |
| Parameter | Plot |
|---|---|
| CZT HV Monitor | 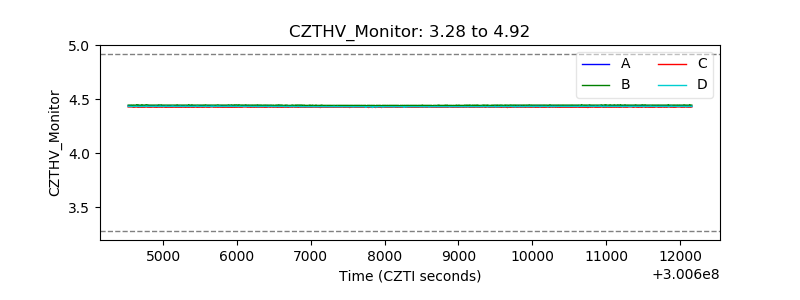 |
| D_VDD | 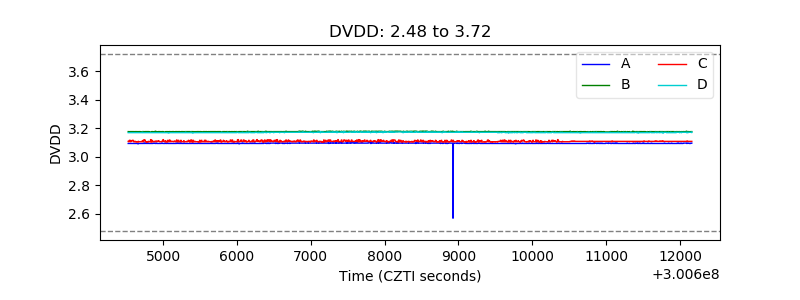 |
| Temperature 1 | 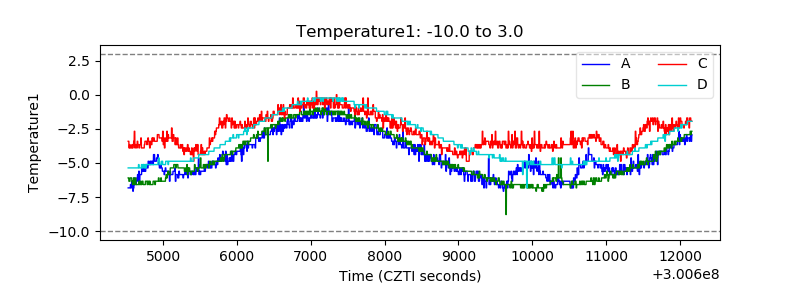 |
| Veto HV Monitor | 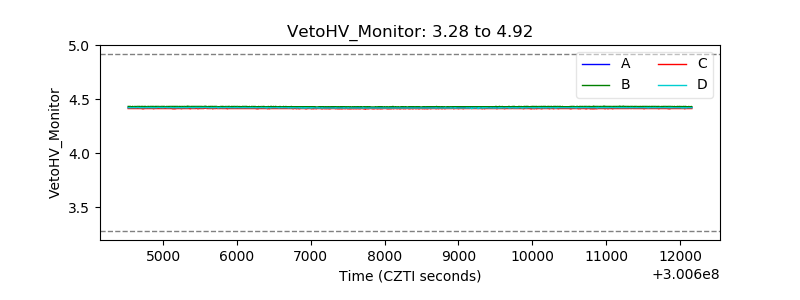 |
| Veto LLD | 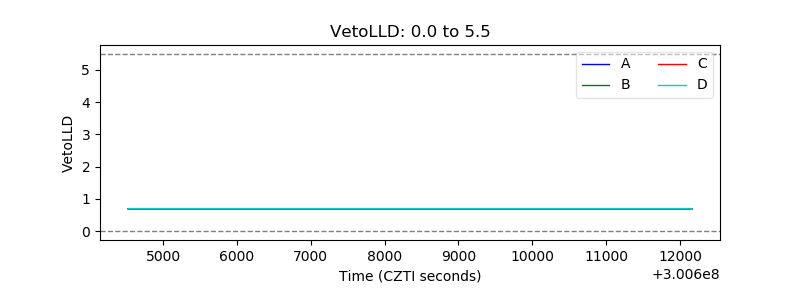 |
| Alpha Counter | 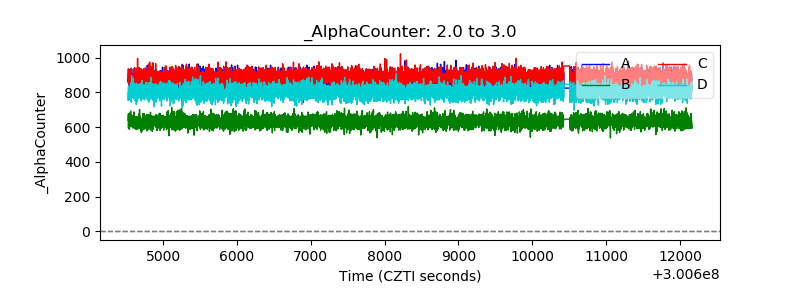 |
| _CPM_Rate | 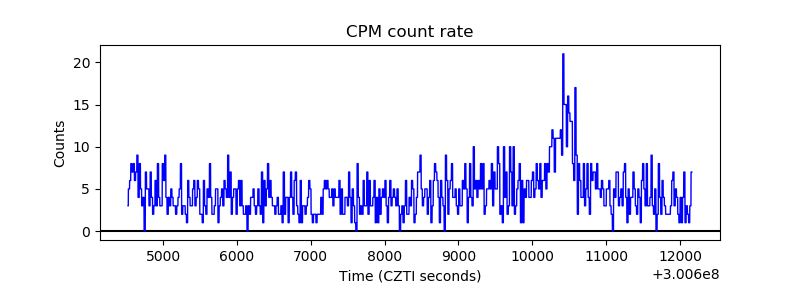 |
| CZT Counter | 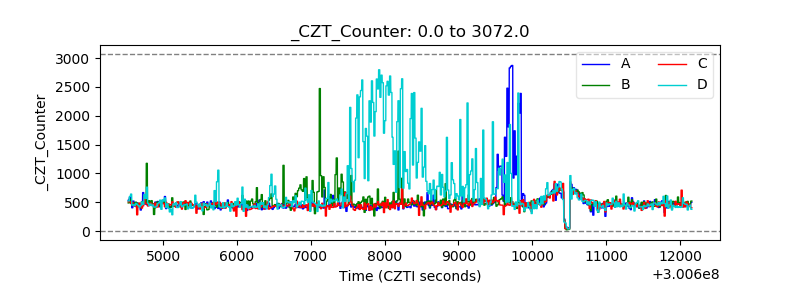 |
| +2.5 Volts monitor | 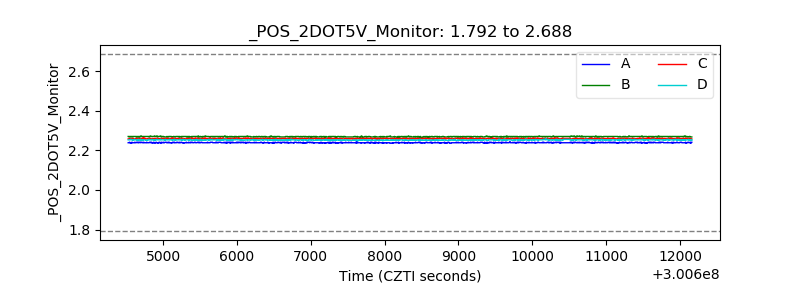 |
| +5 Volts monitor |  |
| _ROLL_ROT | 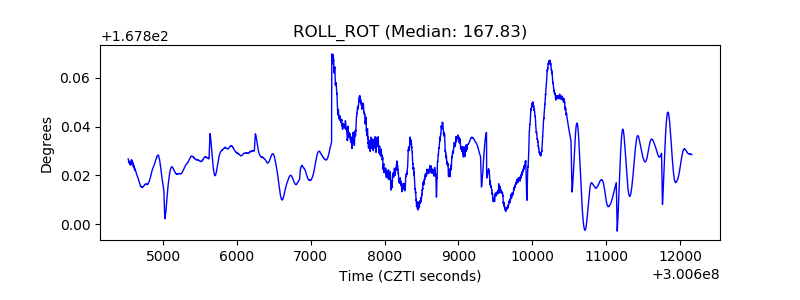 |
| _Roll_DEC | 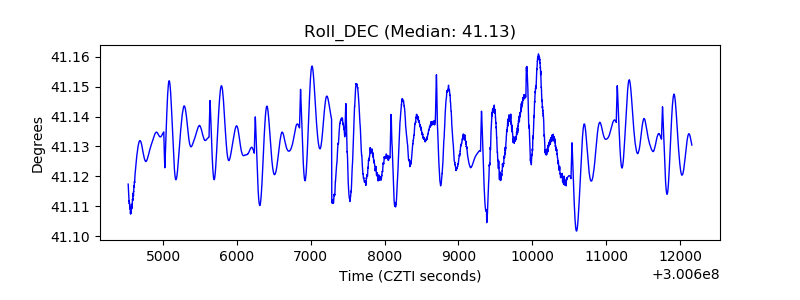 |
| _Roll_RA | 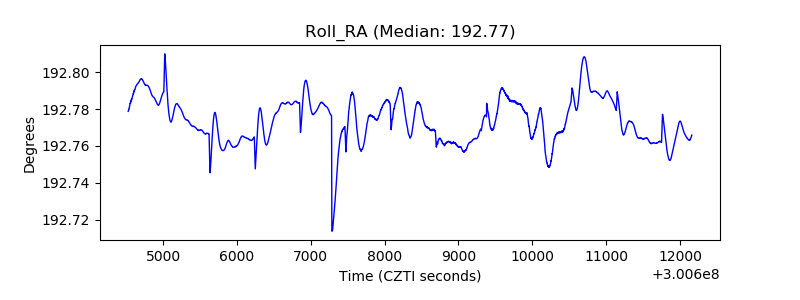 |
| Veto Counter | 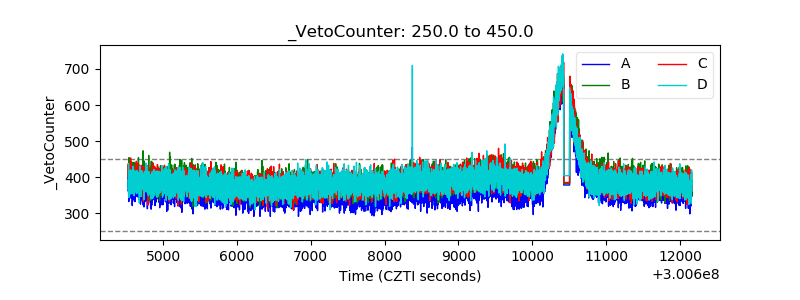 |