| Param | Original file | Final file |
|---|---|---|
| Filename | modeM0/AS1A05_208T03_9000003026_20473cztM0_level2.evt | modeM0/AS1A05_208T03_9000003026_20473cztM0_level2_quad_clean.evt |
| Size (bytes) | 404,251,200 | 75,240,000 |
| Size | 385.5 MB | 71.8 MB |
| Events in quadrant A | 2,696,280 | 477,174 |
| Events in quadrant B | 3,152,878 | 474,313 |
| Events in quadrant C | 2,727,284 | 462,201 |
| Events in quadrant D | 3,263,422 | 450,848 |
| Mode M0 | |||
|---|---|---|---|
| Quadrant | BADHDUFLAG | Total packets | Discarded packets |
| A | 0 | 12027 | 1 |
| B | 0 | 13083 | 1 |
| C | 0 | 12000 | 1 |
| D | 0 | 13592 | 1 |
| Mode SS | |||
|---|---|---|---|
| Quadrant | BADHDUFLAG | Total packets | Discarded packets |
| A | 0 | 120 | 0 |
| B | 0 | 120 | 0 |
| C | 0 | 120 | 0 |
| D | 0 | 120 | 0 |
| Quadrant | Total seconds | Saturated seconds | Saturation percentage |
|---|---|---|---|
| A | 5917 | 69 | 1.166131% |
| B | 5918 | 107 | 1.808043% |
| C | 5918 | 66 | 1.115242% |
| D | 5918 | 100 | 1.689760% |
Noise dominated data is calculated using 1-second bins in cleaned event files. If a bin has >2000 counts, and if more than 50% of those come from <1% of pixels, then it is considered to be noise-dominated and hence unusable.
| Quadrant | # 1 sec bins | Bins with >0 counts | Bins with >2000 counts | High rate bins dominated by noise | Noise dominated (total time) | Noise dominated (detector-on time) | Marked lightcurve |
|---|---|---|---|---|---|---|---|
| A | 5916 | 5916 | 0 | 0 | 0.00% | 0.00% |  |
| B | 5917 | 5917 | 34 | 34 | 0.57% | 0.57% | 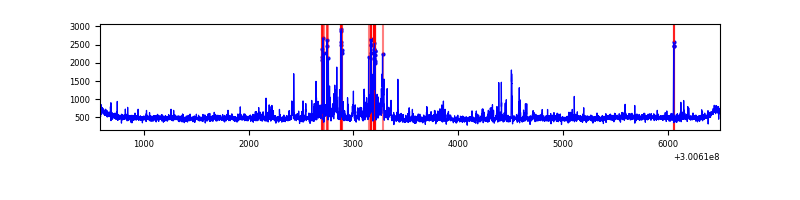 |
| C | 5917 | 5917 | 0 | 0 | 0.00% | 0.00% | 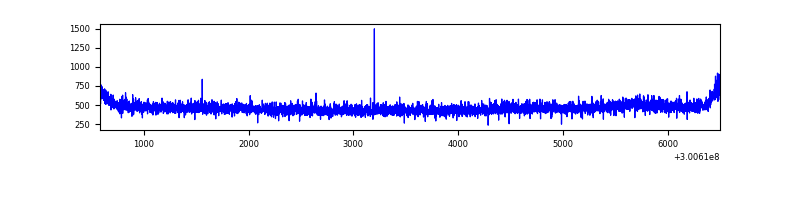 |
| D | 5917 | 5917 | 58 | 58 | 0.98% | 0.98% | 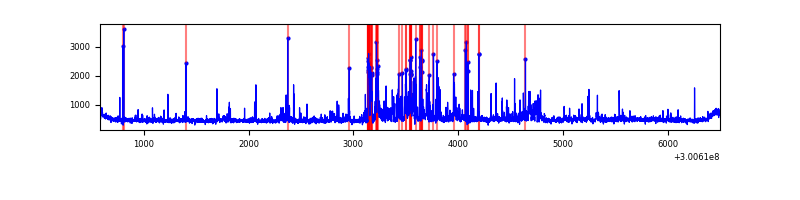 |
Top three noisy pixels from each quadrant. If the there are fewer than three noisy pixels in the level2.evt file, extra rows are filled as -1
| Pixel properties | Quadrant properties | ||||||
|---|---|---|---|---|---|---|---|
| Quadrant | DetID | PixID | Counts | Sigma | Mean | Median | Sigma |
| A | 9 | 143 | 11364 | 75.3 | 695 | 679 | 141.9 |
| A | 13 | 254 | 7107 | 45.3 | 695 | 679 | 141.9 |
| A | 0 | 226 | 6026 | 37.68 | 695 | 679 | 141.9 |
| B | 0 | 189 | 137655 | 1015.91 | 695 | 676 | 134.8 |
| B | 7 | 220 | 83795 | 616.45 | 695 | 676 | 134.8 |
| B | 0 | 197 | 81454 | 599.09 | 695 | 676 | 134.8 |
| C | 14 | 238 | 105553 | 665.01 | 670 | 673 | 157.7 |
| C | 13 | 61 | 4649 | 25.21 | 670 | 673 | 157.7 |
| C | 3 | 233 | 3913 | 20.54 | 670 | 673 | 157.7 |
| D | 1 | 52 | 160740 | 979.07 | 676 | 656 | 163.5 |
| D | 7 | 38 | 128811 | 783.79 | 676 | 656 | 163.5 |
| D | 2 | 184 | 77209 | 468.19 | 676 | 656 | 163.5 |
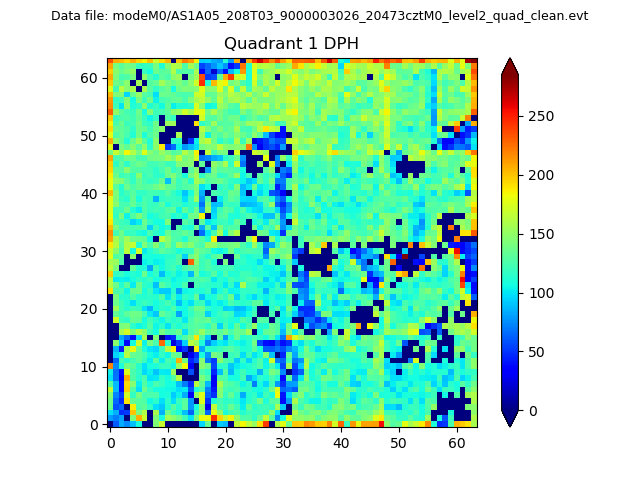
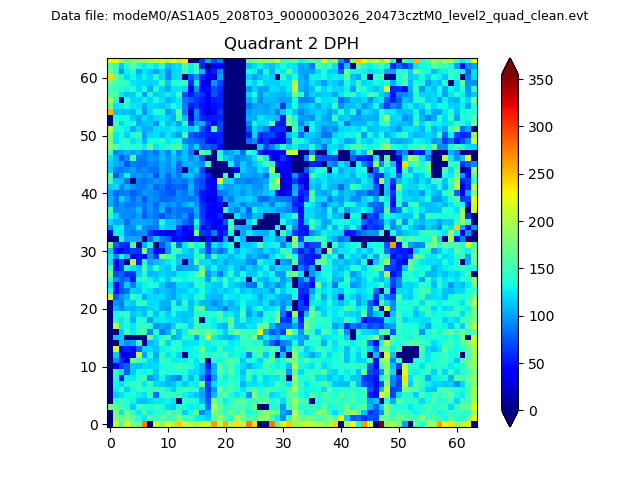
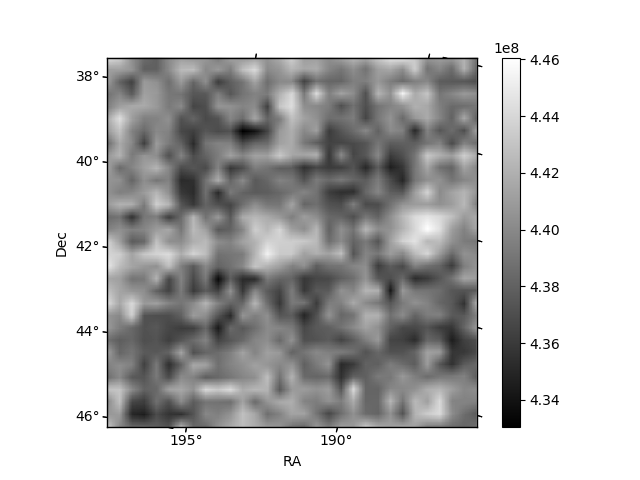
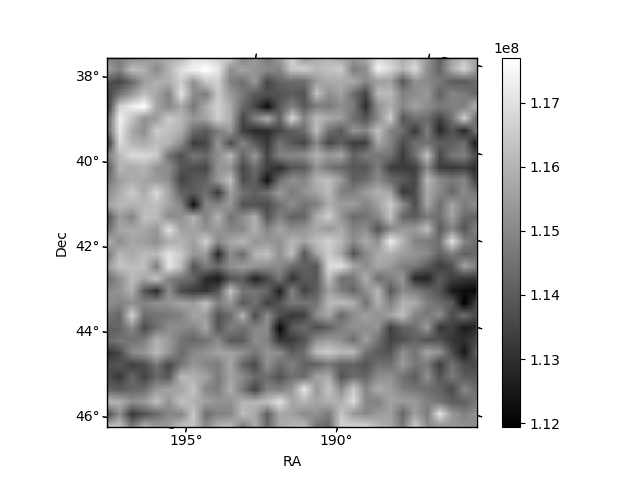
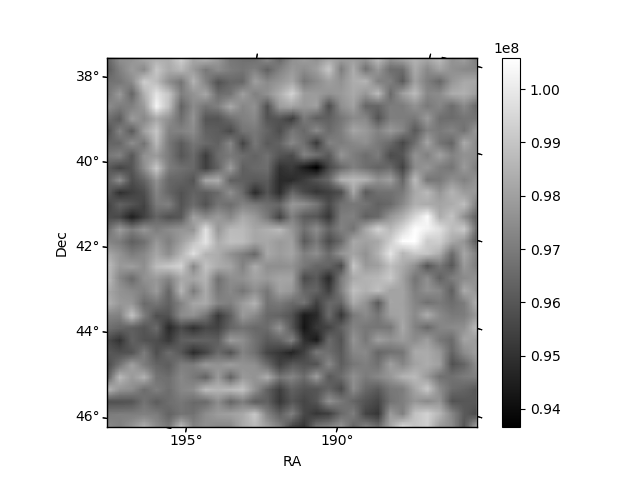
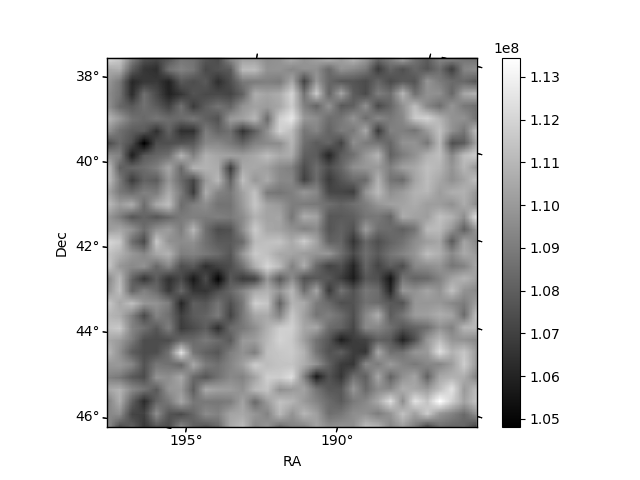
Histogram calculated using DETX and DETY for each event in the final _common_clean file
| Quadrant A | 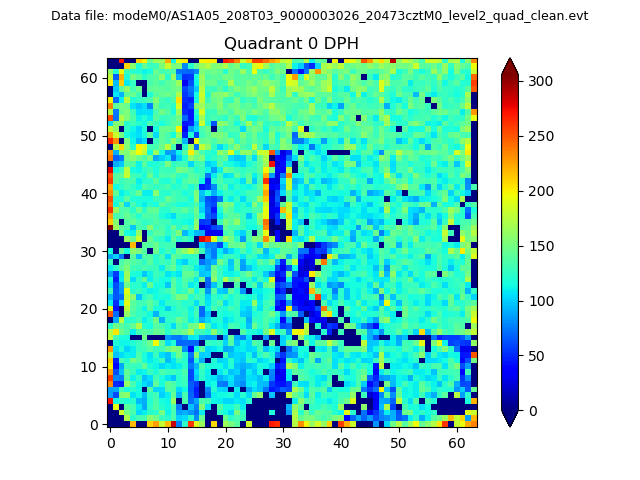 |
 |
Quadrant B |
|---|---|---|---|
| Quadrant D | 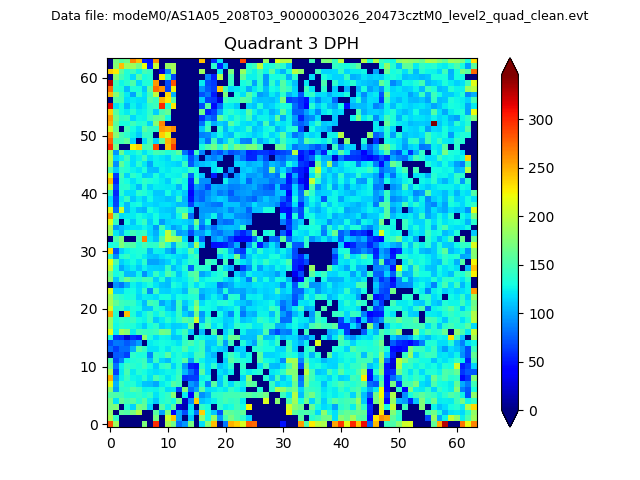 |
 |
Quadrant C |
| Plot type | Count rate plots | Images |
|---|---|---|
| Comparison with Poisson distribution Blue bars denote a histogram of data divided into 1 sec bins. Red curve is a Poisson curve with rate = median count rate of data. |
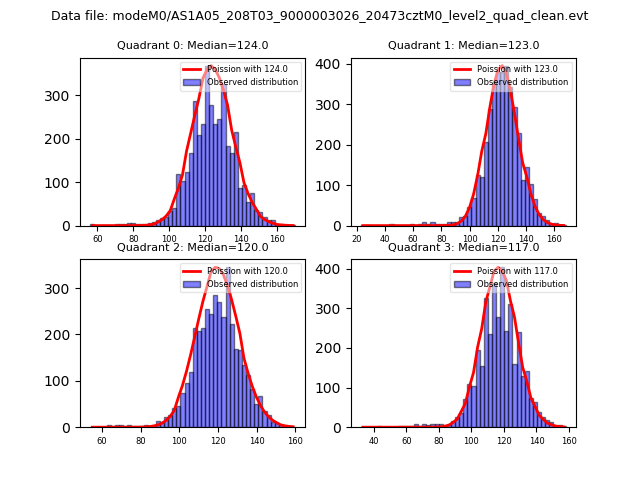 |
 |
| Quadrant-wise count rates Data is divided into 100 sec bins |
 |
|
| Module-wise count rates for Quadrant A Data is divided into 100 sec bins |
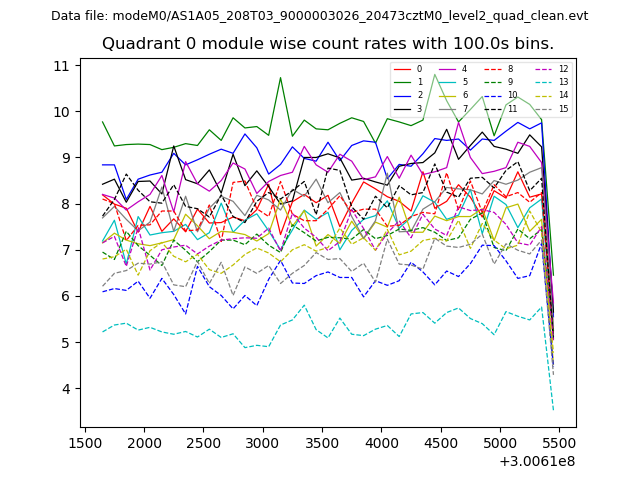 |
 |
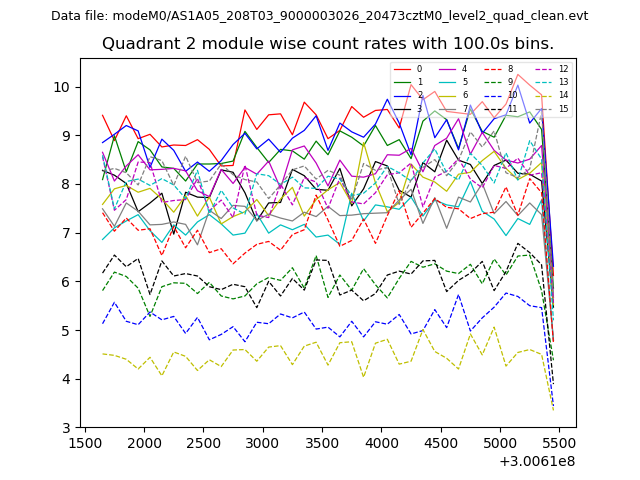
| Module-wise count rates for Quadrant B Data is divided into 100 sec bins |
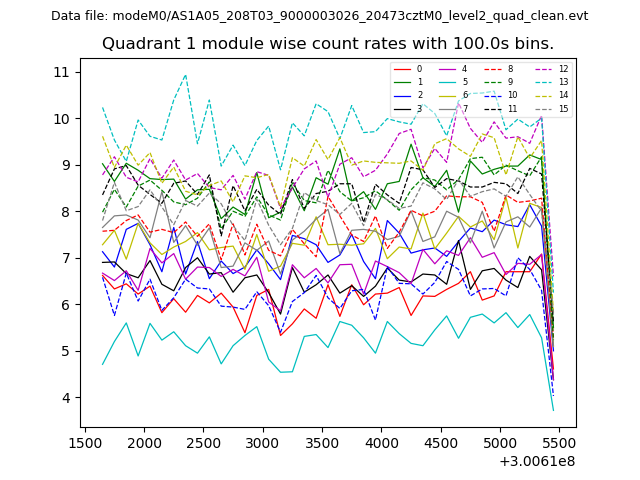 |
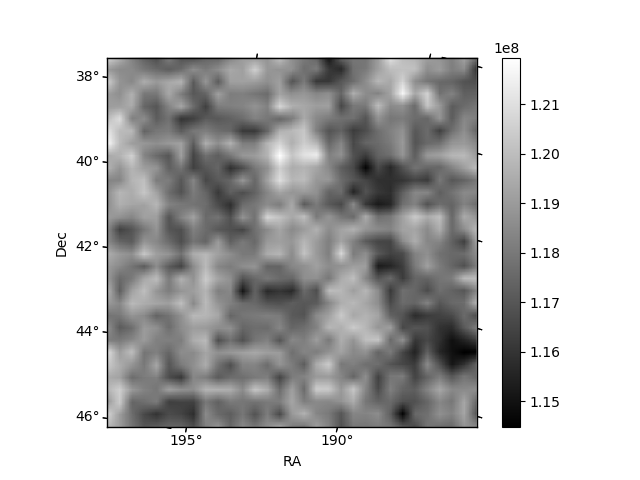 |
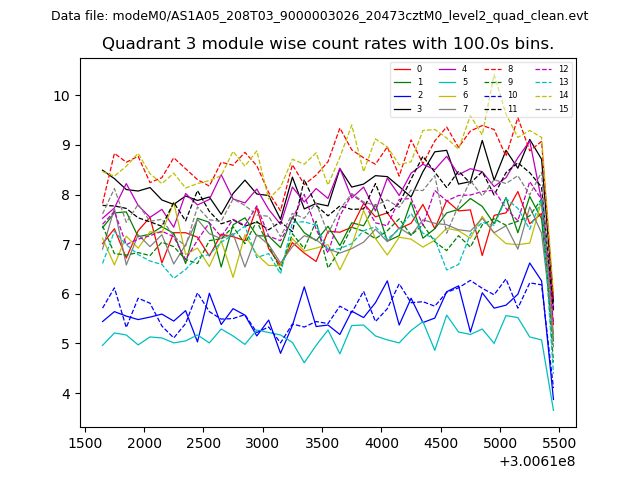
| Module-wise count rates for Quadrant C Data is divided into 100 sec bins |
 |
 |
| Module-wise count rates for Quadrant D Data is divided into 100 sec bins |
 |
 |
| Parameter | Plot |
|---|---|
| CZT HV Monitor | 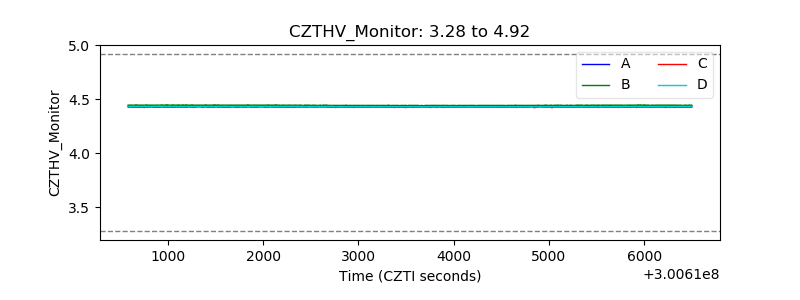 |
| D_VDD | 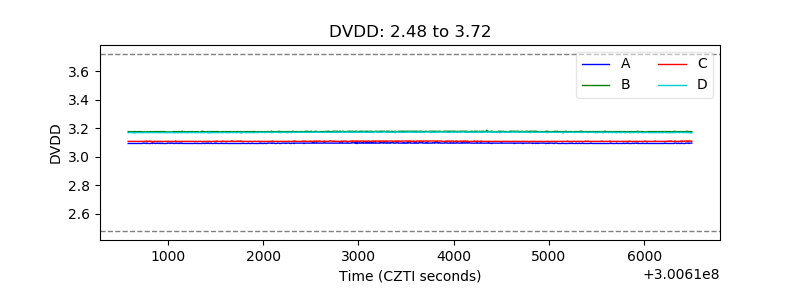 |
| Temperature 1 | 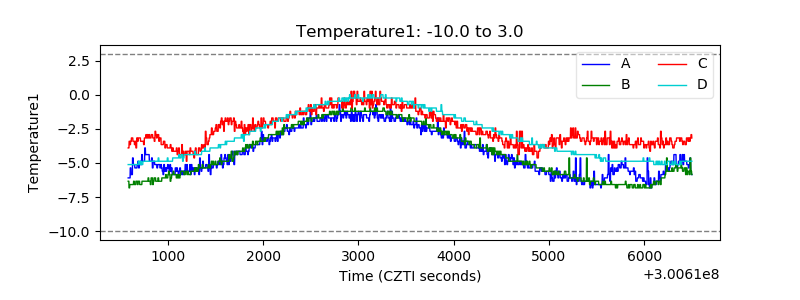 |
| Veto HV Monitor | 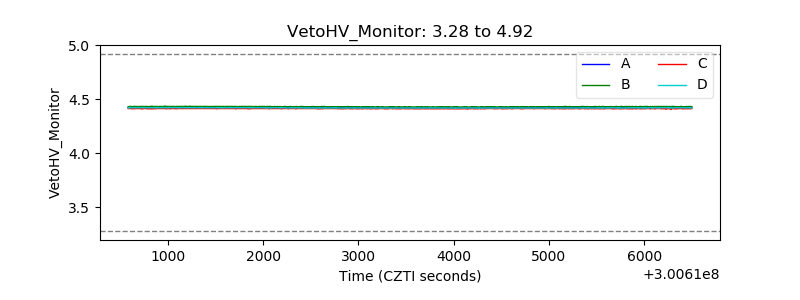 |
| Veto LLD | 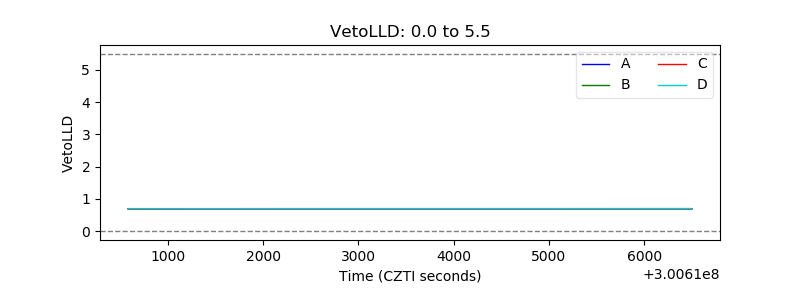 |
| Alpha Counter | 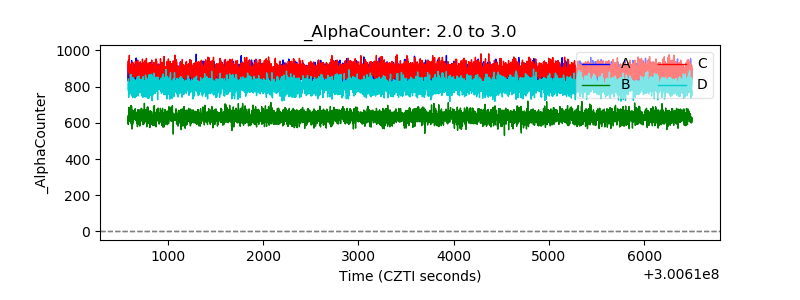 |
| _CPM_Rate | 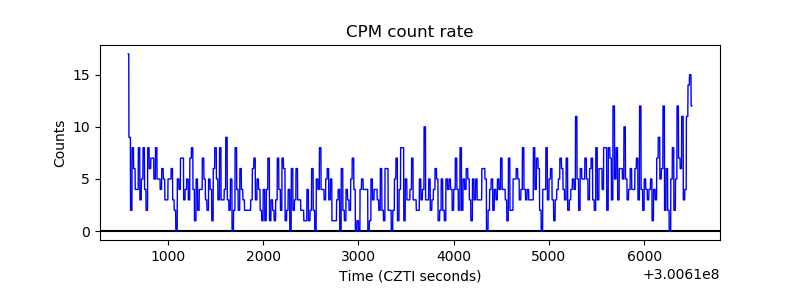 |
| CZT Counter | 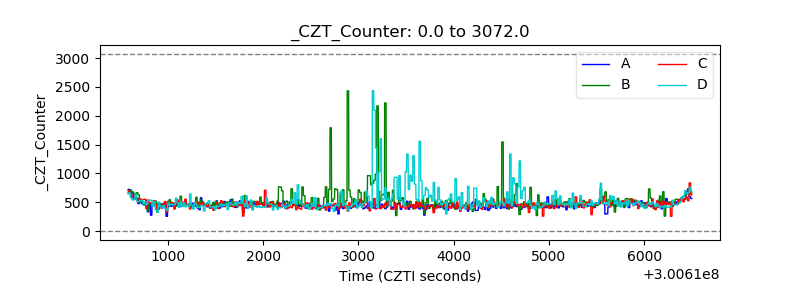 |
| +2.5 Volts monitor | 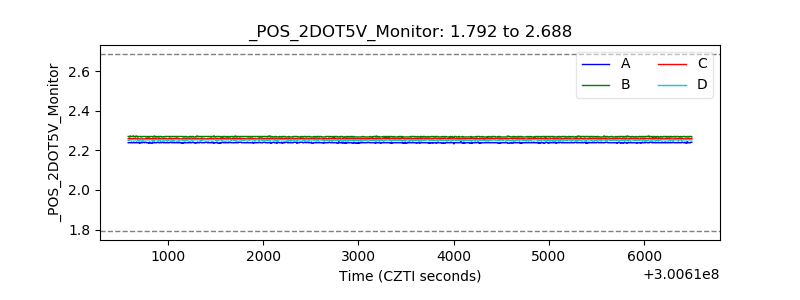 |
| +5 Volts monitor |  |
| _ROLL_ROT | 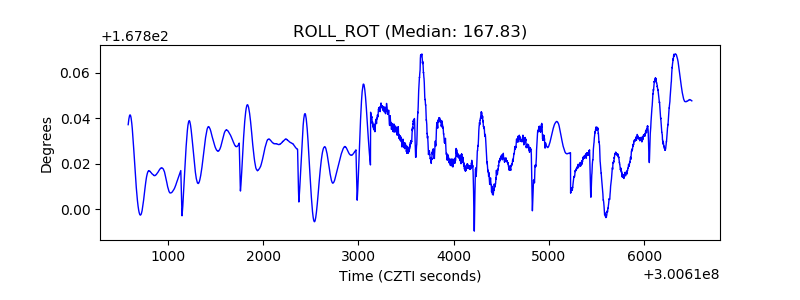 |
| _Roll_DEC | 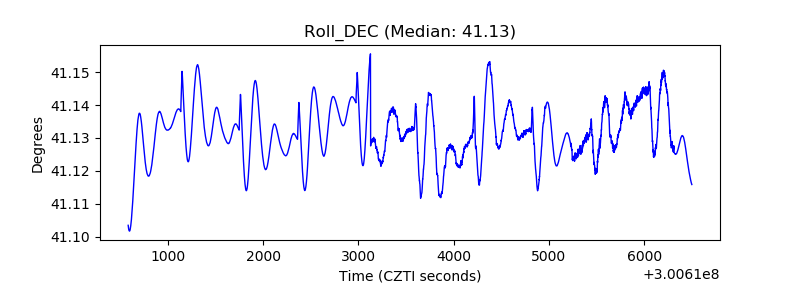 |
| _Roll_RA | 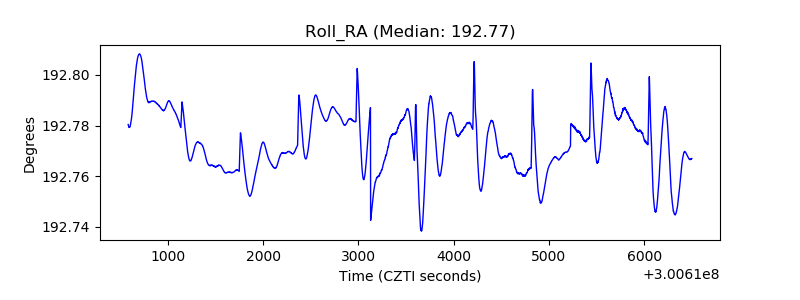 |
| Veto Counter | 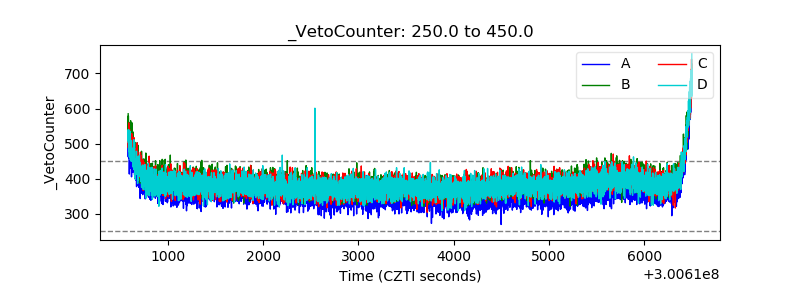 |