| Param | Original file | Final file |
|---|---|---|
| Filename | modeM0/AS1A05_208T03_9000003026_20475cztM0_level2.evt | modeM0/AS1A05_208T03_9000003026_20475cztM0_level2_quad_clean.evt |
| Size (bytes) | 985,907,520 | 178,505,280 |
| Size | 940.2 MB | 170.2 MB |
| Events in quadrant A | 7,445,452 | 1,129,853 |
| Events in quadrant B | 7,460,832 | 1,149,173 |
| Events in quadrant C | 6,454,683 | 1,110,595 |
| Events in quadrant D | 7,580,958 | 1,081,209 |
| Mode M0 | |||
|---|---|---|---|
| Quadrant | BADHDUFLAG | Total packets | Discarded packets |
| A | 0 | 31187 | 3 |
| B | 0 | 30654 | 3 |
| C | 0 | 27782 | 4 |
| D | 0 | 31393 | 3 |
| Mode SS | |||
|---|---|---|---|
| Quadrant | BADHDUFLAG | Total packets | Discarded packets |
| A | 0 | 276 | 0 |
| B | 0 | 276 | 0 |
| C | 0 | 276 | 0 |
| D | 0 | 276 | 0 |
| Mode M9 | |||
|---|---|---|---|
| Quadrant | BADHDUFLAG | Total packets | Discarded packets |
| A | 0 | 17 | 0 |
| B | 0 | 17 | 0 |
| C | 0 | 17 | 0 |
| D | 0 | 17 | 0 |
| Quadrant | Total seconds | Saturated seconds | Saturation percentage |
|---|---|---|---|
| A | 13545 | 623 | 4.599483% |
| B | 13545 | 316 | 2.332964% |
| C | 13545 | 236 | 1.742340% |
| D | 13545 | 332 | 2.451089% |
Noise dominated data is calculated using 1-second bins in cleaned event files. If a bin has >2000 counts, and if more than 50% of those come from <1% of pixels, then it is considered to be noise-dominated and hence unusable.
| Quadrant | # 1 sec bins | Bins with >0 counts | Bins with >2000 counts | High rate bins dominated by noise | Noise dominated (total time) | Noise dominated (detector-on time) | Marked lightcurve |
|---|---|---|---|---|---|---|---|
| A | 15185 | 13545 | 69 | 69 | 0.45% | 0.51% | 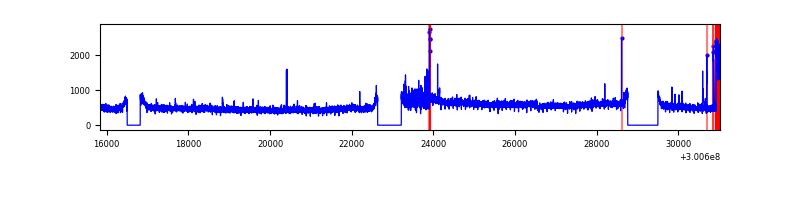 |
| B | 15185 | 13545 | 72 | 72 | 0.47% | 0.53% | 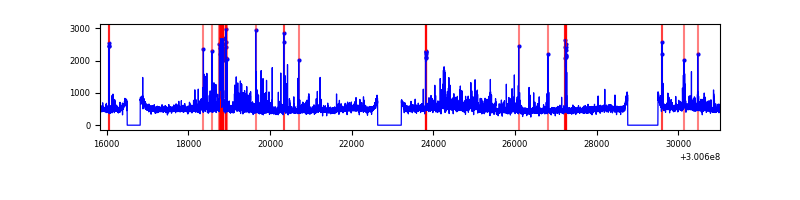 |
| C | 15185 | 13545 | 1 | 1 | 0.01% | 0.01% | 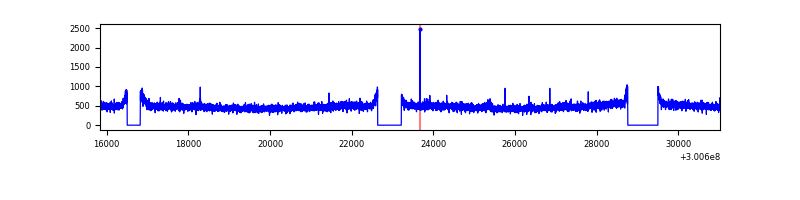 |
| D | 15185 | 13545 | 131 | 131 | 0.86% | 0.97% | 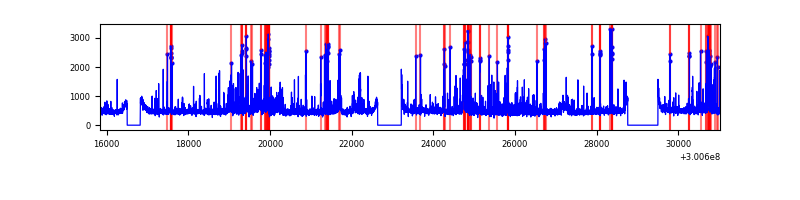 |
Top three noisy pixels from each quadrant. If the there are fewer than three noisy pixels in the level2.evt file, extra rows are filled as -1
| Pixel properties | Quadrant properties | ||||||
|---|---|---|---|---|---|---|---|
| Quadrant | DetID | PixID | Counts | Sigma | Mean | Median | Sigma |
| A | 14 | 111 | 1160218 | 3552.01 | 1614 | 1574 | 326.2 |
| A | 9 | 143 | 55165 | 164.29 | 1614 | 1574 | 326.2 |
| A | 13 | 254 | 14827 | 40.63 | 1614 | 1574 | 326.2 |
| B | 0 | 189 | 412924 | 1342.42 | 1619 | 1577 | 306.4 |
| B | 0 | 197 | 280869 | 911.47 | 1619 | 1577 | 306.4 |
| B | 4 | 216 | 87025 | 278.86 | 1619 | 1577 | 306.4 |
| C | 14 | 238 | 241356 | 656.01 | 1564 | 1571 | 365.5 |
| C | 3 | 9 | 87948 | 236.31 | 1564 | 1571 | 365.5 |
| C | 3 | 233 | 21329 | 54.05 | 1564 | 1571 | 365.5 |
| D | 1 | 52 | 432734 | 1111.25 | 1587 | 1537 | 388.0 |
| D | 7 | 38 | 223377 | 571.71 | 1587 | 1537 | 388.0 |
| D | 9 | 1 | 150734 | 384.5 | 1587 | 1537 | 388.0 |
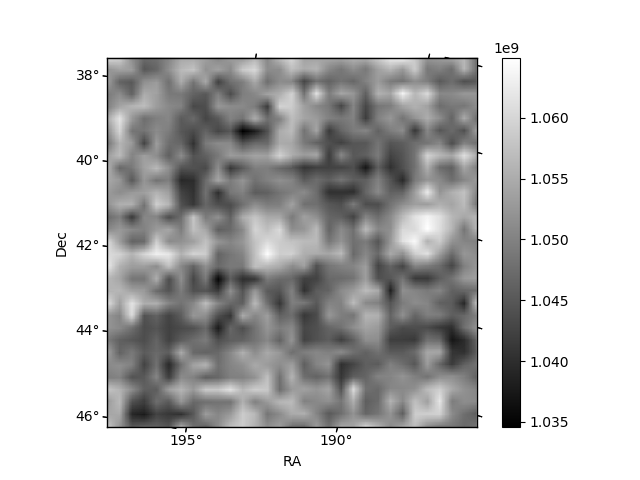
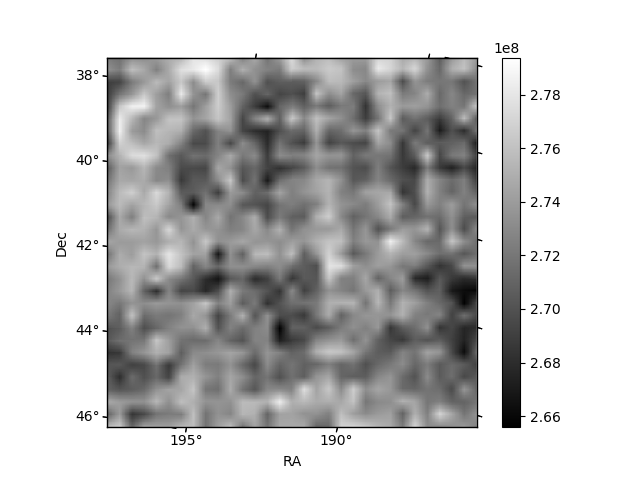
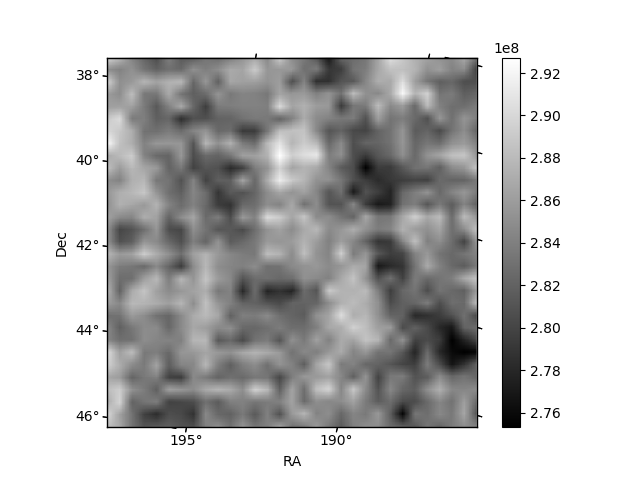
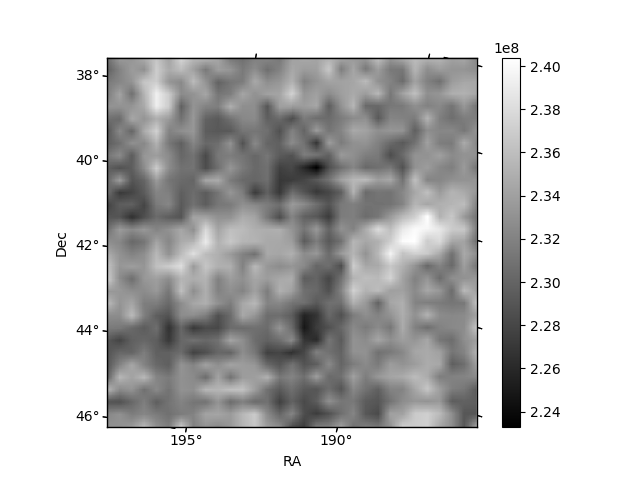
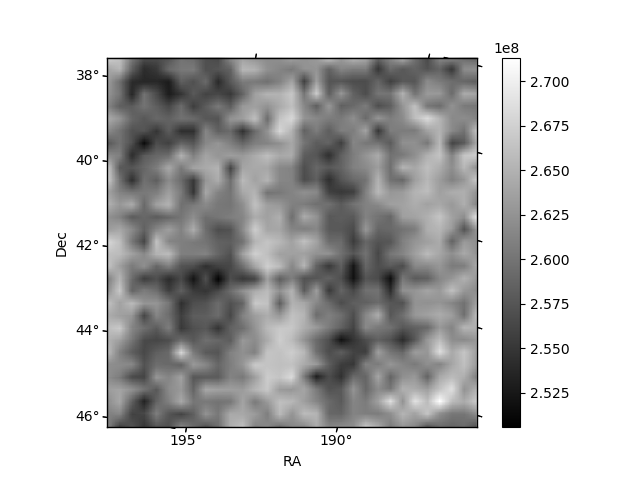
Histogram calculated using DETX and DETY for each event in the final _common_clean file
| Quadrant A | 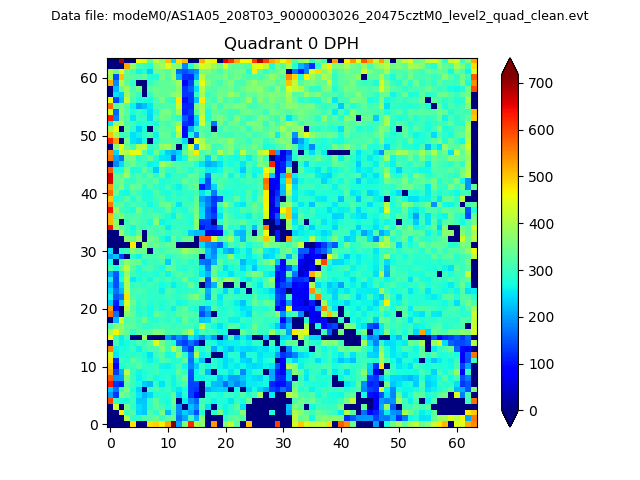 |
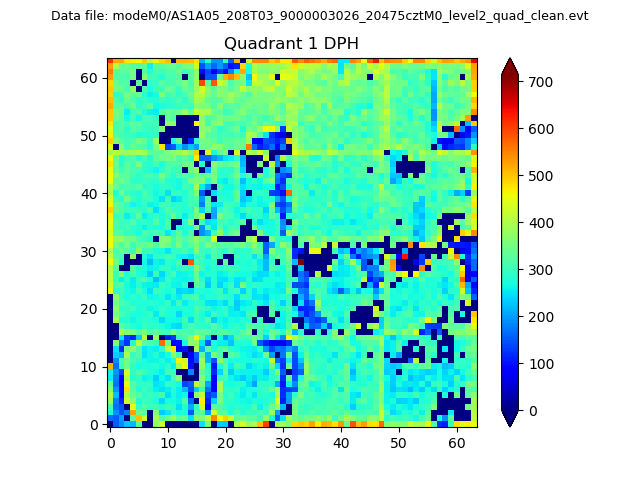 |
Quadrant B |
|---|---|---|---|
| Quadrant D |  |
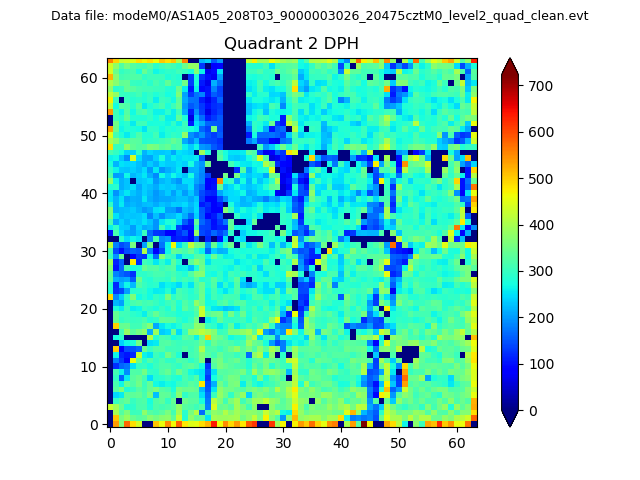 |
Quadrant C |
| Plot type | Count rate plots | Images |
|---|---|---|
| Comparison with Poisson distribution Blue bars denote a histogram of data divided into 1 sec bins. Red curve is a Poisson curve with rate = median count rate of data. |
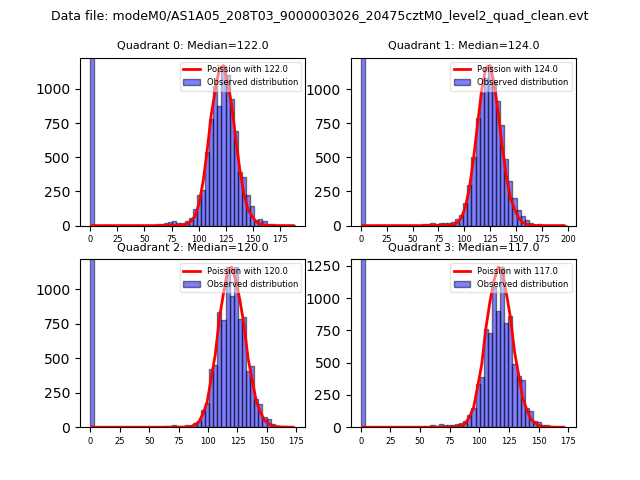 |
 |
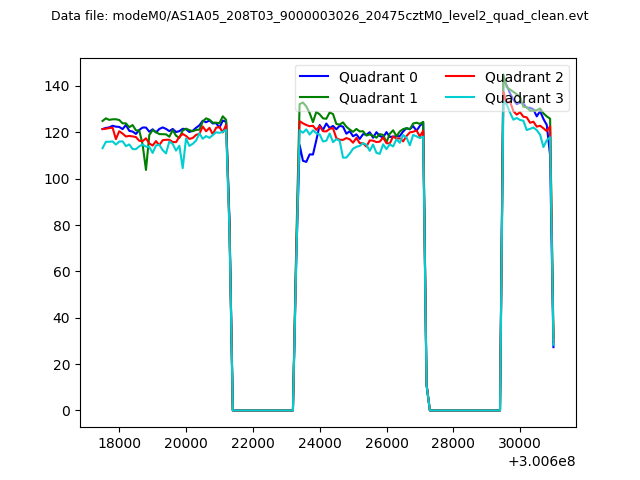
| Quadrant-wise count rates Data is divided into 100 sec bins |
 |
|
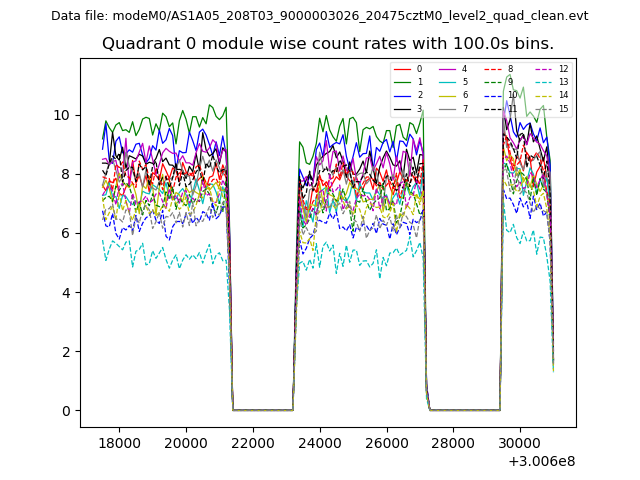
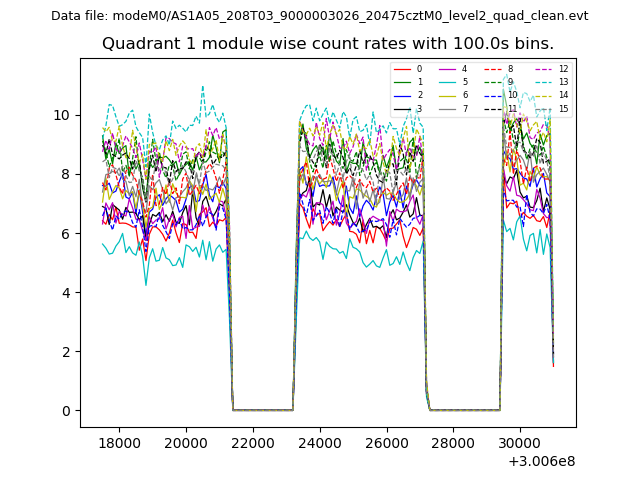
| Module-wise count rates for Quadrant A Data is divided into 100 sec bins |
 |
 |
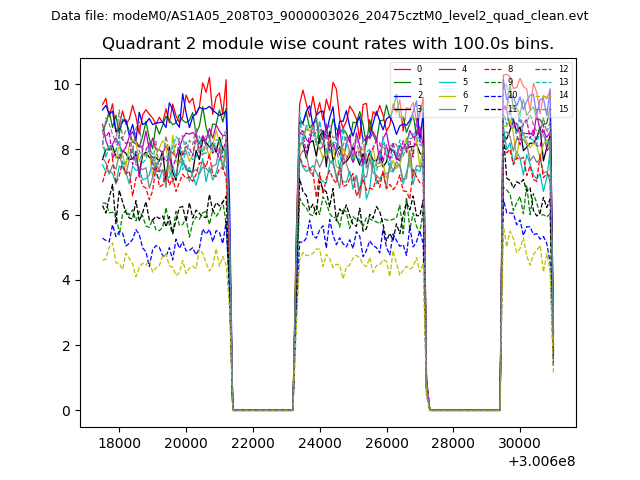
| Module-wise count rates for Quadrant B Data is divided into 100 sec bins |
 |
 |
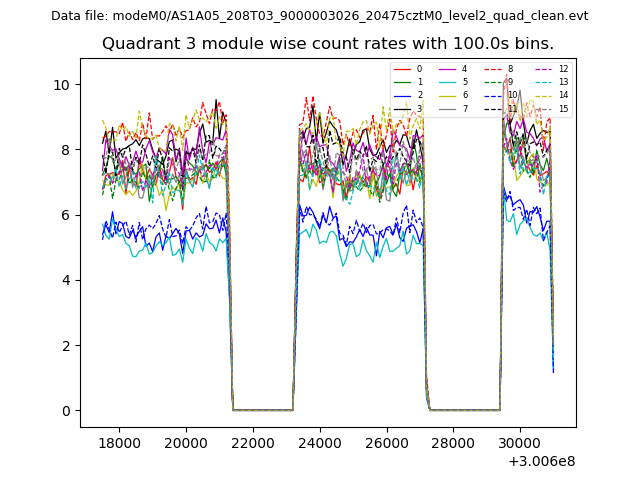
| Module-wise count rates for Quadrant C Data is divided into 100 sec bins |
 |
 |
| Module-wise count rates for Quadrant D Data is divided into 100 sec bins |
 |
 |
| Parameter | Plot |
|---|---|
| CZT HV Monitor | 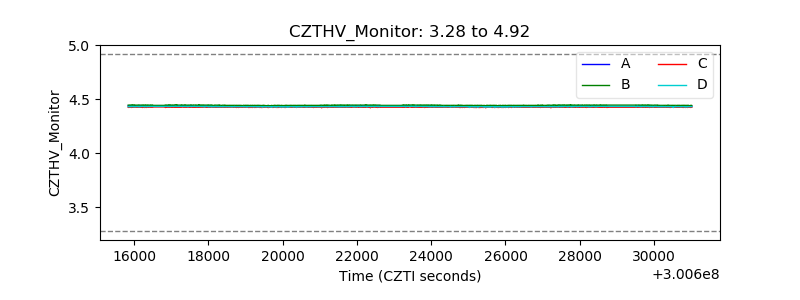 |
| D_VDD | 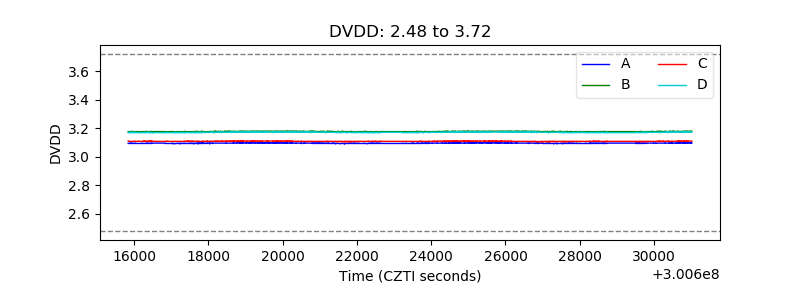 |
| Temperature 1 | 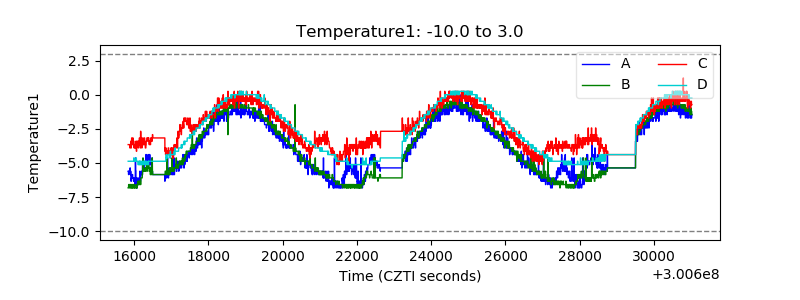 |
| Veto HV Monitor | 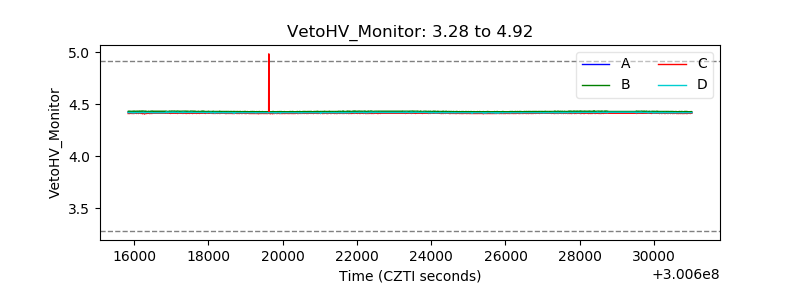 |
| Veto LLD | 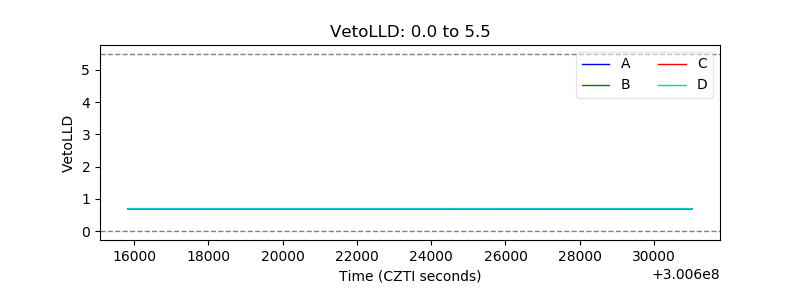 |
| Alpha Counter | 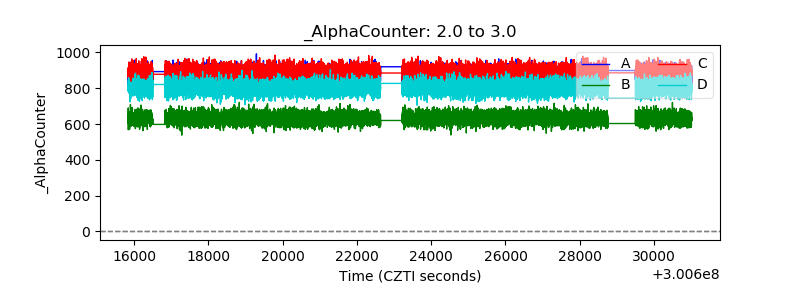 |
| _CPM_Rate | 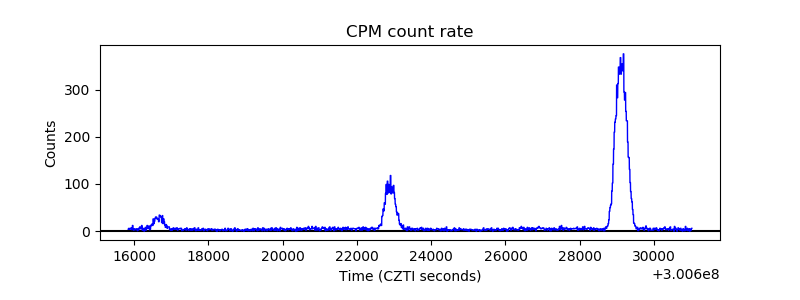 |
| CZT Counter | 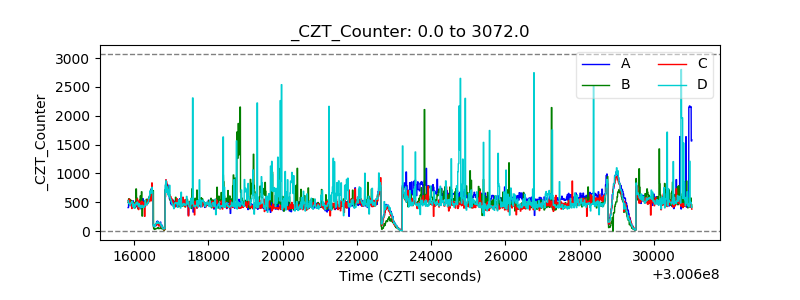 |
| +2.5 Volts monitor |  |
| +5 Volts monitor | 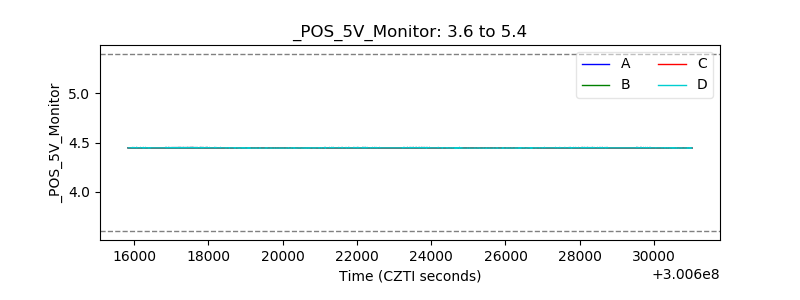 |
| _ROLL_ROT | 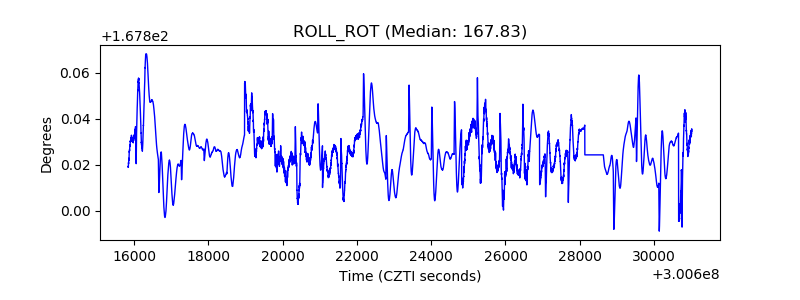 |
| _Roll_DEC | 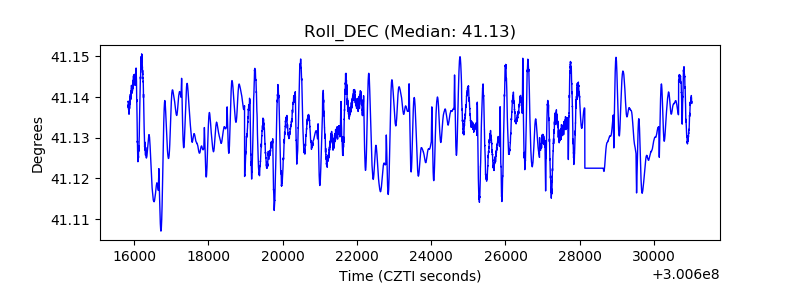 |
| _Roll_RA | 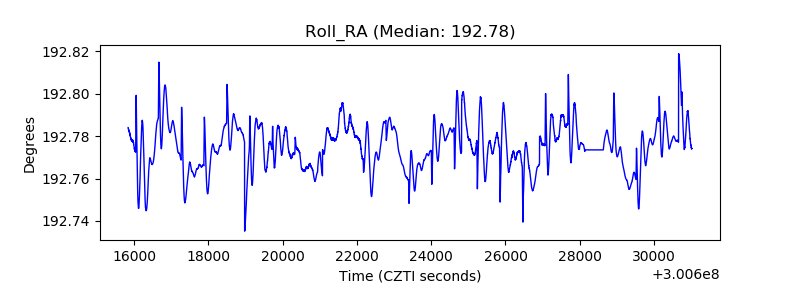 |
| Veto Counter | 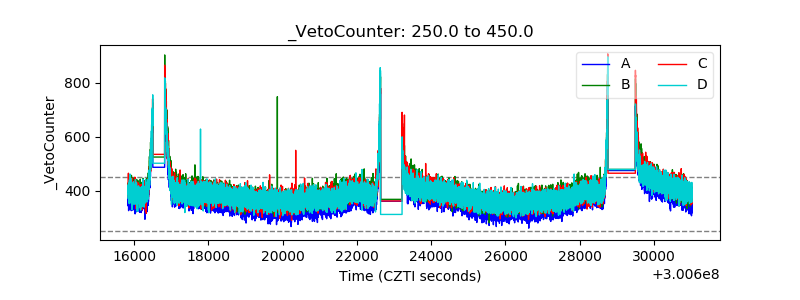 |