| Param | Original file | Final file |
|---|---|---|
| Filename | modeM0/AS1A05_208T03_9000003026_20476cztM0_level2.evt | modeM0/AS1A05_208T03_9000003026_20476cztM0_level2_quad_clean.evt |
| Size (bytes) | 1,707,163,200 | 316,667,520 |
| Size | 1.6 GB | 302.0 MB |
| Events in quadrant A | 13,354,000 | 2,028,059 |
| Events in quadrant B | 12,559,338 | 2,055,971 |
| Events in quadrant C | 10,784,519 | 1,993,700 |
| Events in quadrant D | 13,455,801 | 1,935,610 |
| Mode M0 | |||
|---|---|---|---|
| Quadrant | BADHDUFLAG | Total packets | Discarded packets |
| A | 0 | 55208 | 13 |
| B | 0 | 51981 | 4 |
| C | 0 | 46899 | 4 |
| D | 0 | 55131 | 4 |
| Mode SS | |||
|---|---|---|---|
| Quadrant | BADHDUFLAG | Total packets | Discarded packets |
| A | 0 | 464 | 0 |
| B | 0 | 464 | 0 |
| C | 0 | 464 | 0 |
| D | 0 | 464 | 0 |
| Mode M9 | |||
|---|---|---|---|
| Quadrant | BADHDUFLAG | Total packets | Discarded packets |
| A | 0 | 27 | 0 |
| B | 0 | 27 | 0 |
| C | 0 | 27 | 0 |
| D | 0 | 27 | 0 |
| Quadrant | Total seconds | Saturated seconds | Saturation percentage |
|---|---|---|---|
| A | 22937 | 734 | 3.200070% |
| B | 22939 | 433 | 1.887615% |
| C | 22939 | 302 | 1.316535% |
| D | 22939 | 603 | 2.628711% |
Noise dominated data is calculated using 1-second bins in cleaned event files. If a bin has >2000 counts, and if more than 50% of those come from <1% of pixels, then it is considered to be noise-dominated and hence unusable.
| Quadrant | # 1 sec bins | Bins with >0 counts | Bins with >2000 counts | High rate bins dominated by noise | Noise dominated (total time) | Noise dominated (detector-on time) | Marked lightcurve |
|---|---|---|---|---|---|---|---|
| A | 25513 | 22937 | 141 | 141 | 0.55% | 0.61% | 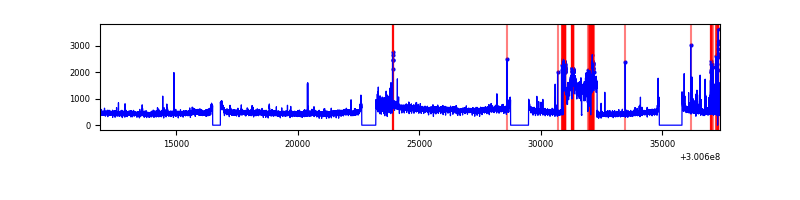 |
| B | 25514 | 22939 | 130 | 130 | 0.51% | 0.57% | 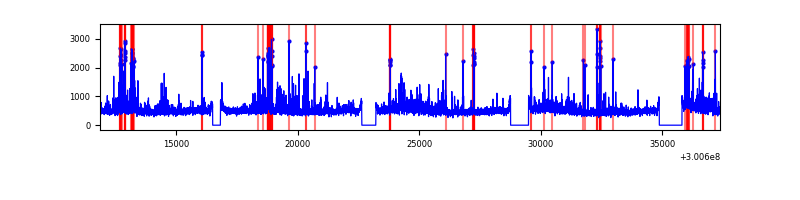 |
| C | 25514 | 22939 | 1 | 1 | 0.00% | 0.00% | 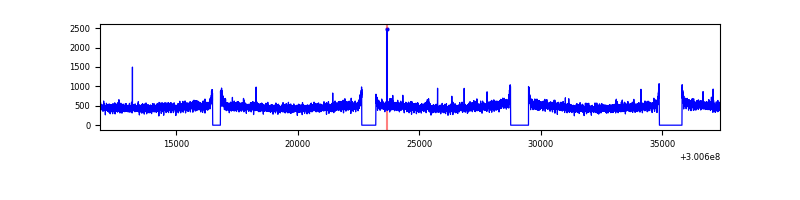 |
| D | 25514 | 22939 | 329 | 329 | 1.29% | 1.43% | 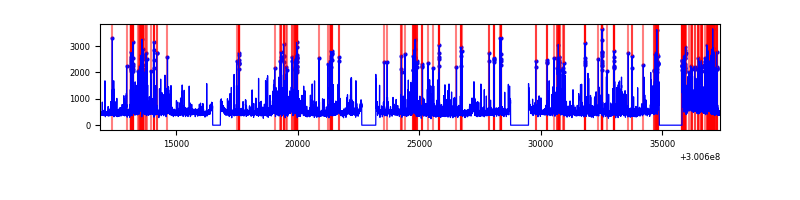 |
Top three noisy pixels from each quadrant. If the there are fewer than three noisy pixels in the level2.evt file, extra rows are filled as -1
| Pixel properties | Quadrant properties | ||||||
|---|---|---|---|---|---|---|---|
| Quadrant | DetID | PixID | Counts | Sigma | Mean | Median | Sigma |
| A | 14 | 111 | 2659710 | 4859.83 | 2704 | 2643 | 546.7 |
| A | 5 | 16 | 165946 | 298.68 | 2704 | 2643 | 546.7 |
| A | 9 | 143 | 75166 | 132.65 | 2704 | 2643 | 546.7 |
| B | 0 | 189 | 668909 | 1305.62 | 2708 | 2637 | 510.3 |
| B | 0 | 197 | 407115 | 792.61 | 2708 | 2637 | 510.3 |
| B | 7 | 220 | 234116 | 453.6 | 2708 | 2637 | 510.3 |
| C | 14 | 238 | 405275 | 658.39 | 2618 | 2627 | 611.6 |
| C | 3 | 9 | 132545 | 212.43 | 2618 | 2627 | 611.6 |
| C | 3 | 233 | 30005 | 44.77 | 2618 | 2627 | 611.6 |
| D | 1 | 52 | 771661 | 1197.87 | 2650 | 2576 | 642.0 |
| D | 5 | 222 | 653119 | 1013.24 | 2650 | 2576 | 642.0 |
| D | 7 | 38 | 378057 | 584.82 | 2650 | 2576 | 642.0 |
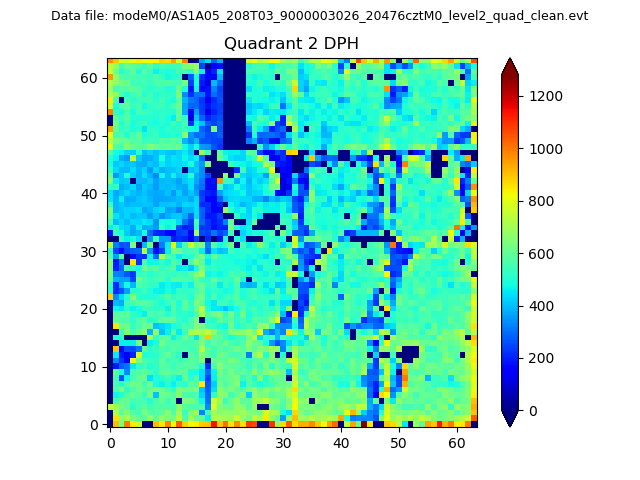
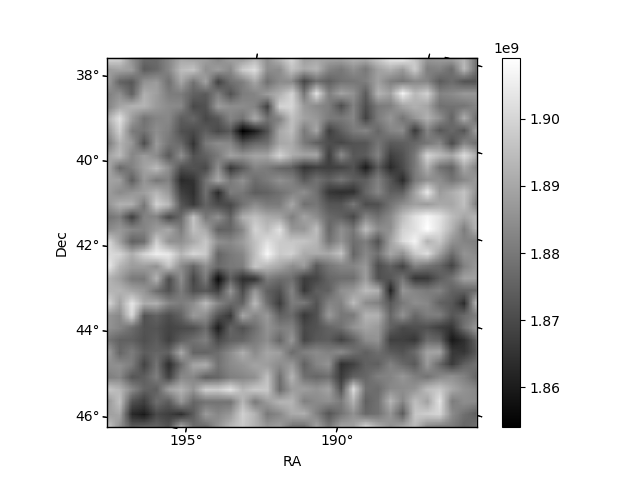
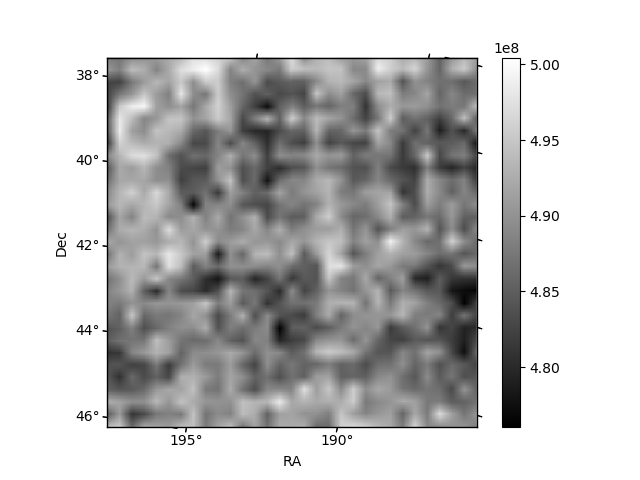
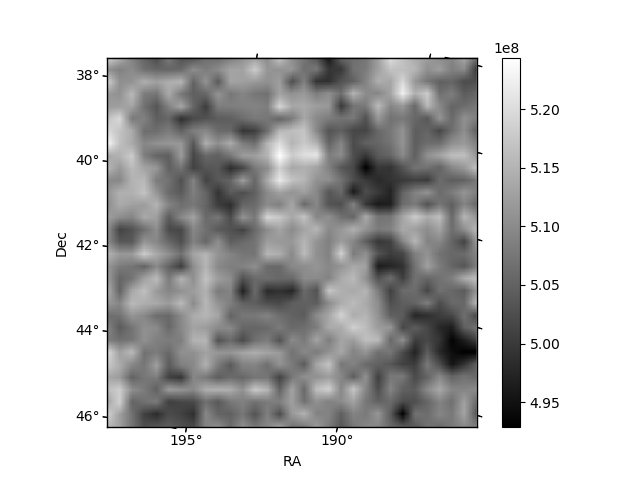
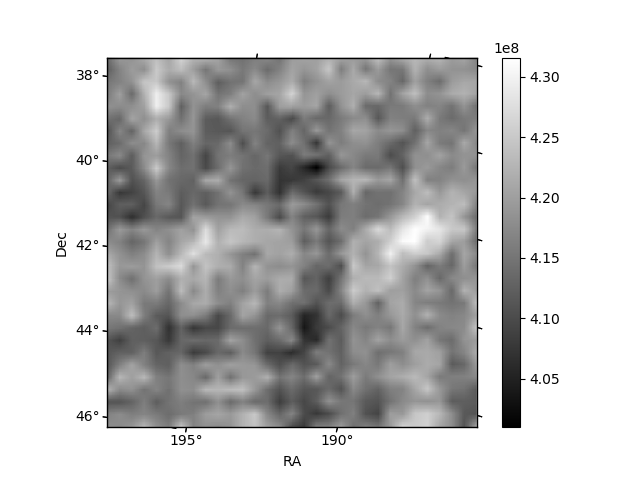
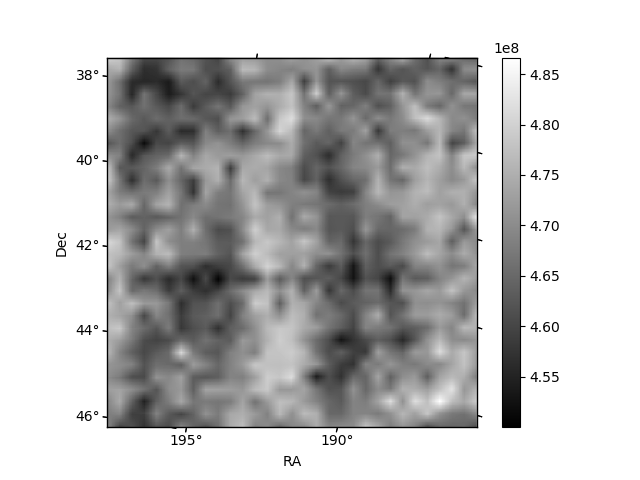
Histogram calculated using DETX and DETY for each event in the final _common_clean file
| Quadrant A | 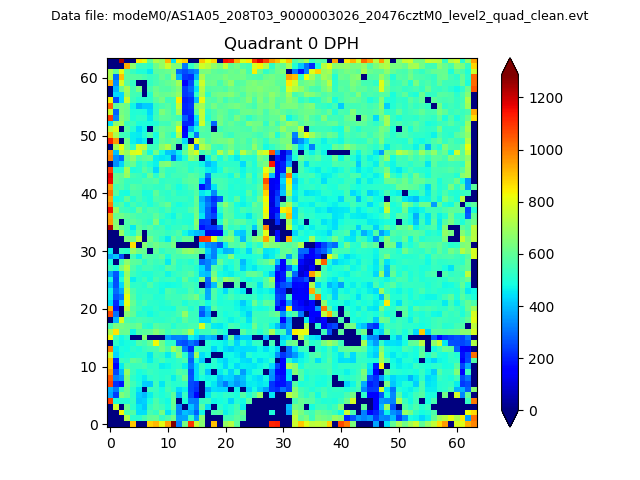 |
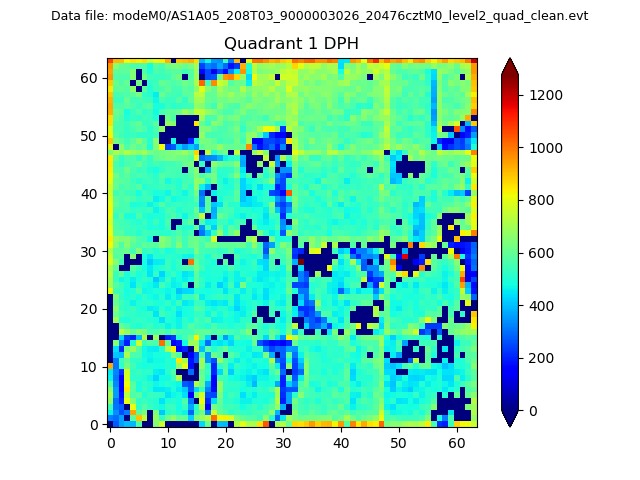 |
Quadrant B |
|---|---|---|---|
| Quadrant D | 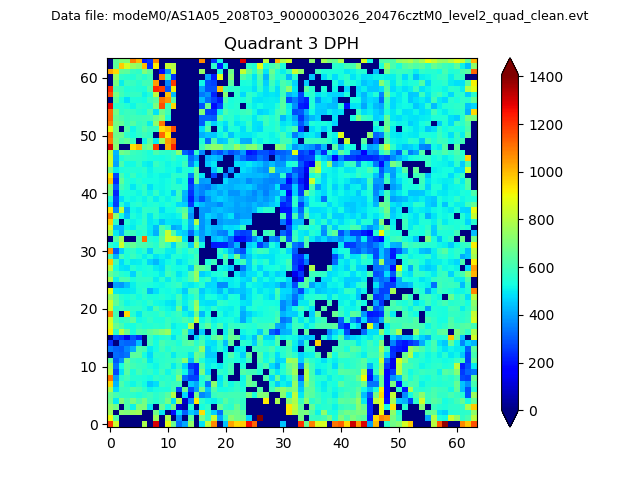 |
 |
Quadrant C |
| Plot type | Count rate plots | Images |
|---|---|---|
| Comparison with Poisson distribution Blue bars denote a histogram of data divided into 1 sec bins. Red curve is a Poisson curve with rate = median count rate of data. |
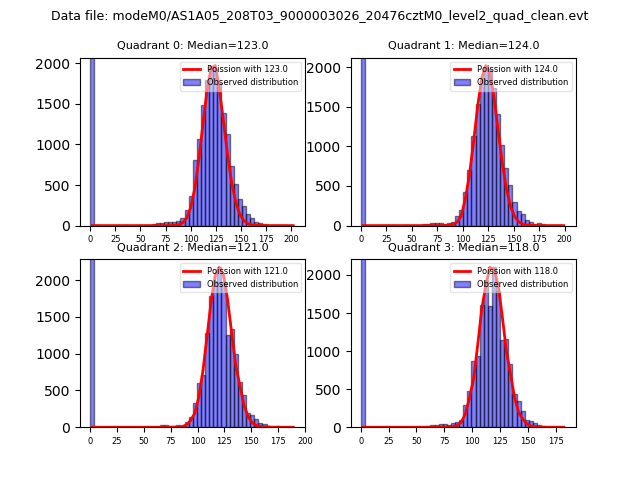 |
 |
| Quadrant-wise count rates Data is divided into 100 sec bins |
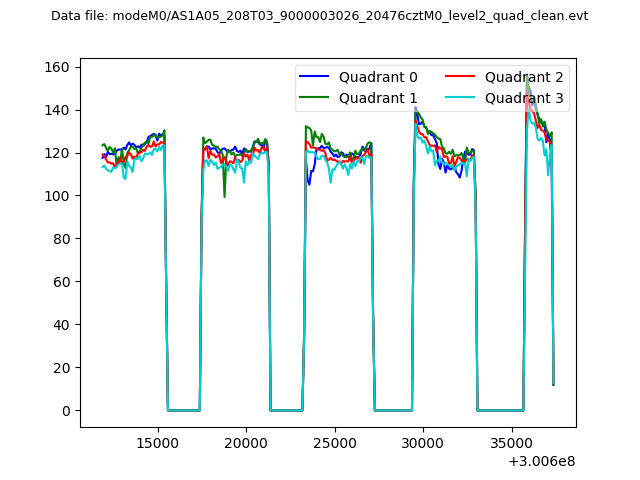 |
|
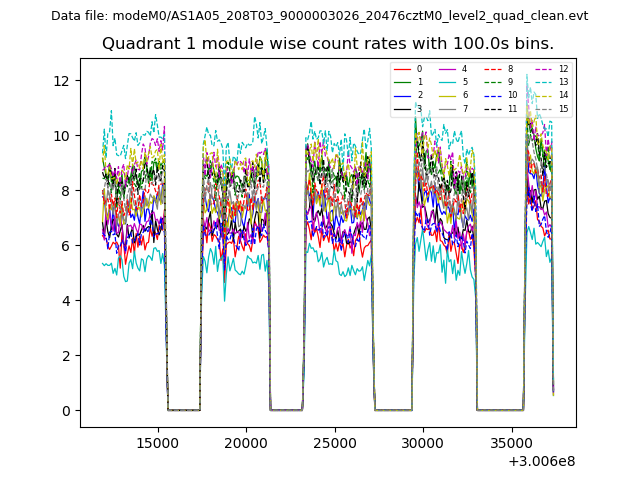
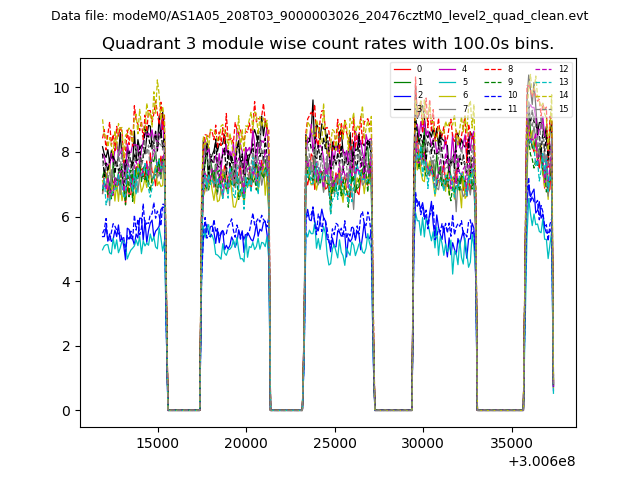
| Module-wise count rates for Quadrant A Data is divided into 100 sec bins |
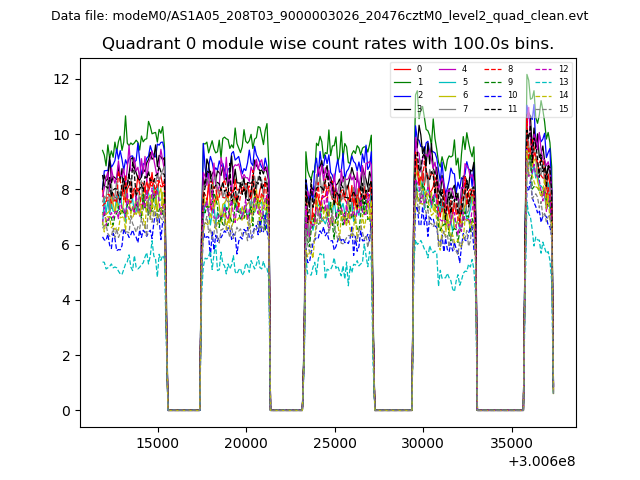 |
 |
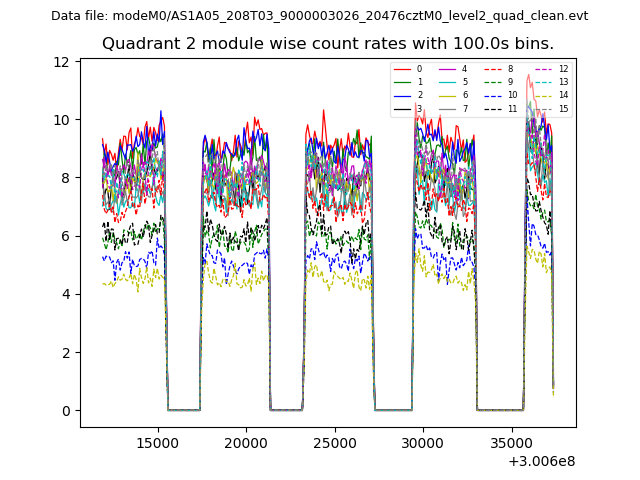
| Module-wise count rates for Quadrant B Data is divided into 100 sec bins |
 |
 |
| Module-wise count rates for Quadrant C Data is divided into 100 sec bins |
 |
 |
| Module-wise count rates for Quadrant D Data is divided into 100 sec bins |
 |
 |
| Parameter | Plot |
|---|---|
| CZT HV Monitor | 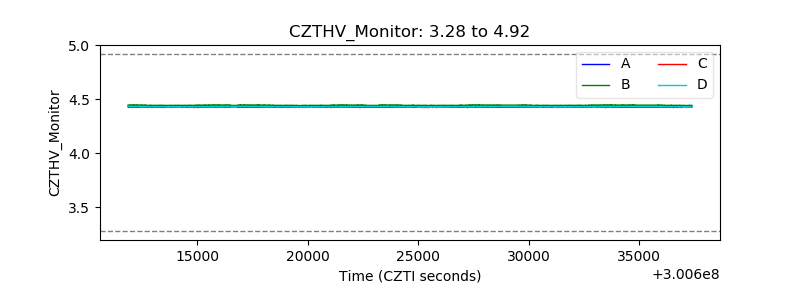 |
| D_VDD | 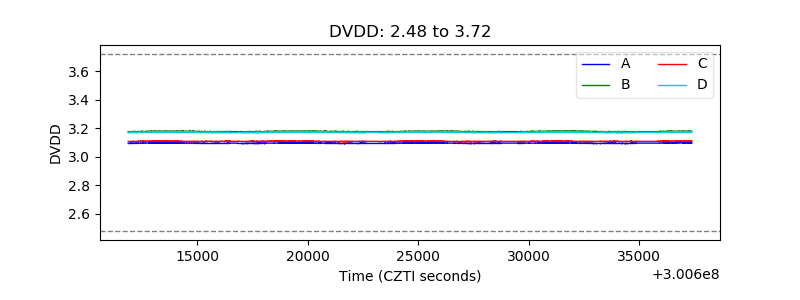 |
| Temperature 1 | 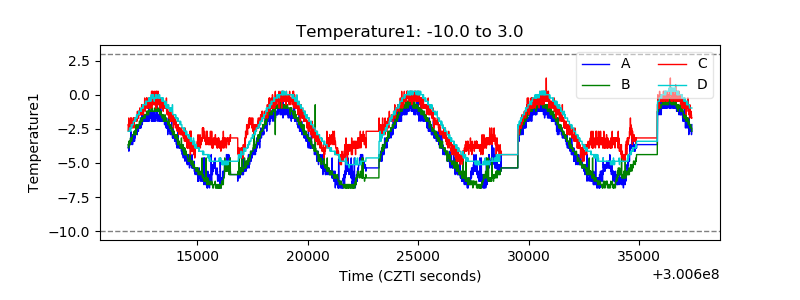 |
| Veto HV Monitor | 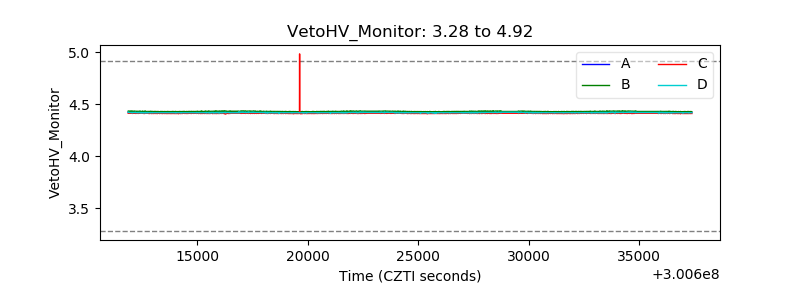 |
| Veto LLD | 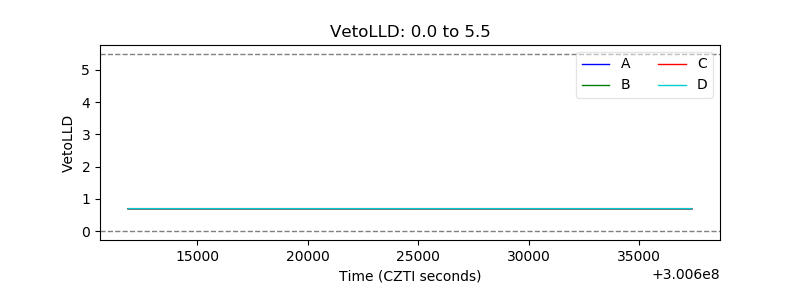 |
| Alpha Counter | 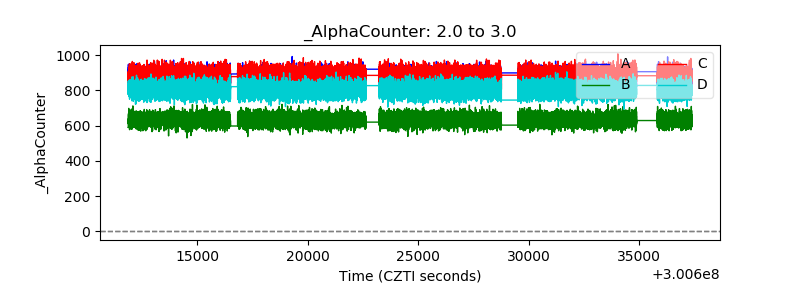 |
| _CPM_Rate | 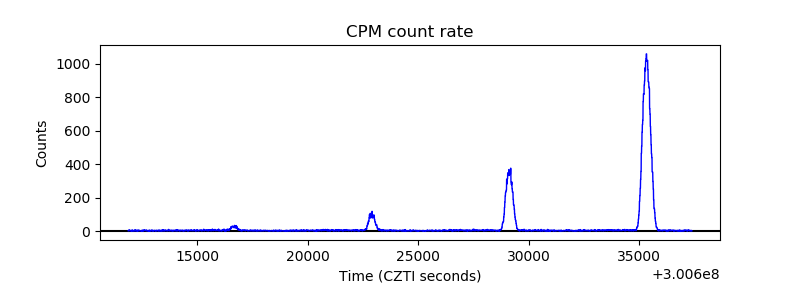 |
| CZT Counter | 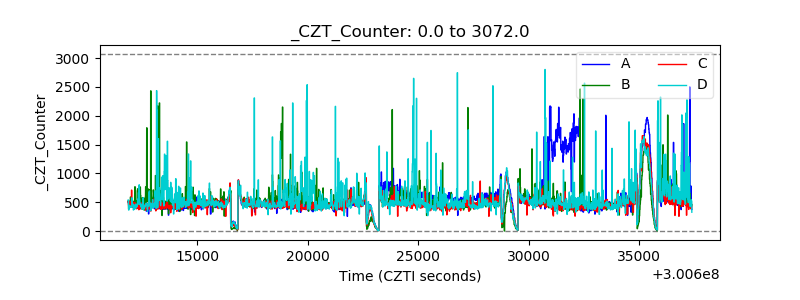 |
| +2.5 Volts monitor |  |
| +5 Volts monitor | 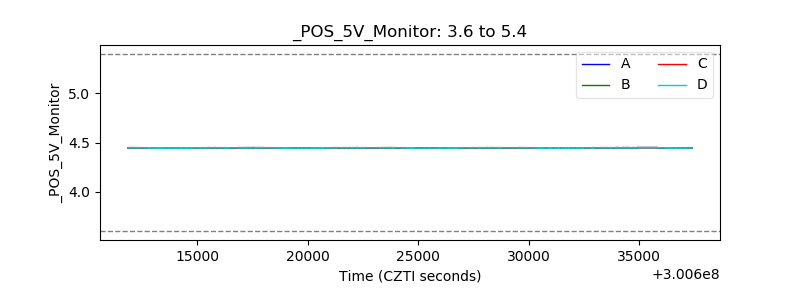 |
| _ROLL_ROT | 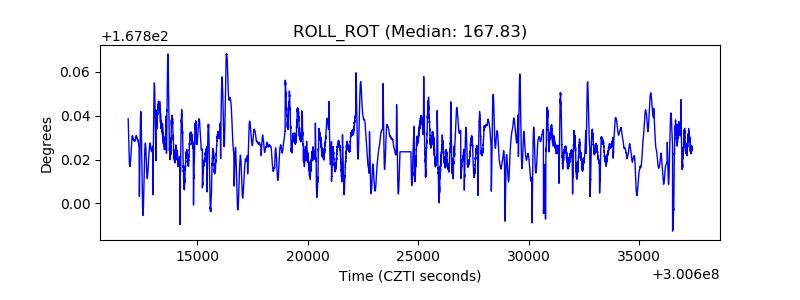 |
| _Roll_DEC | 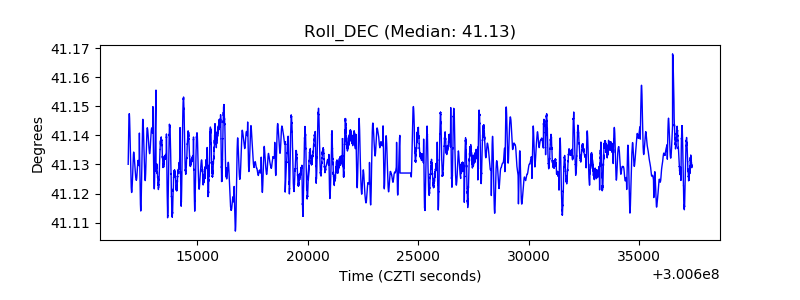 |
| _Roll_RA | 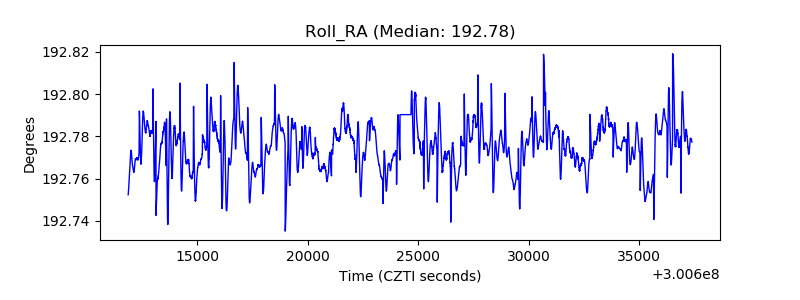 |
| Veto Counter | 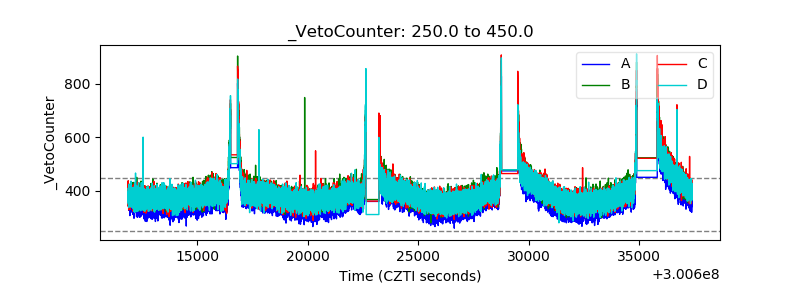 |