| Param | Original file | Final file |
|---|---|---|
| Filename | modeM0/AS1A05_208T03_9000003026_20479cztM0_level2.evt | modeM0/AS1A05_208T03_9000003026_20479cztM0_level2_quad_clean.evt |
| Size (bytes) | 471,481,920 | 84,994,560 |
| Size | 449.6 MB | 81.1 MB |
| Events in quadrant A | 2,987,317 | 557,352 |
| Events in quadrant B | 3,268,701 | 566,251 |
| Events in quadrant C | 2,871,454 | 543,244 |
| Events in quadrant D | 4,754,463 | 498,318 |
| Mode M0 | |||
|---|---|---|---|
| Quadrant | BADHDUFLAG | Total packets | Discarded packets |
| A | 0 | 12739 | 1 |
| B | 0 | 13588 | 1 |
| C | 0 | 12312 | 1 |
| D | 0 | 18154 | 1 |
| Mode SS | |||
|---|---|---|---|
| Quadrant | BADHDUFLAG | Total packets | Discarded packets |
| A | 0 | 118 | 0 |
| B | 0 | 118 | 0 |
| C | 0 | 118 | 0 |
| D | 0 | 118 | 0 |
| Mode M9 | |||
|---|---|---|---|
| Quadrant | BADHDUFLAG | Total packets | Discarded packets |
| A | 0 | 12 | 0 |
| B | 0 | 12 | 0 |
| C | 0 | 12 | 0 |
| D | 0 | 12 | 0 |
| Quadrant | Total seconds | Saturated seconds | Saturation percentage |
|---|---|---|---|
| A | 5848 | 51 | 0.872093% |
| B | 5849 | 49 | 0.837750% |
| C | 5849 | 44 | 0.752265% |
| D | 5849 | 497 | 8.497179% |
Noise dominated data is calculated using 1-second bins in cleaned event files. If a bin has >2000 counts, and if more than 50% of those come from <1% of pixels, then it is considered to be noise-dominated and hence unusable.
| Quadrant | # 1 sec bins | Bins with >0 counts | Bins with >2000 counts | High rate bins dominated by noise | Noise dominated (total time) | Noise dominated (detector-on time) | Marked lightcurve |
|---|---|---|---|---|---|---|---|
| A | 7078 | 5848 | 29 | 29 | 0.41% | 0.50% |  |
| B | 7079 | 5850 | 12 | 12 | 0.17% | 0.21% |  |
| C | 7079 | 5850 | 0 | 0 | 0.00% | 0.00% |  |
| D | 7079 | 5850 | 457 | 457 | 6.46% | 7.81% |  |
Top three noisy pixels from each quadrant. If the there are fewer than three noisy pixels in the level2.evt file, extra rows are filled as -1
| Pixel properties | Quadrant properties | ||||||
|---|---|---|---|---|---|---|---|
| Quadrant | DetID | PixID | Counts | Sigma | Mean | Median | Sigma |
| A | 5 | 16 | 222736 | 1554.02 | 714 | 698 | 142.9 |
| A | 9 | 143 | 8181 | 52.37 | 714 | 698 | 142.9 |
| A | 13 | 254 | 6875 | 43.23 | 714 | 698 | 142.9 |
| B | 0 | 189 | 197007 | 1464.53 | 718 | 702 | 134.0 |
| B | 4 | 216 | 63832 | 470.98 | 718 | 702 | 134.0 |
| B | 0 | 190 | 51154 | 376.4 | 718 | 702 | 134.0 |
| C | 14 | 238 | 108261 | 658.61 | 697 | 701 | 163.3 |
| C | 0 | 207 | 18238 | 107.38 | 697 | 701 | 163.3 |
| C | 8 | 208 | 9265 | 52.44 | 697 | 701 | 163.3 |
| D | 7 | 38 | 1005311 | 6053.95 | 685 | 666 | 165.9 |
| D | 7 | 238 | 379867 | 2285.05 | 685 | 666 | 165.9 |
| D | 1 | 52 | 207161 | 1244.33 | 685 | 666 | 165.9 |
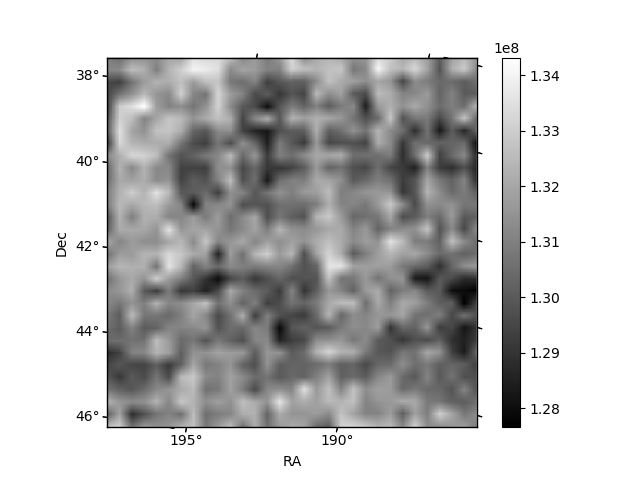
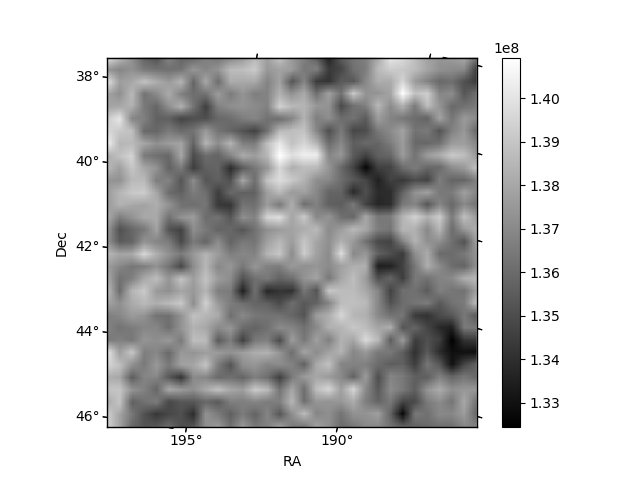
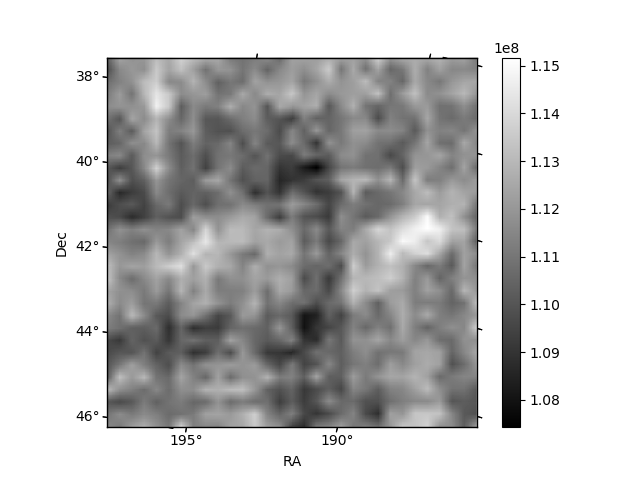
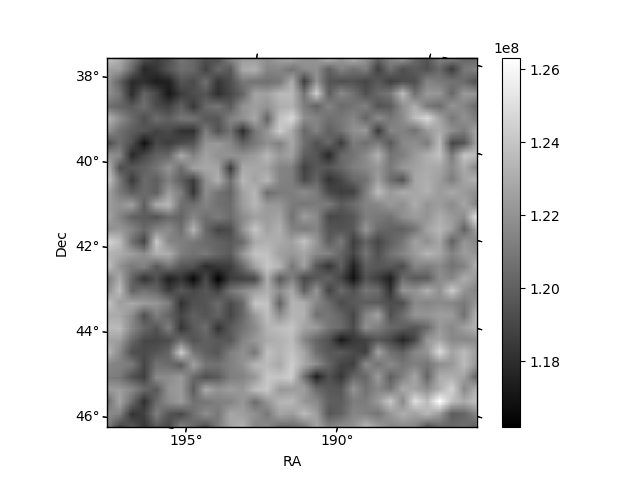
Histogram calculated using DETX and DETY for each event in the final _common_clean file
| Quadrant A |  |
 |
Quadrant B |
|---|---|---|---|
| Quadrant D | 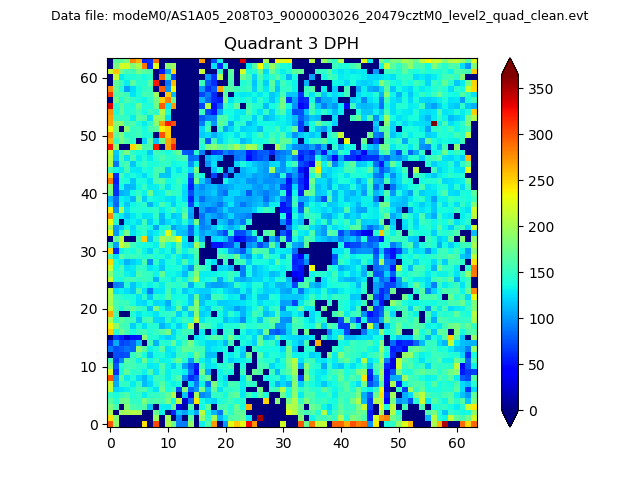 |
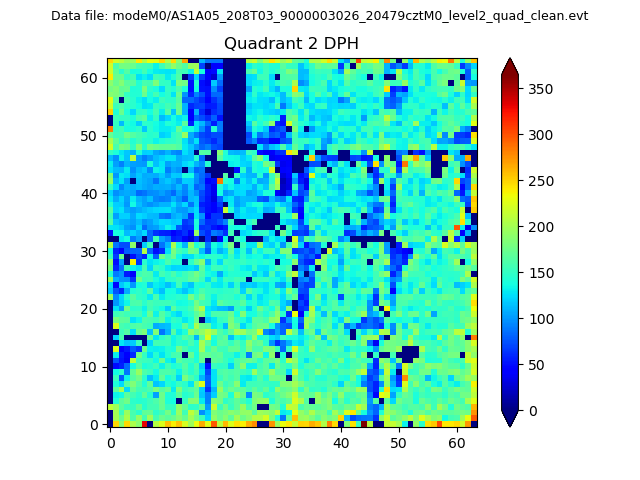 |
Quadrant C |
| Plot type | Count rate plots | Images |
|---|---|---|
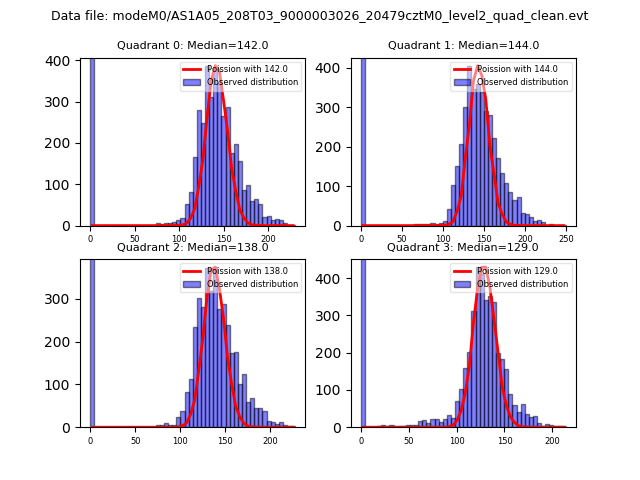
| Comparison with Poisson distribution Blue bars denote a histogram of data divided into 1 sec bins. Red curve is a Poisson curve with rate = median count rate of data. |
 |
 |
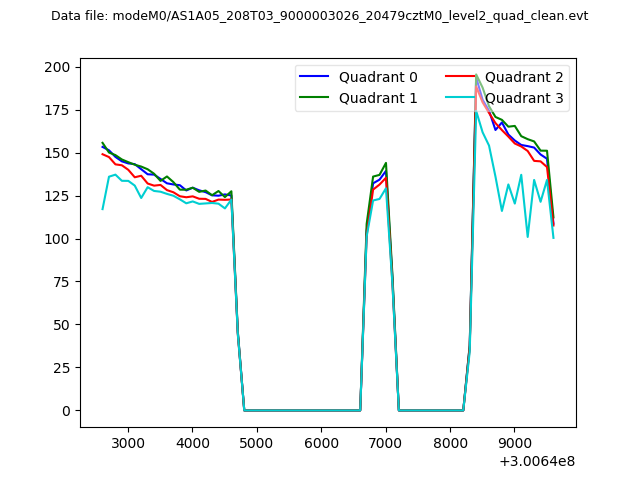
| Quadrant-wise count rates Data is divided into 100 sec bins |
 |
|
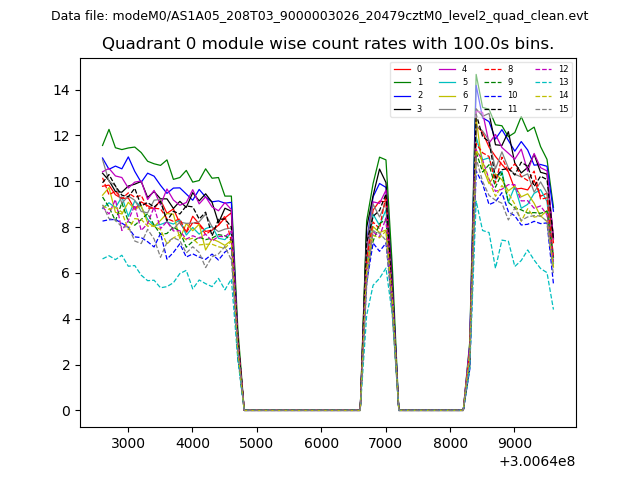
| Module-wise count rates for Quadrant A Data is divided into 100 sec bins |
 |
 |
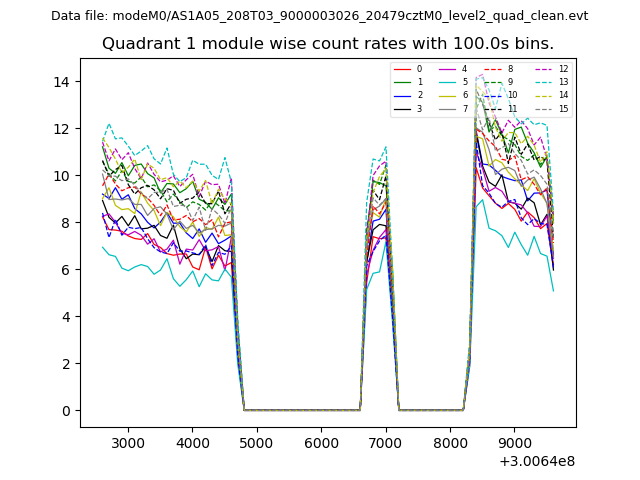
| Module-wise count rates for Quadrant B Data is divided into 100 sec bins |
 |
 |
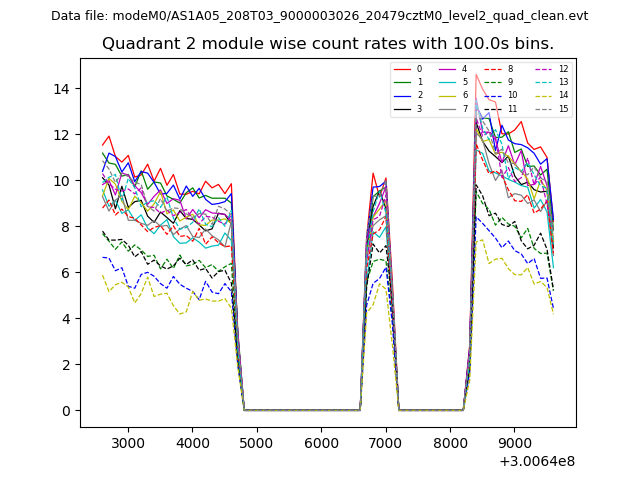
| Module-wise count rates for Quadrant C Data is divided into 100 sec bins |
 |
 |
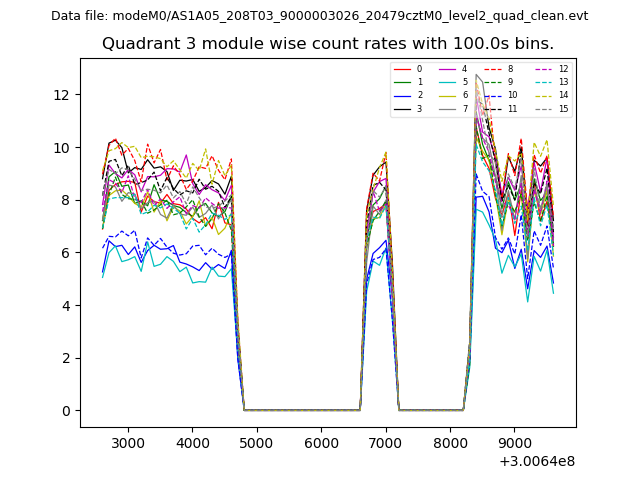
| Module-wise count rates for Quadrant D Data is divided into 100 sec bins |
 |
 |
| Parameter | Plot |
|---|---|
| CZT HV Monitor | 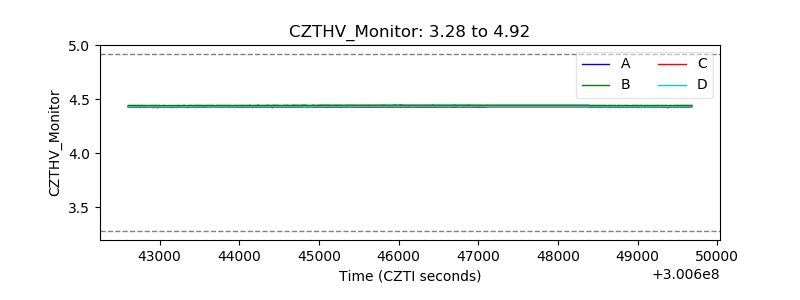 |
| D_VDD | 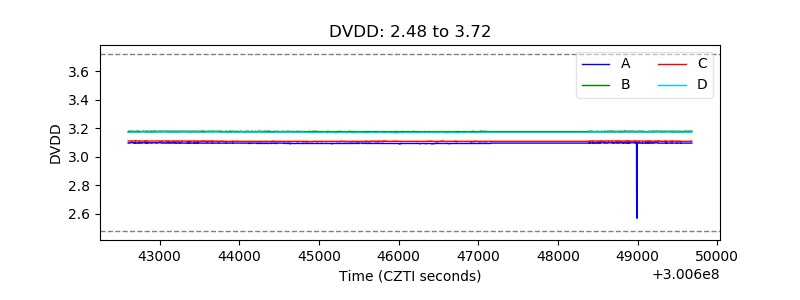 |
| Temperature 1 | 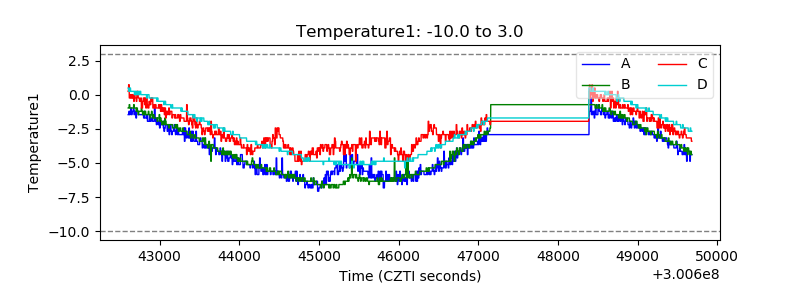 |
| Veto HV Monitor | 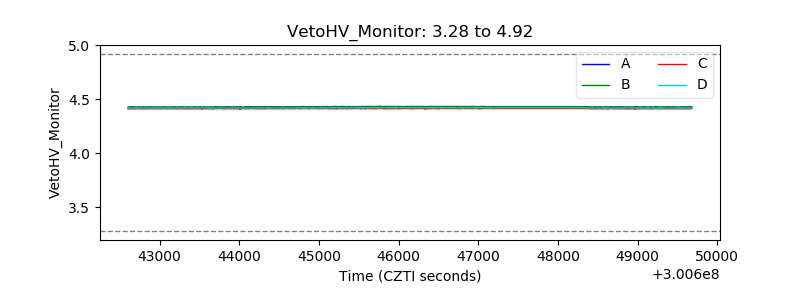 |
| Veto LLD |  |
| Alpha Counter | 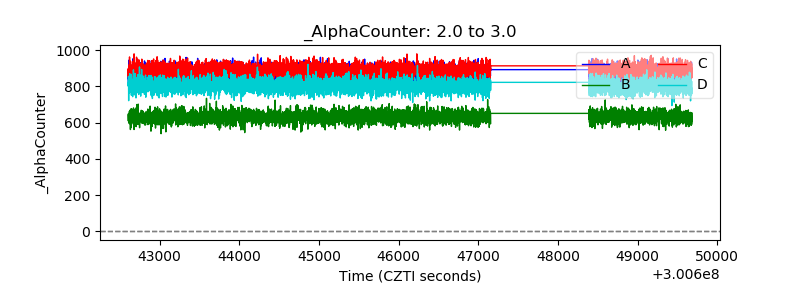 |
| _CPM_Rate | 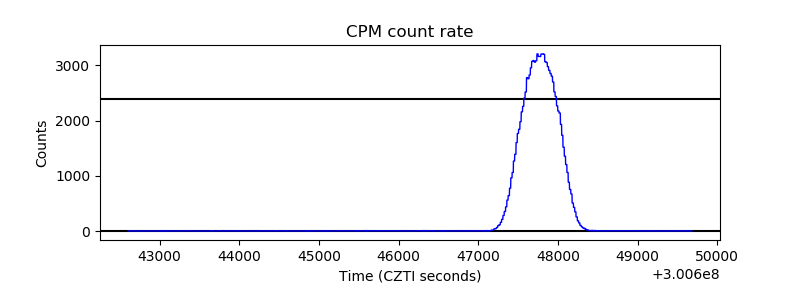 |
| CZT Counter | 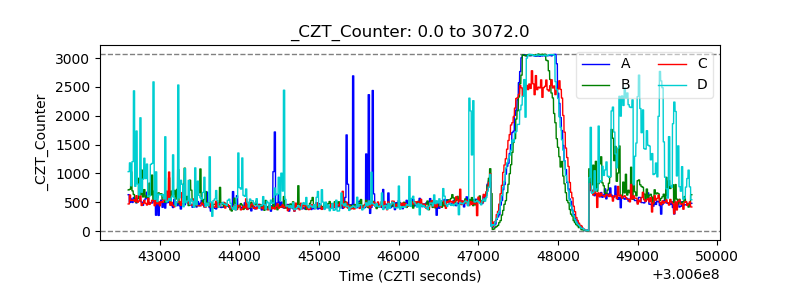 |
| +2.5 Volts monitor |  |
| +5 Volts monitor | 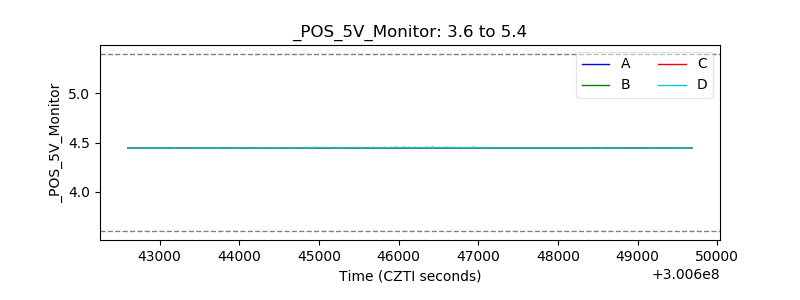 |
| _ROLL_ROT | 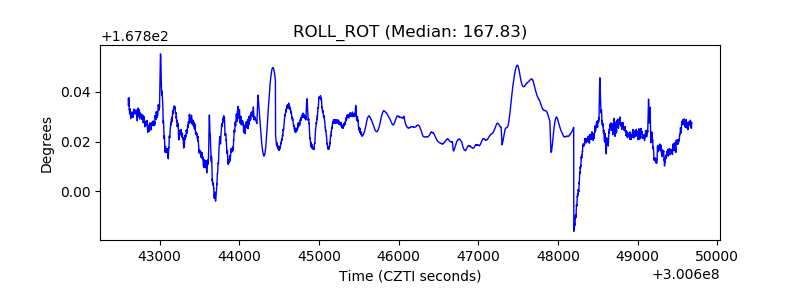 |
| _Roll_DEC | 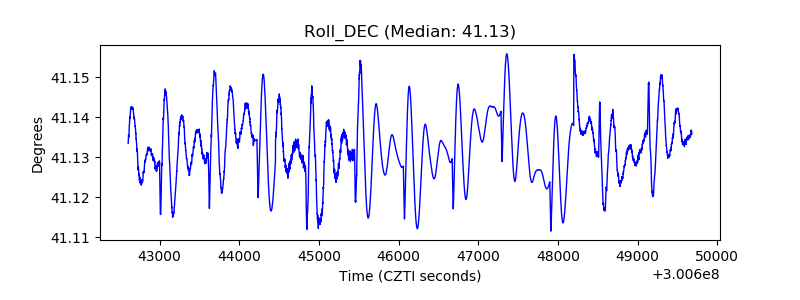 |
| _Roll_RA |  |
| Veto Counter | 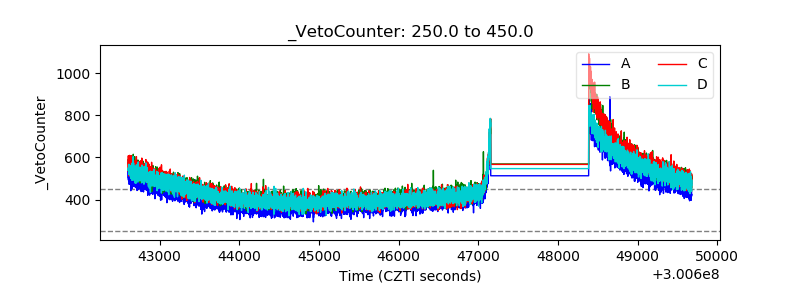 |