| Param | Original file | Final file |
|---|---|---|
| Filename | modeM0/AS1A05_208T03_9000003026_20480cztM0_level2.evt | modeM0/AS1A05_208T03_9000003026_20480cztM0_level2_quad_clean.evt |
| Size (bytes) | 565,185,600 | 96,076,800 |
| Size | 539.0 MB | 91.6 MB |
| Events in quadrant A | 3,248,071 | 641,578 |
| Events in quadrant B | 3,547,527 | 658,640 |
| Events in quadrant C | 3,168,297 | 629,536 |
| Events in quadrant D | 6,736,139 | 550,220 |
| Mode M0 | |||
|---|---|---|---|
| Quadrant | BADHDUFLAG | Total packets | Discarded packets |
| A | 0 | 13590 | 2 |
| B | 0 | 14518 | 2 |
| C | 0 | 13336 | 2 |
| D | 0 | 24213 | 5 |
| Mode SS | |||
|---|---|---|---|
| Quadrant | BADHDUFLAG | Total packets | Discarded packets |
| A | 0 | 126 | 0 |
| B | 0 | 126 | 0 |
| C | 0 | 126 | 0 |
| D | 0 | 126 | 0 |
| Mode M9 | |||
|---|---|---|---|
| Quadrant | BADHDUFLAG | Total packets | Discarded packets |
| A | 0 | 13 | 0 |
| B | 0 | 14 | 0 |
| C | 0 | 14 | 0 |
| D | 0 | 14 | 0 |
| Quadrant | Total seconds | Saturated seconds | Saturation percentage |
|---|---|---|---|
| A | 6147 | 50 | 0.813405% |
| B | 6147 | 57 | 0.927282% |
| C | 6147 | 67 | 1.089963% |
| D | 6146 | 1200 | 19.524894% |
Noise dominated data is calculated using 1-second bins in cleaned event files. If a bin has >2000 counts, and if more than 50% of those come from <1% of pixels, then it is considered to be noise-dominated and hence unusable.
| Quadrant | # 1 sec bins | Bins with >0 counts | Bins with >2000 counts | High rate bins dominated by noise | Noise dominated (total time) | Noise dominated (detector-on time) | Marked lightcurve |
|---|---|---|---|---|---|---|---|
| A | 7467 | 6147 | 27 | 27 | 0.36% | 0.44% |  |
| B | 7467 | 6148 | 11 | 11 | 0.15% | 0.18% | 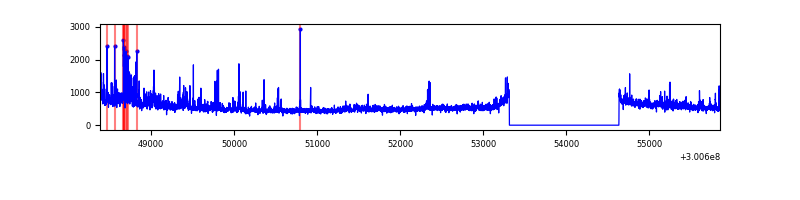 |
| C | 7467 | 6147 | 1 | 1 | 0.01% | 0.02% | 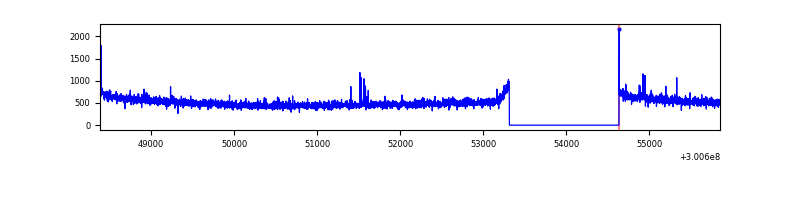 |
| D | 7466 | 6146 | 1143 | 1143 | 15.31% | 18.60% |  |
Top three noisy pixels from each quadrant. If the there are fewer than three noisy pixels in the level2.evt file, extra rows are filled as -1
| Pixel properties | Quadrant properties | ||||||
|---|---|---|---|---|---|---|---|
| Quadrant | DetID | PixID | Counts | Sigma | Mean | Median | Sigma |
| A | 5 | 16 | 192581 | 1226.16 | 784 | 768 | 156.4 |
| A | 9 | 143 | 20036 | 123.17 | 784 | 768 | 156.4 |
| A | 13 | 254 | 8494 | 49.39 | 784 | 768 | 156.4 |
| B | 0 | 189 | 147868 | 1003.23 | 794 | 777 | 146.6 |
| B | 0 | 190 | 58634 | 394.61 | 794 | 777 | 146.6 |
| B | 4 | 216 | 54747 | 368.1 | 794 | 777 | 146.6 |
| C | 14 | 238 | 119637 | 670.91 | 767 | 775 | 177.2 |
| C | 7 | 220 | 19269 | 104.39 | 767 | 775 | 177.2 |
| C | 0 | 207 | 12574 | 66.6 | 767 | 775 | 177.2 |
| D | 1 | 52 | 1642998 | 9368.92 | 716 | 696 | 175.3 |
| D | 7 | 38 | 1616648 | 9218.6 | 716 | 696 | 175.3 |
| D | 7 | 238 | 158097 | 897.93 | 716 | 696 | 175.3 |
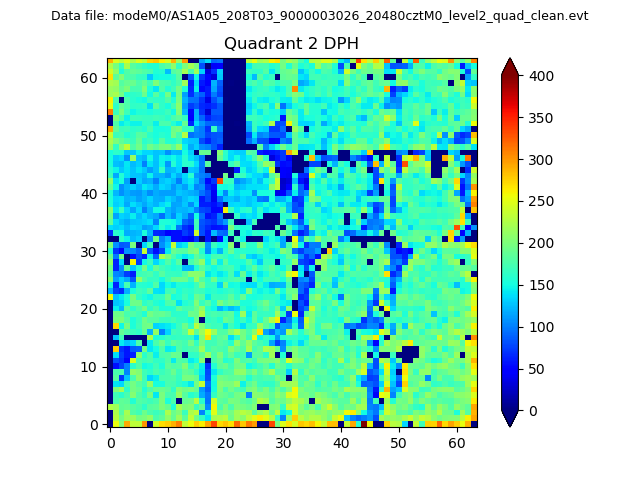
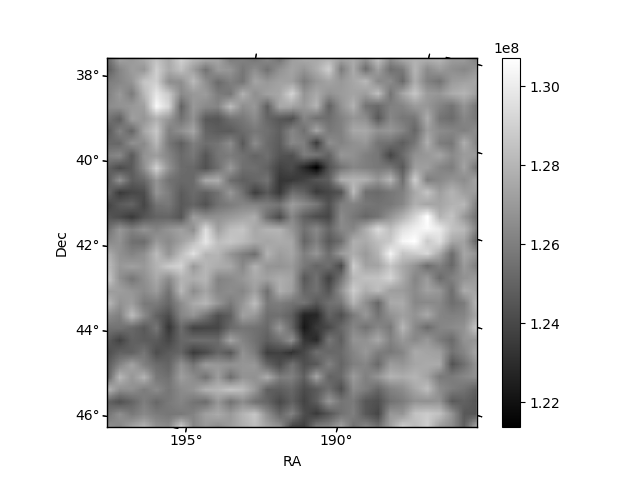
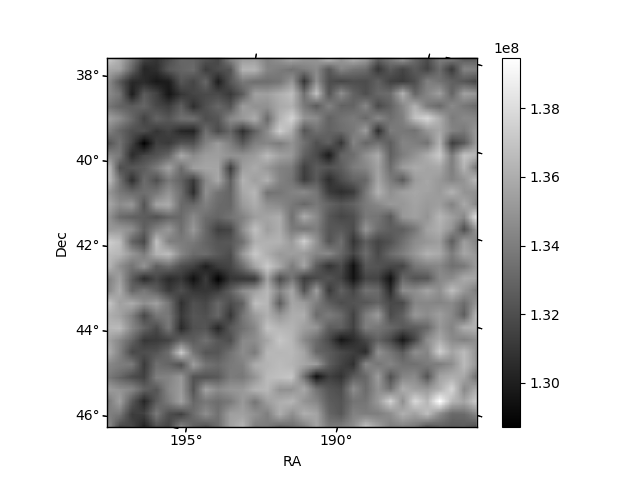
Histogram calculated using DETX and DETY for each event in the final _common_clean file
| Quadrant A | 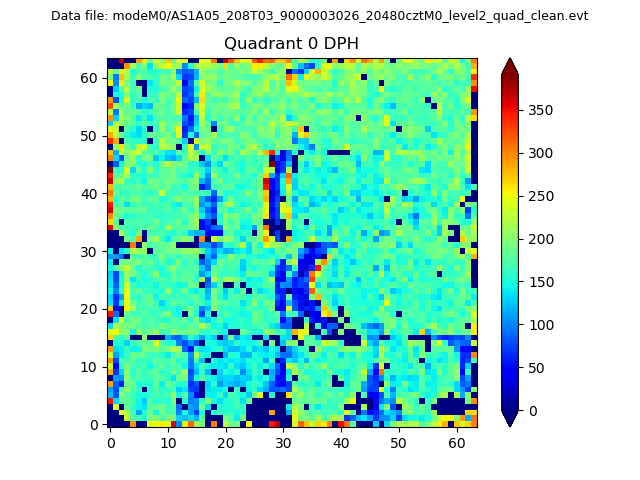 |
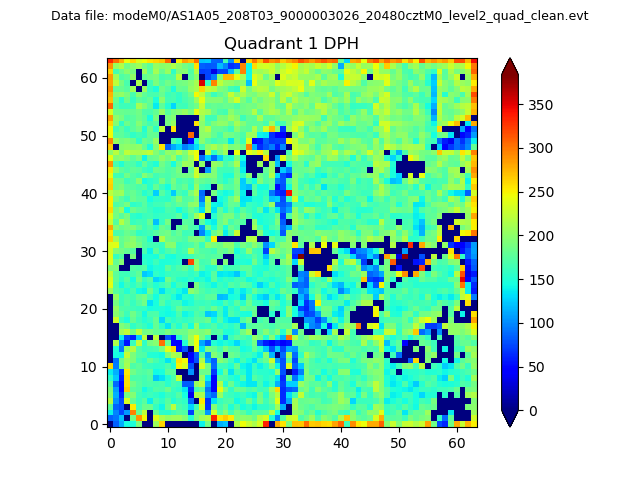 |
Quadrant B |
|---|---|---|---|
| Quadrant D | 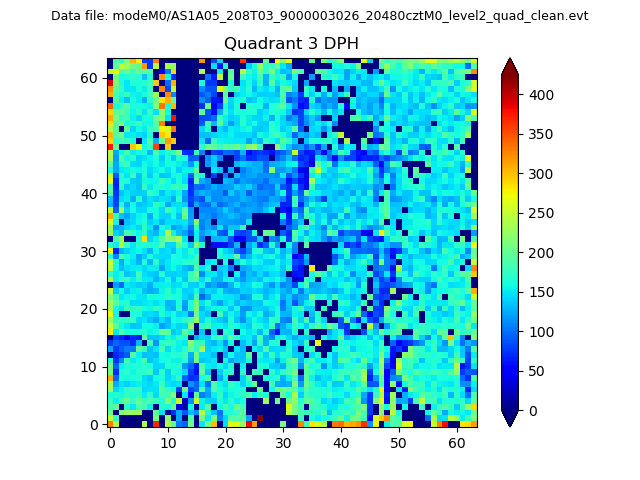 |
 |
Quadrant C |
| Plot type | Count rate plots | Images |
|---|---|---|
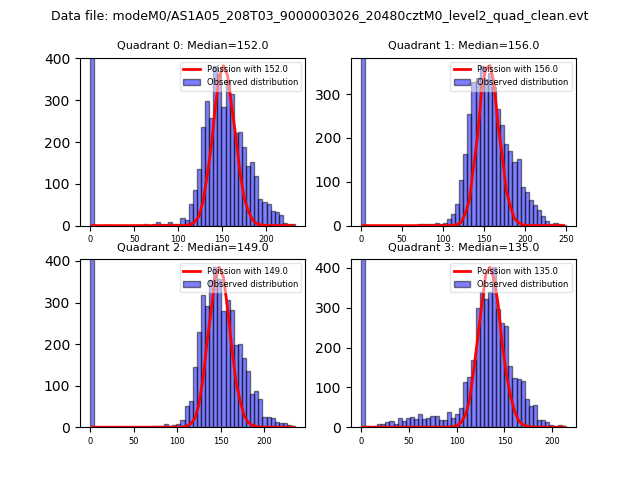
| Comparison with Poisson distribution Blue bars denote a histogram of data divided into 1 sec bins. Red curve is a Poisson curve with rate = median count rate of data. |
 |
 |
| Quadrant-wise count rates Data is divided into 100 sec bins |
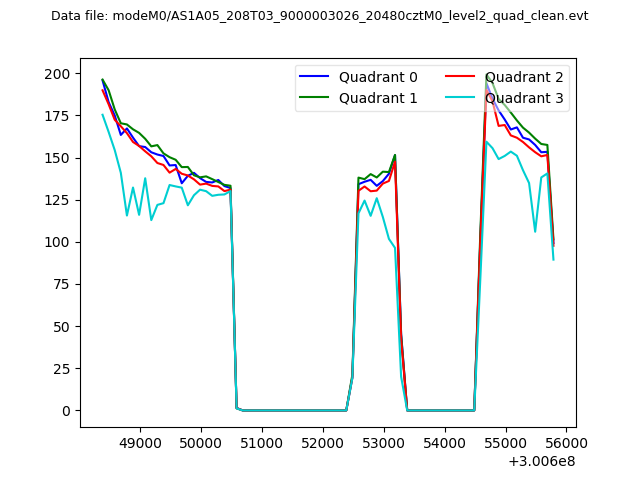 |
|
| Module-wise count rates for Quadrant A Data is divided into 100 sec bins |
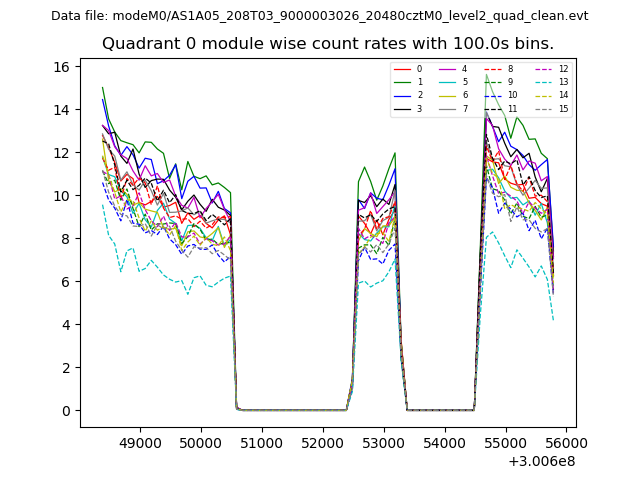 |
 |
| Module-wise count rates for Quadrant B Data is divided into 100 sec bins |
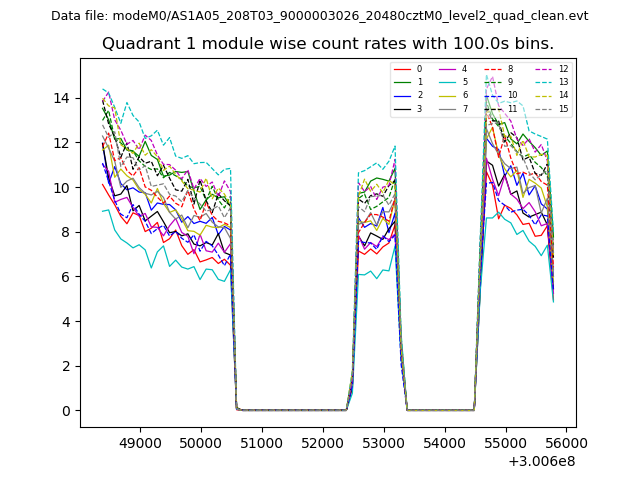 |
 |
| Module-wise count rates for Quadrant C Data is divided into 100 sec bins |
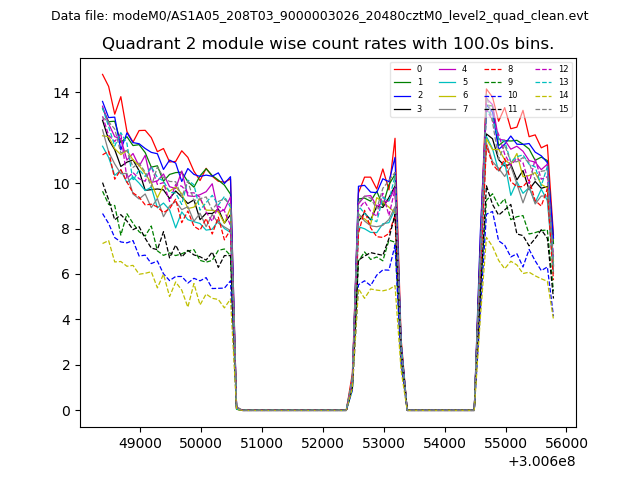 |
 |
| Module-wise count rates for Quadrant D Data is divided into 100 sec bins |
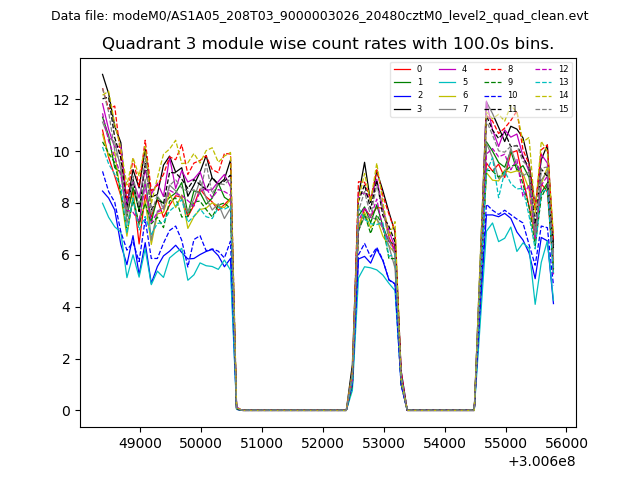 |
 |
| Parameter | Plot |
|---|---|
| CZT HV Monitor | 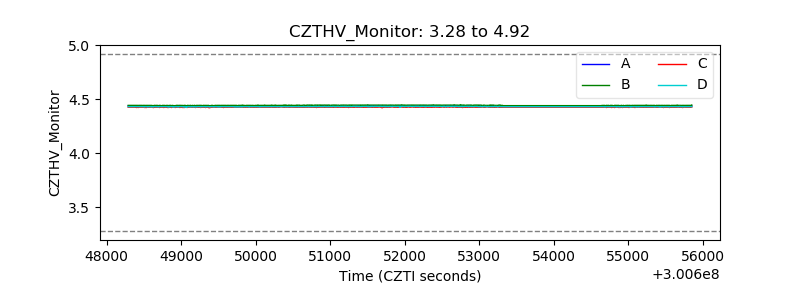 |
| D_VDD |  |
| Temperature 1 | 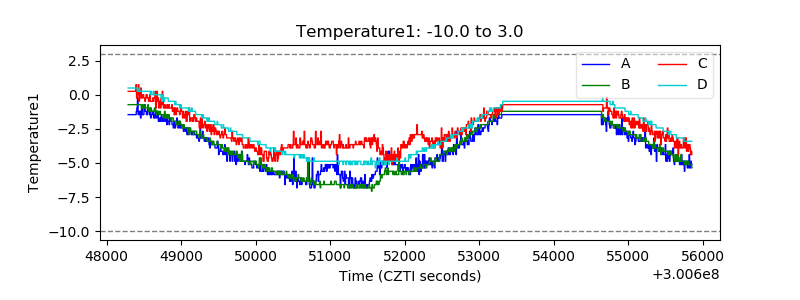 |
| Veto HV Monitor |  |
| Veto LLD | 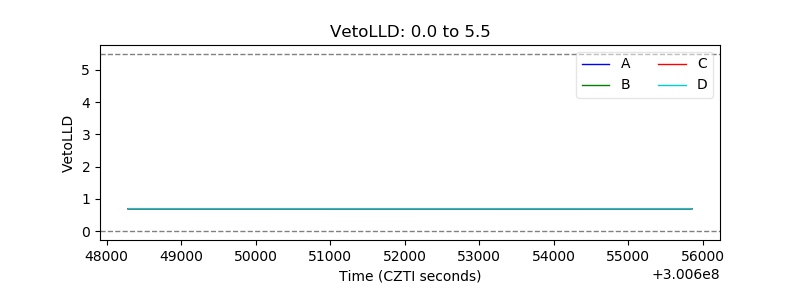 |
| Alpha Counter | 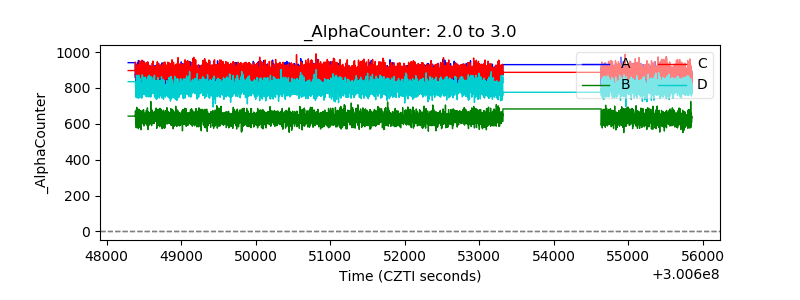 |
| _CPM_Rate |  |
| CZT Counter | 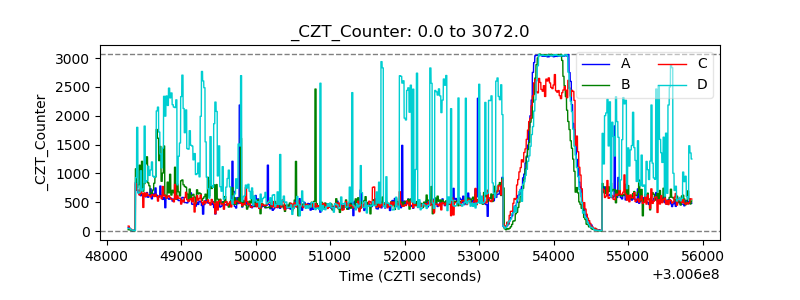 |
| +2.5 Volts monitor |  |
| +5 Volts monitor |  |
| _ROLL_ROT | 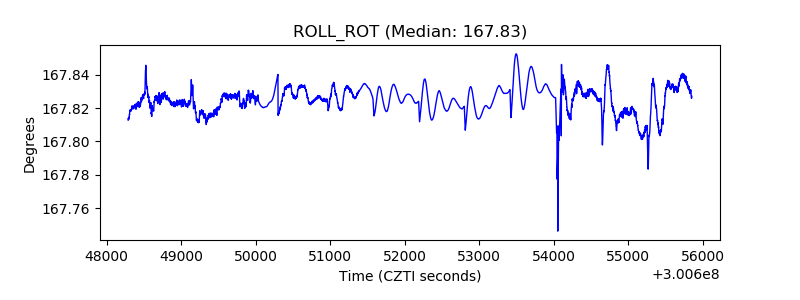 |
| _Roll_DEC | 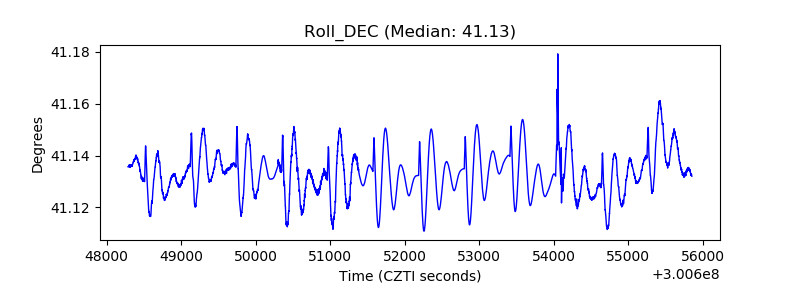 |
| _Roll_RA | 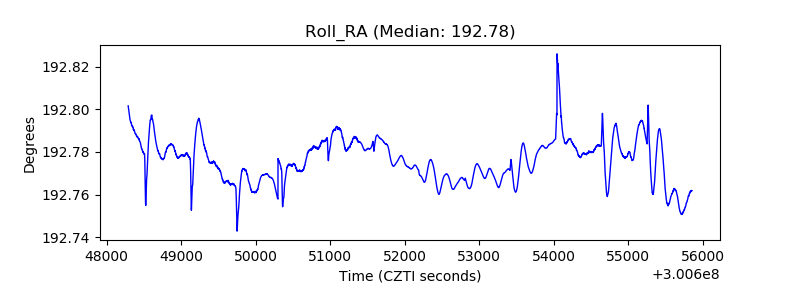 |
| Veto Counter | 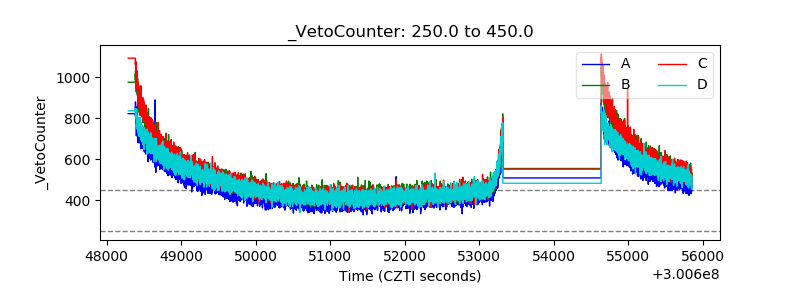 |