| Param | Original file | Final file |
|---|---|---|
| Filename | modeM0/AS1A05_208T03_9000003026_20481cztM0_level2.evt | modeM0/AS1A05_208T03_9000003026_20481cztM0_level2_quad_clean.evt |
| Size (bytes) | 530,565,120 | 98,242,560 |
| Size | 506.0 MB | 93.7 MB |
| Events in quadrant A | 3,193,467 | 655,641 |
| Events in quadrant B | 3,513,655 | 673,452 |
| Events in quadrant C | 3,242,396 | 640,325 |
| Events in quadrant D | 5,700,229 | 574,524 |
| Mode M0 | |||
|---|---|---|---|
| Quadrant | BADHDUFLAG | Total packets | Discarded packets |
| A | 0 | 13318 | 2 |
| B | 0 | 14326 | 2 |
| C | 0 | 13450 | 2 |
| D | 0 | 21116 | 2 |
| Mode SS | |||
|---|---|---|---|
| Quadrant | BADHDUFLAG | Total packets | Discarded packets |
| A | 0 | 126 | 0 |
| B | 0 | 126 | 0 |
| C | 0 | 126 | 0 |
| D | 0 | 126 | 0 |
| Mode M9 | |||
|---|---|---|---|
| Quadrant | BADHDUFLAG | Total packets | Discarded packets |
| A | 0 | 14 | 0 |
| B | 0 | 15 | 0 |
| C | 0 | 15 | 0 |
| D | 0 | 15 | 0 |
| Quadrant | Total seconds | Saturated seconds | Saturation percentage |
|---|---|---|---|
| A | 6175 | 36 | 0.582996% |
| B | 6175 | 71 | 1.149798% |
| C | 6175 | 55 | 0.890688% |
| D | 6174 | 519 | 8.406220% |
Noise dominated data is calculated using 1-second bins in cleaned event files. If a bin has >2000 counts, and if more than 50% of those come from <1% of pixels, then it is considered to be noise-dominated and hence unusable.
| Quadrant | # 1 sec bins | Bins with >0 counts | Bins with >2000 counts | High rate bins dominated by noise | Noise dominated (total time) | Noise dominated (detector-on time) | Marked lightcurve |
|---|---|---|---|---|---|---|---|
| A | 7575 | 6176 | 12 | 12 | 0.16% | 0.19% | 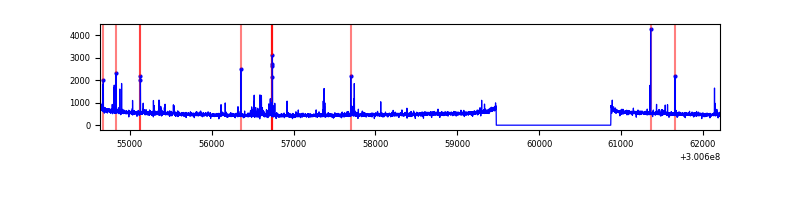 |
| B | 7575 | 6176 | 9 | 9 | 0.12% | 0.15% | 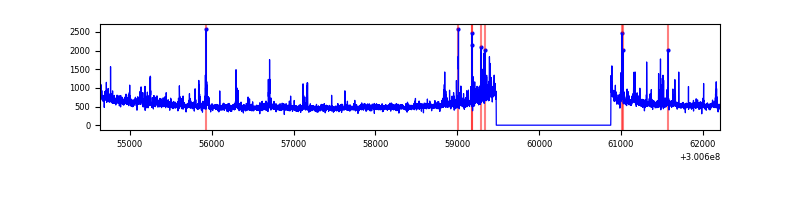 |
| C | 7575 | 6175 | 2 | 2 | 0.03% | 0.03% |  |
| D | 7573 | 6173 | 526 | 526 | 6.95% | 8.52% | 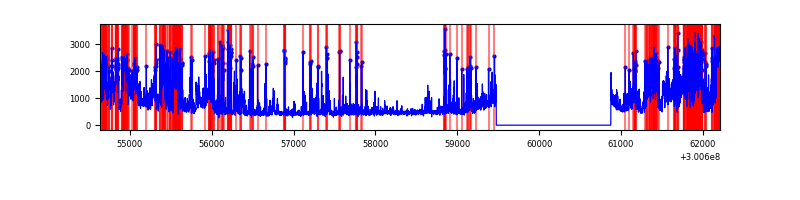 |
Top three noisy pixels from each quadrant. If the there are fewer than three noisy pixels in the level2.evt file, extra rows are filled as -1
| Pixel properties | Quadrant properties | ||||||
|---|---|---|---|---|---|---|---|
| Quadrant | DetID | PixID | Counts | Sigma | Mean | Median | Sigma |
| A | 5 | 16 | 100870 | 630.0 | 794 | 780 | 158.9 |
| A | 9 | 143 | 29395 | 180.11 | 794 | 780 | 158.9 |
| A | 0 | 226 | 6921 | 38.65 | 794 | 780 | 158.9 |
| B | 0 | 189 | 138255 | 922.84 | 806 | 788 | 149.0 |
| B | 7 | 220 | 68037 | 451.45 | 806 | 788 | 149.0 |
| B | 0 | 197 | 46283 | 305.41 | 806 | 788 | 149.0 |
| C | 14 | 238 | 123020 | 678.85 | 777 | 785 | 180.1 |
| C | 9 | 221 | 64013 | 351.15 | 777 | 785 | 180.1 |
| C | 9 | 54 | 12571 | 65.46 | 777 | 785 | 180.1 |
| D | 7 | 38 | 855549 | 4717.31 | 751 | 731 | 181.2 |
| D | 1 | 52 | 844973 | 4658.94 | 751 | 731 | 181.2 |
| D | 5 | 222 | 283787 | 1562.04 | 751 | 731 | 181.2 |
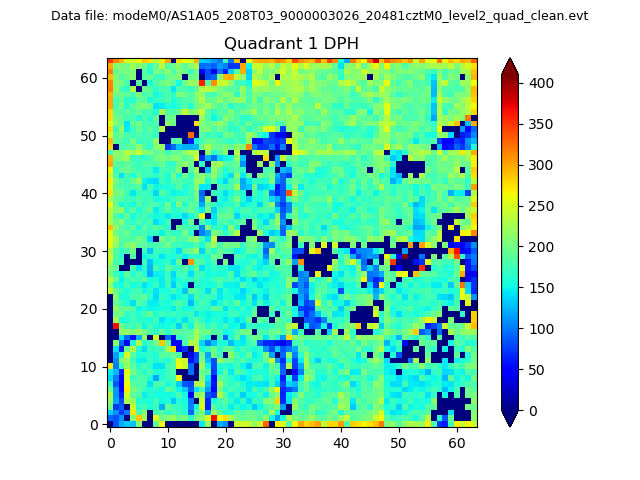
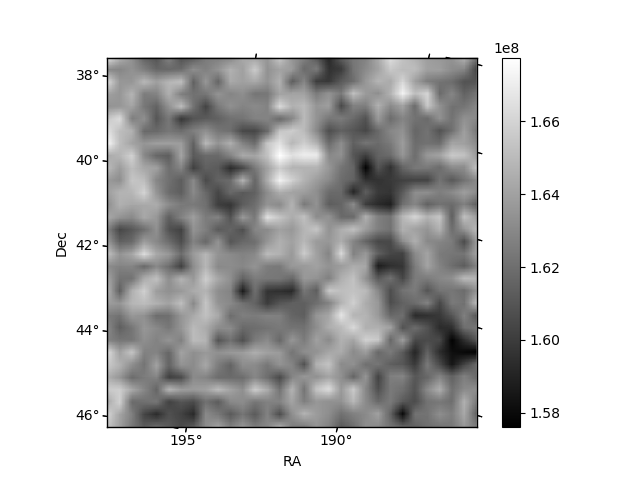
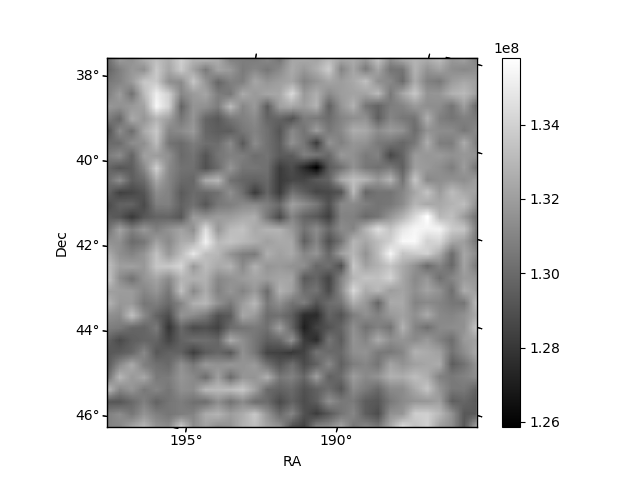
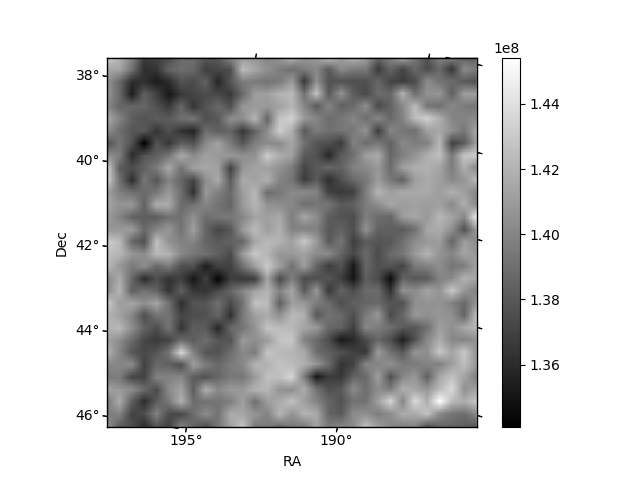
Histogram calculated using DETX and DETY for each event in the final _common_clean file
| Quadrant A | 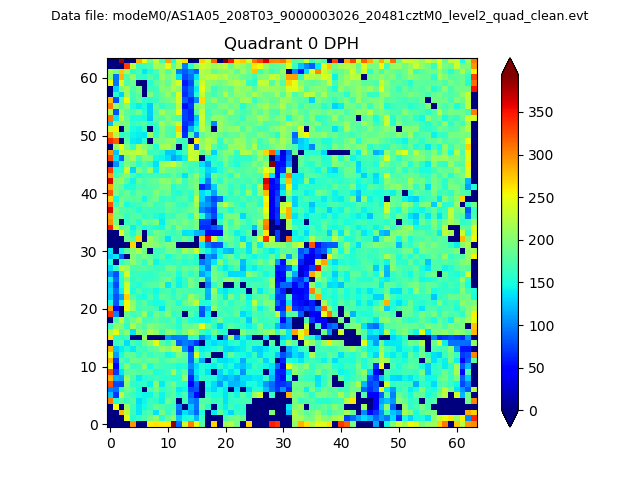 |
 |
Quadrant B |
|---|---|---|---|
| Quadrant D | 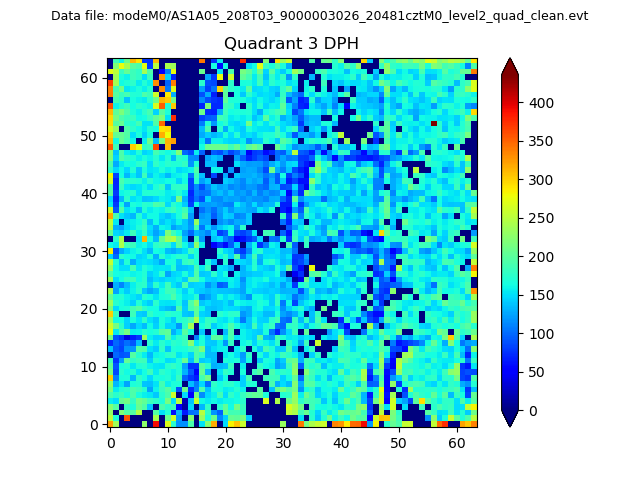 |
 |
Quadrant C |
| Plot type | Count rate plots | Images |
|---|---|---|
| Comparison with Poisson distribution Blue bars denote a histogram of data divided into 1 sec bins. Red curve is a Poisson curve with rate = median count rate of data. |
 |
 |
| Quadrant-wise count rates Data is divided into 100 sec bins |
 |
|
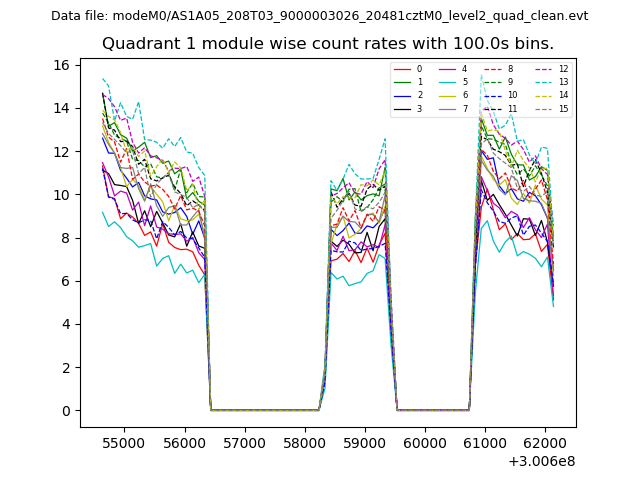
| Module-wise count rates for Quadrant A Data is divided into 100 sec bins |
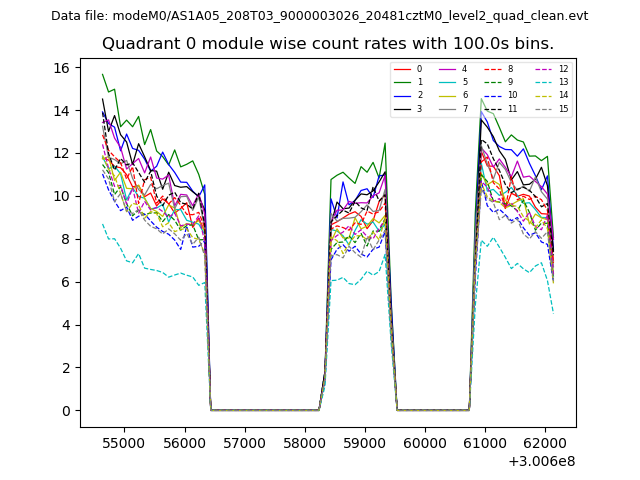 |
 |
| Module-wise count rates for Quadrant B Data is divided into 100 sec bins |
 |
 |
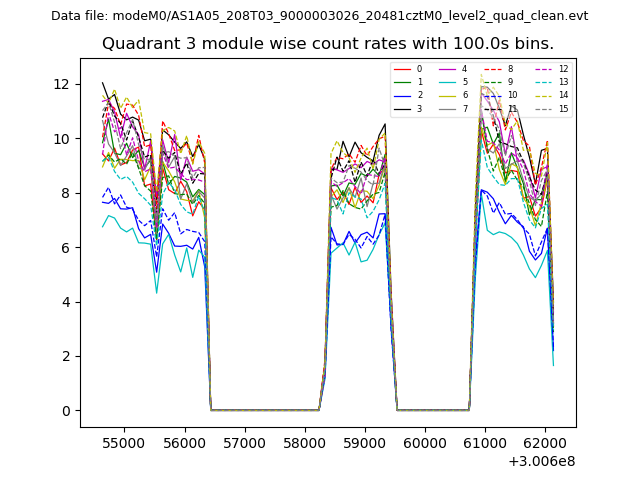
| Module-wise count rates for Quadrant C Data is divided into 100 sec bins |
 |
 |
| Module-wise count rates for Quadrant D Data is divided into 100 sec bins |
 |
 |
| Parameter | Plot |
|---|---|
| CZT HV Monitor | 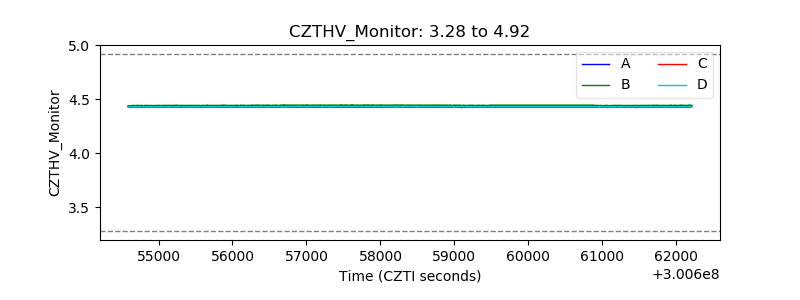 |
| D_VDD | 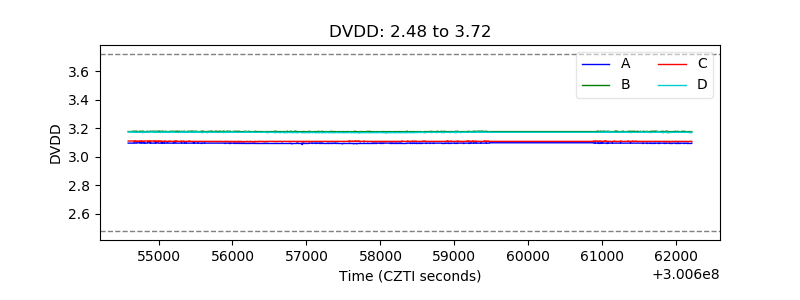 |
| Temperature 1 | 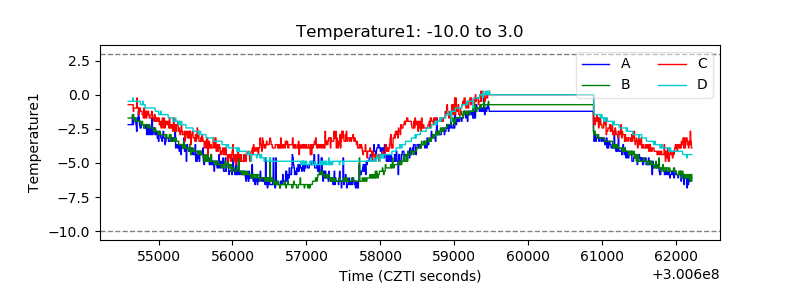 |
| Veto HV Monitor | 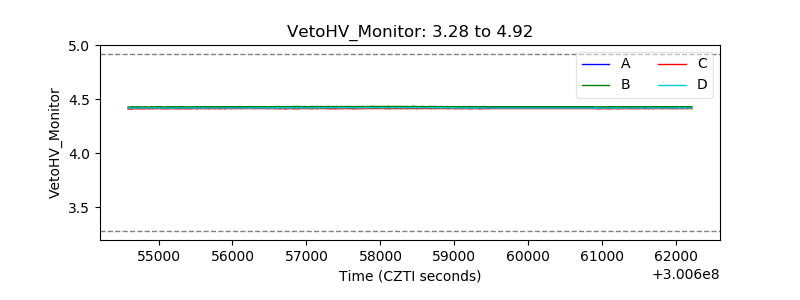 |
| Veto LLD |  |
| Alpha Counter | 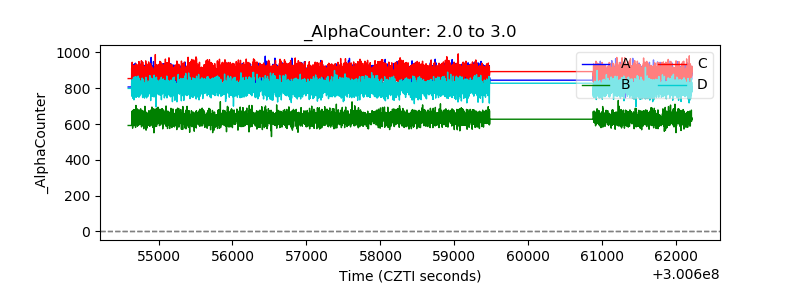 |
| _CPM_Rate | 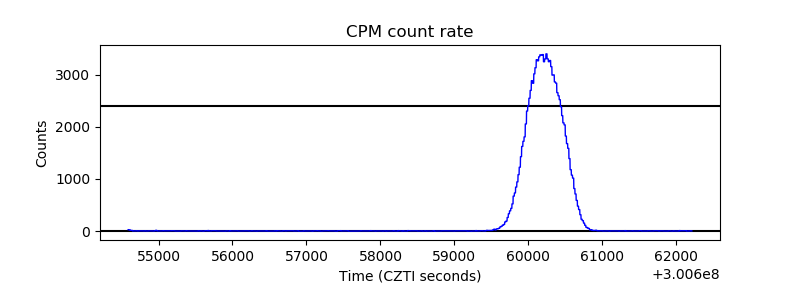 |
| CZT Counter |  |
| +2.5 Volts monitor |  |
| +5 Volts monitor |  |
| _ROLL_ROT | 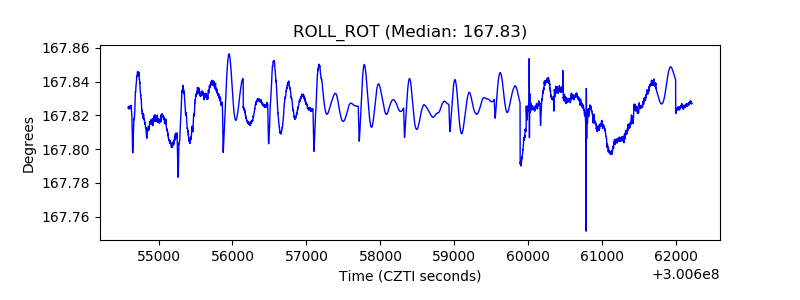 |
| _Roll_DEC | 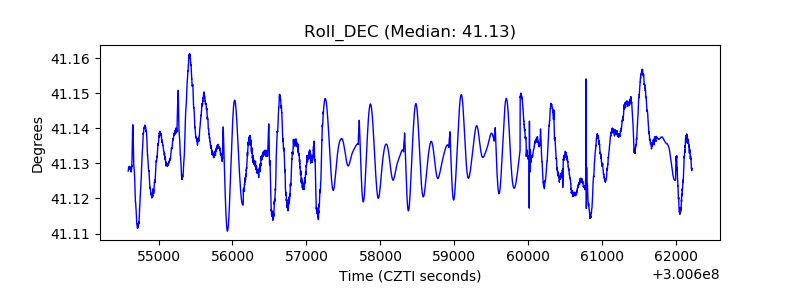 |
| _Roll_RA | 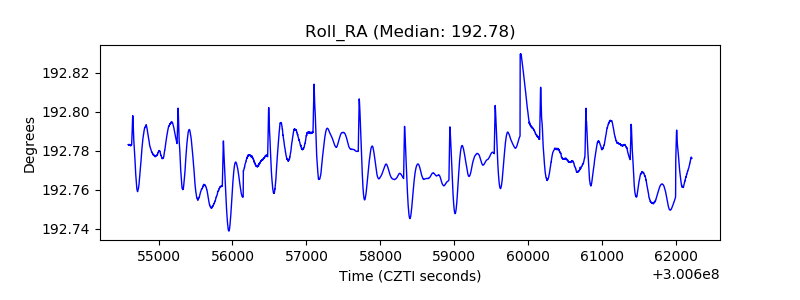 |
| Veto Counter | 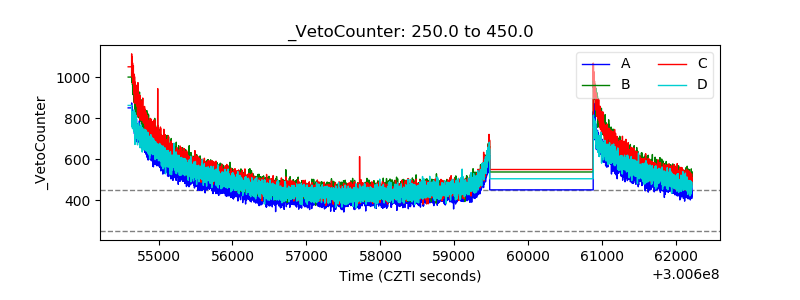 |