| Param | Original file | Final file |
|---|---|---|
| Filename | modeM0/AS1A05_208T03_9000003026_20483cztM0_level2.evt | modeM0/AS1A05_208T03_9000003026_20483cztM0_level2_quad_clean.evt |
| Size (bytes) | 485,565,120 | 81,930,240 |
| Size | 463.1 MB | 78.1 MB |
| Events in quadrant A | 3,139,997 | 524,246 |
| Events in quadrant B | 3,681,384 | 528,588 |
| Events in quadrant C | 3,224,400 | 507,405 |
| Events in quadrant D | 4,230,437 | 479,439 |
| Mode M0 | |||
|---|---|---|---|
| Quadrant | BADHDUFLAG | Total packets | Discarded packets |
| A | 0 | 13316 | 2 |
| B | 0 | 14934 | 2 |
| C | 0 | 13346 | 2 |
| D | 0 | 16908 | 2 |
| Mode SS | |||
|---|---|---|---|
| Quadrant | BADHDUFLAG | Total packets | Discarded packets |
| A | 0 | 128 | 0 |
| B | 0 | 128 | 0 |
| C | 0 | 128 | 0 |
| D | 0 | 128 | 0 |
| Mode M9 | |||
|---|---|---|---|
| Quadrant | BADHDUFLAG | Total packets | Discarded packets |
| A | 0 | 20 | 0 |
| B | 0 | 21 | 0 |
| C | 0 | 21 | 0 |
| D | 0 | 21 | 0 |
| Quadrant | Total seconds | Saturated seconds | Saturation percentage |
|---|---|---|---|
| A | 6323 | 50 | 0.790764% |
| B | 6323 | 200 | 3.163056% |
| C | 6323 | 84 | 1.328483% |
| D | 6323 | 205 | 3.242132% |
Noise dominated data is calculated using 1-second bins in cleaned event files. If a bin has >2000 counts, and if more than 50% of those come from <1% of pixels, then it is considered to be noise-dominated and hence unusable.
| Quadrant | # 1 sec bins | Bins with >0 counts | Bins with >2000 counts | High rate bins dominated by noise | Noise dominated (total time) | Noise dominated (detector-on time) | Marked lightcurve |
|---|---|---|---|---|---|---|---|
| A | 7558 | 6324 | 11 | 11 | 0.15% | 0.17% | 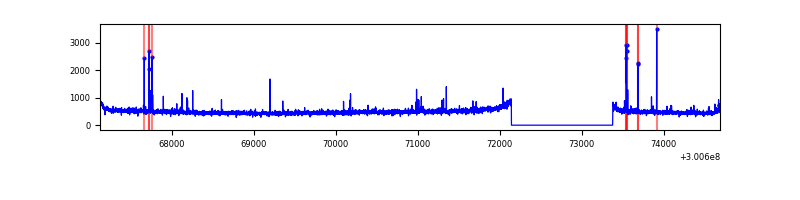 |
| B | 7558 | 6323 | 32 | 32 | 0.42% | 0.51% | 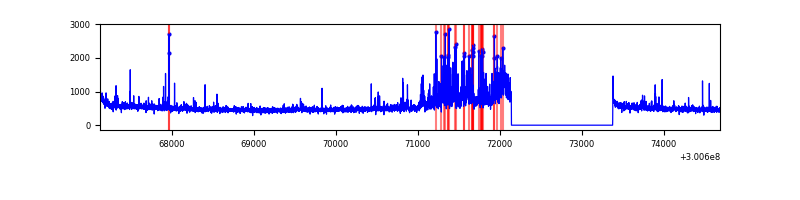 |
| C | 7558 | 6323 | 0 | 0 | 0.00% | 0.00% | 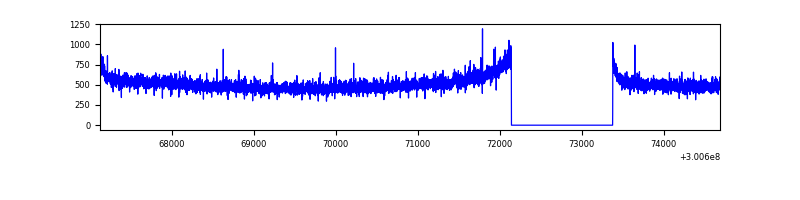 |
| D | 7558 | 6324 | 196 | 196 | 2.59% | 3.10% | 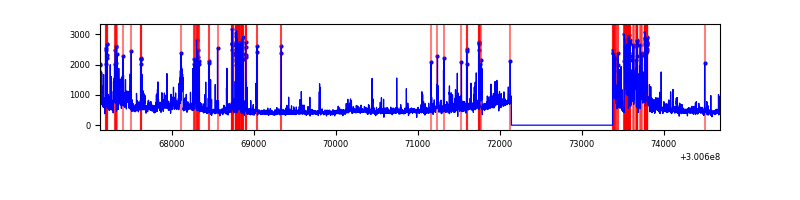 |
Top three noisy pixels from each quadrant. If the there are fewer than three noisy pixels in the level2.evt file, extra rows are filled as -1
| Pixel properties | Quadrant properties | ||||||
|---|---|---|---|---|---|---|---|
| Quadrant | DetID | PixID | Counts | Sigma | Mean | Median | Sigma |
| A | 5 | 16 | 68926 | 428.58 | 790 | 773 | 159.0 |
| A | 9 | 143 | 26259 | 160.27 | 790 | 773 | 159.0 |
| A | 0 | 226 | 6944 | 38.81 | 790 | 773 | 159.0 |
| B | 7 | 220 | 230397 | 1542.47 | 791 | 769 | 148.9 |
| B | 0 | 197 | 155953 | 1042.41 | 791 | 769 | 148.9 |
| B | 0 | 189 | 141866 | 947.79 | 791 | 769 | 148.9 |
| C | 14 | 238 | 120987 | 678.33 | 762 | 766 | 177.2 |
| C | 3 | 233 | 111875 | 626.91 | 762 | 766 | 177.2 |
| C | 9 | 221 | 18195 | 98.34 | 762 | 766 | 177.2 |
| D | 1 | 52 | 636192 | 3463.95 | 755 | 733 | 183.4 |
| D | 5 | 222 | 283527 | 1541.54 | 755 | 733 | 183.4 |
| D | 7 | 238 | 174347 | 946.39 | 755 | 733 | 183.4 |
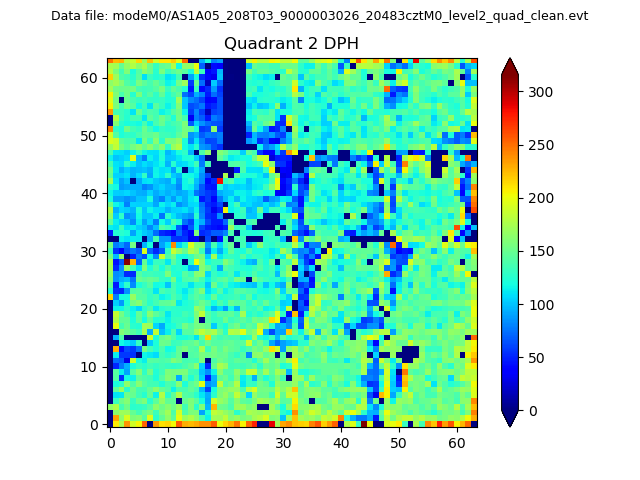
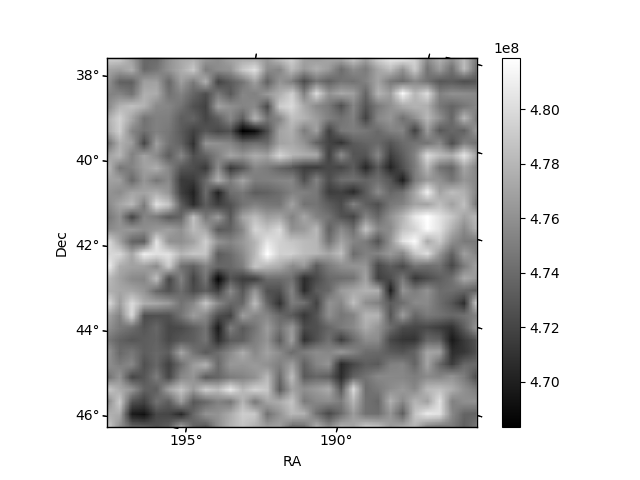
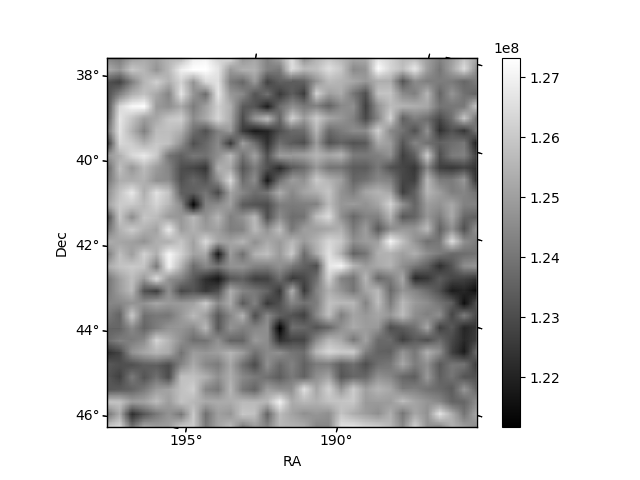
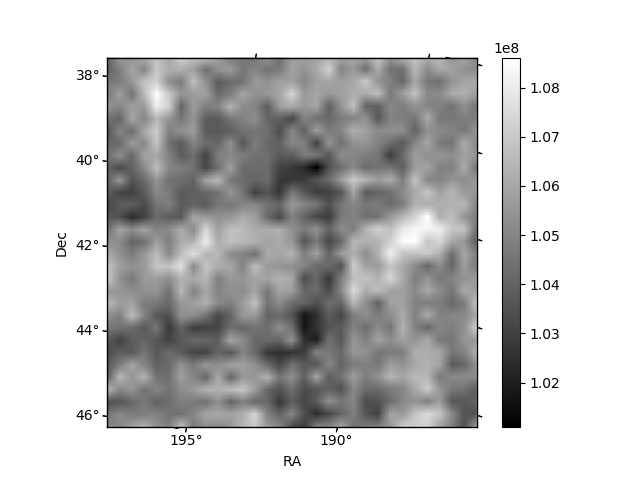
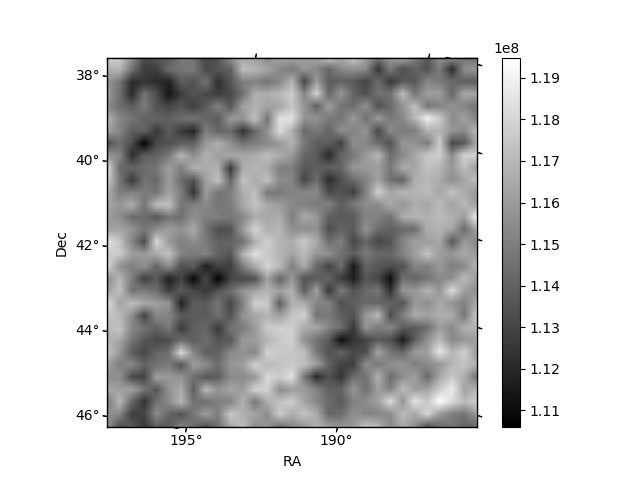
Histogram calculated using DETX and DETY for each event in the final _common_clean file
| Quadrant A | 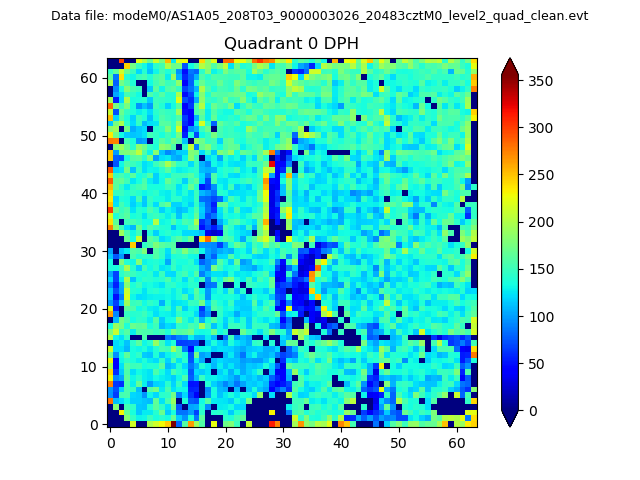 |
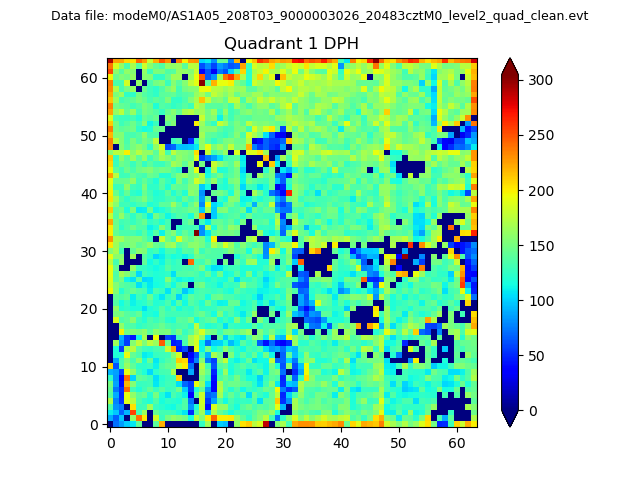 |
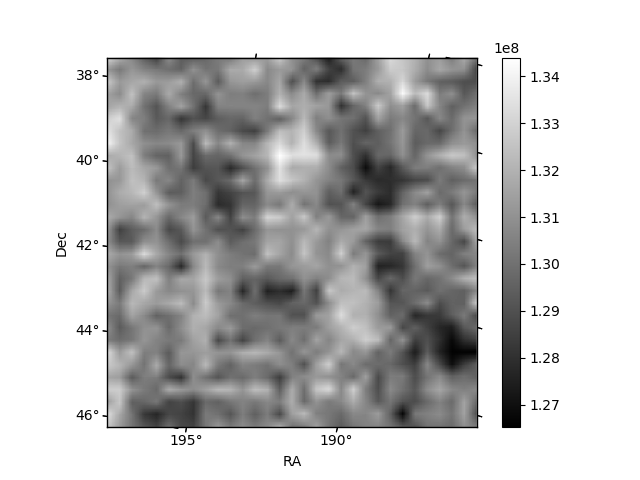
Quadrant B |
|---|---|---|---|
| Quadrant D | 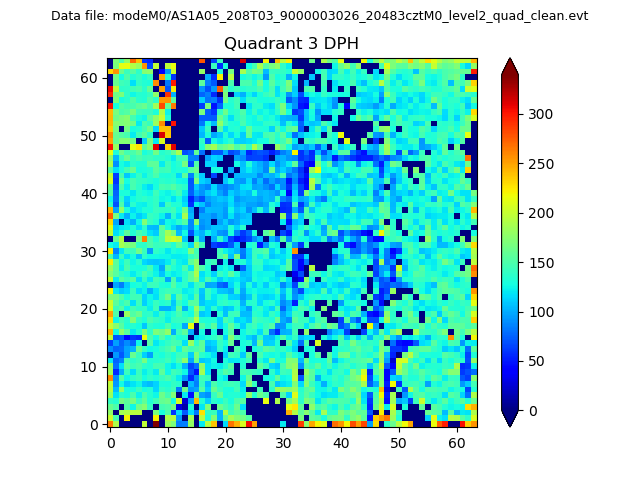 |
 |
Quadrant C |
| Plot type | Count rate plots | Images |
|---|---|---|
| Comparison with Poisson distribution Blue bars denote a histogram of data divided into 1 sec bins. Red curve is a Poisson curve with rate = median count rate of data. |
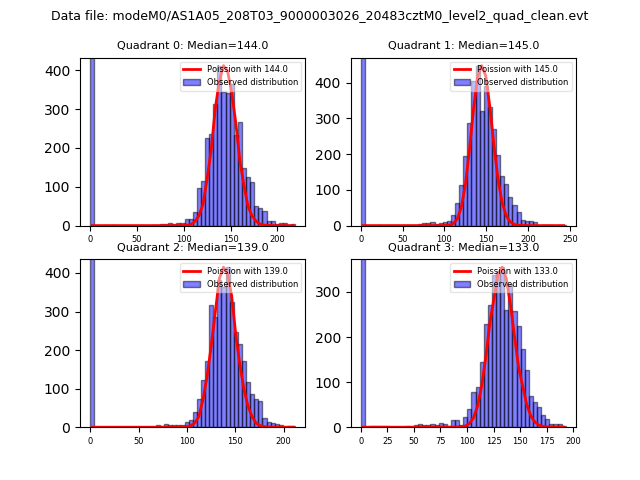 |
 |
| Quadrant-wise count rates Data is divided into 100 sec bins |
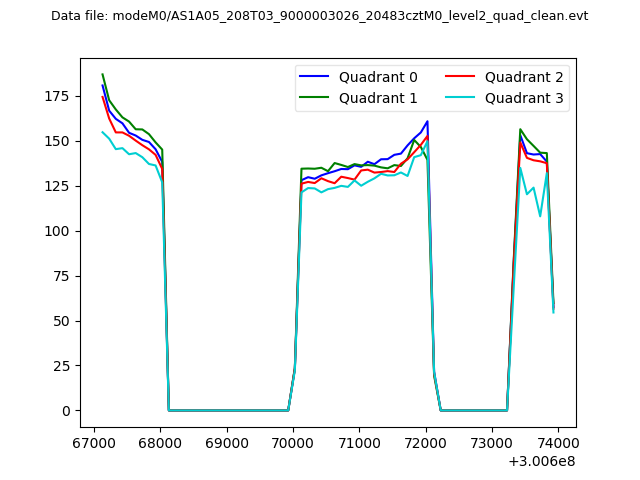 |
|
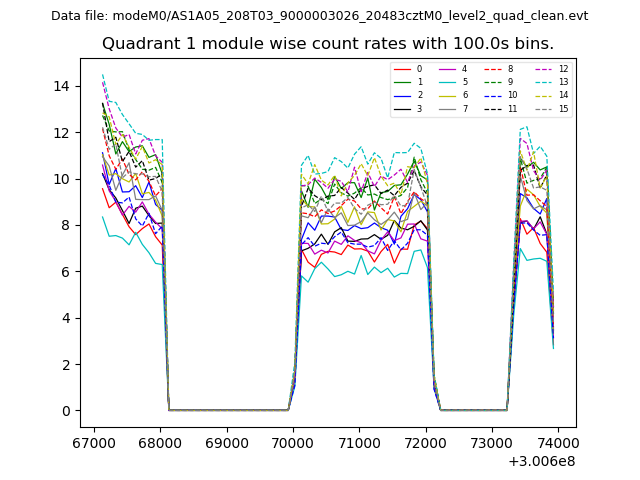
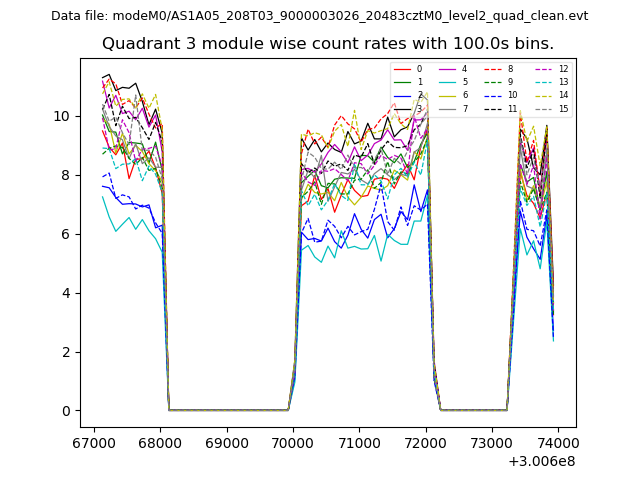
| Module-wise count rates for Quadrant A Data is divided into 100 sec bins |
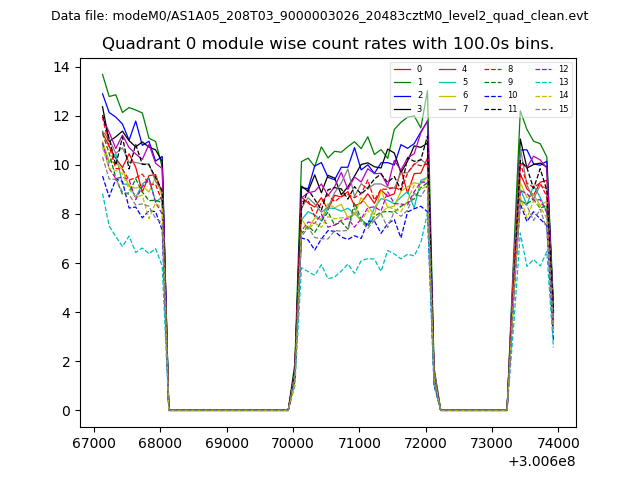 |
 |
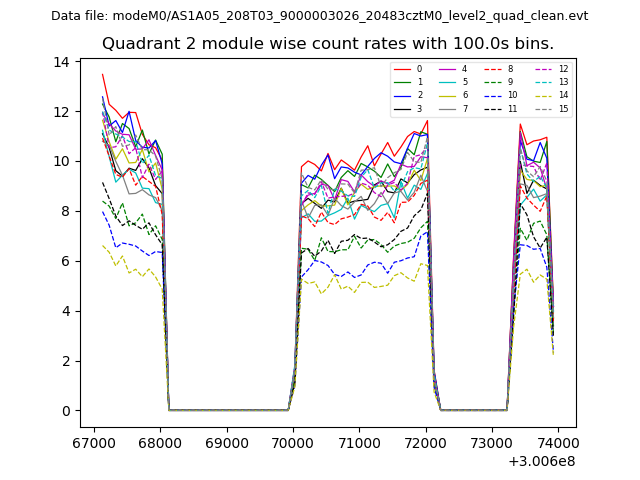
| Module-wise count rates for Quadrant B Data is divided into 100 sec bins |
 |
 |
| Module-wise count rates for Quadrant C Data is divided into 100 sec bins |
 |
 |
| Module-wise count rates for Quadrant D Data is divided into 100 sec bins |
 |
 |
| Parameter | Plot |
|---|---|
| CZT HV Monitor | 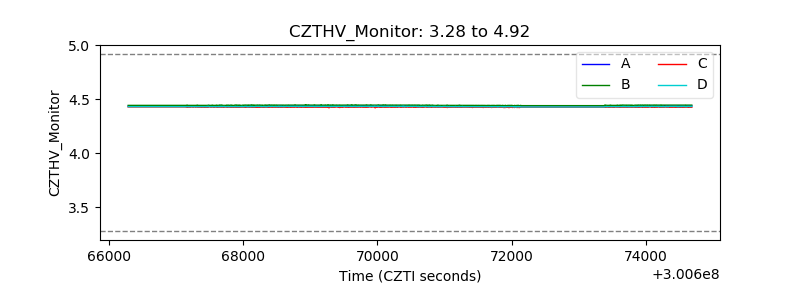 |
| D_VDD | 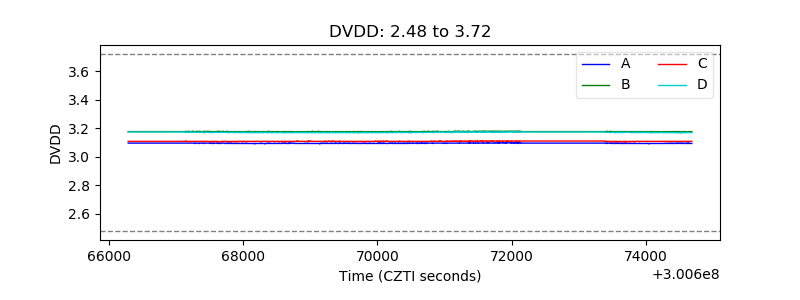 |
| Temperature 1 | 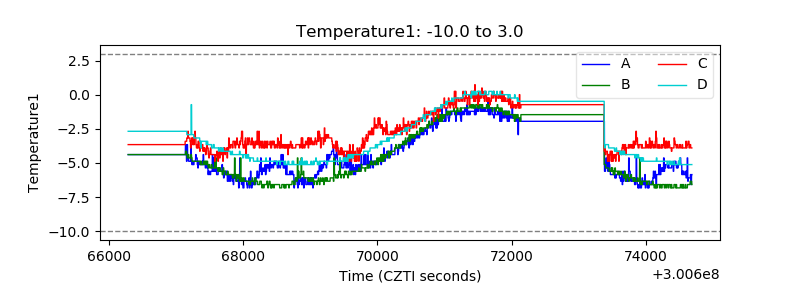 |
| Veto HV Monitor | 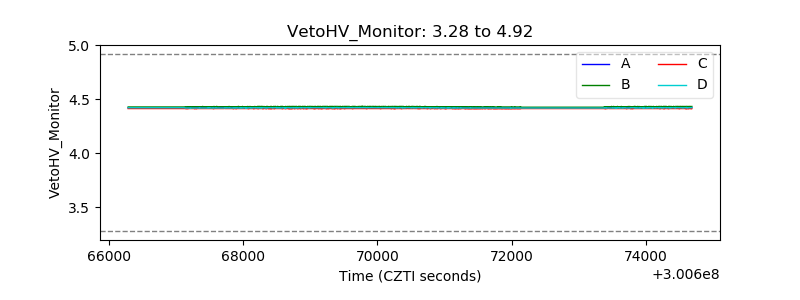 |
| Veto LLD | 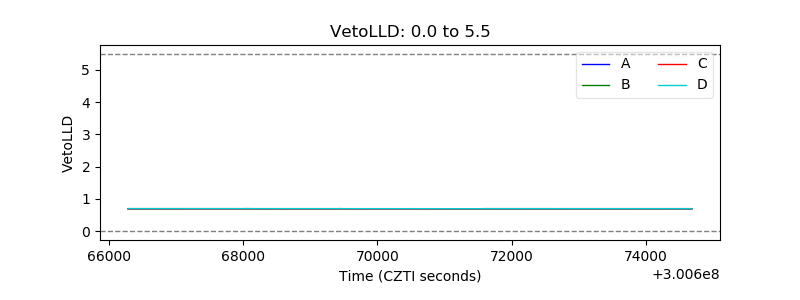 |
| Alpha Counter |  |
| _CPM_Rate | 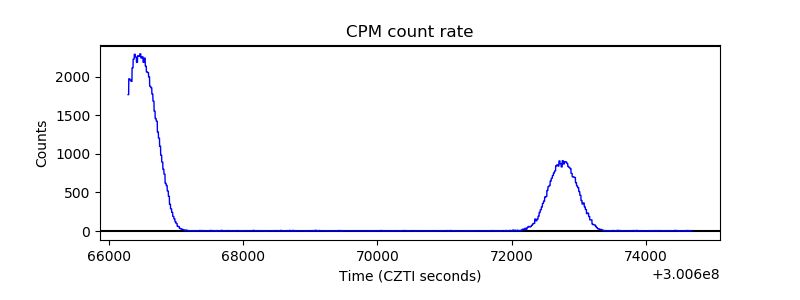 |
| CZT Counter |  |
| +2.5 Volts monitor |  |
| +5 Volts monitor |  |
| _ROLL_ROT | 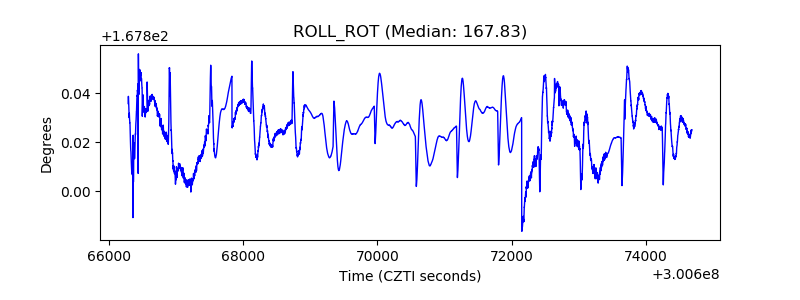 |
| _Roll_DEC | 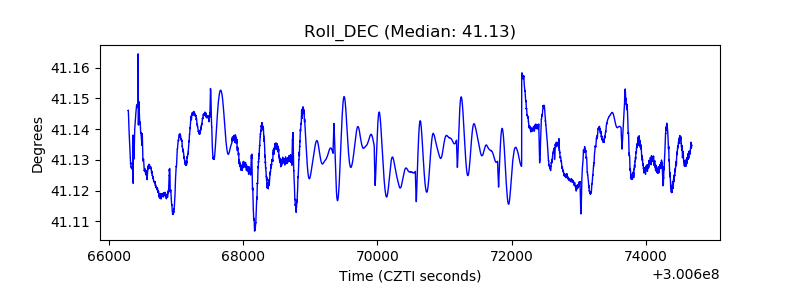 |
| _Roll_RA |  |
| Veto Counter | 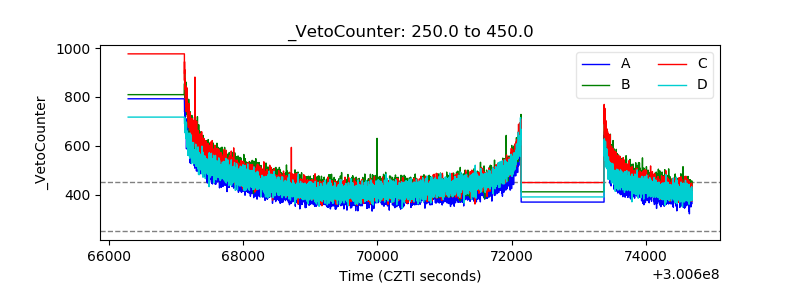 |