| Param | Original file | Final file |
|---|---|---|
| Filename | modeM0/AS1A05_208T03_9000003026_20486cztM0_level2.evt | modeM0/AS1A05_208T03_9000003026_20486cztM0_level2_quad_clean.evt |
| Size (bytes) | 750,432,960 | 79,655,040 |
| Size | 715.7 MB | 76.0 MB |
| Events in quadrant A | 3,510,291 | 496,828 |
| Events in quadrant B | 3,680,970 | 503,123 |
| Events in quadrant C | 3,579,036 | 482,188 |
| Events in quadrant D | 11,461,143 | 418,462 |
| Mode M0 | |||
|---|---|---|---|
| Quadrant | BADHDUFLAG | Total packets | Discarded packets |
| A | 0 | 15389 | 1 |
| B | 0 | 15588 | 1 |
| C | 0 | 15212 | 1 |
| D | 0 | 39200 | 1 |
| Mode SS | |||
|---|---|---|---|
| Quadrant | BADHDUFLAG | Total packets | Discarded packets |
| A | 0 | 148 | 0 |
| B | 0 | 148 | 0 |
| C | 0 | 148 | 0 |
| D | 0 | 148 | 0 |
| Mode M9 | |||
|---|---|---|---|
| Quadrant | BADHDUFLAG | Total packets | Discarded packets |
| A | 0 | 2 | 0 |
| B | 0 | 2 | 0 |
| C | 0 | 2 | 0 |
| D | 0 | 2 | 0 |
| Quadrant | Total seconds | Saturated seconds | Saturation percentage |
|---|---|---|---|
| A | 7344 | 162 | 2.205882% |
| B | 7345 | 167 | 2.273656% |
| C | 7345 | 164 | 2.232811% |
| D | 7345 | 1239 | 16.868618% |
Noise dominated data is calculated using 1-second bins in cleaned event files. If a bin has >2000 counts, and if more than 50% of those come from <1% of pixels, then it is considered to be noise-dominated and hence unusable.
| Quadrant | # 1 sec bins | Bins with >0 counts | Bins with >2000 counts | High rate bins dominated by noise | Noise dominated (total time) | Noise dominated (detector-on time) | Marked lightcurve |
|---|---|---|---|---|---|---|---|
| A | 7509 | 7344 | 16 | 16 | 0.21% | 0.22% | 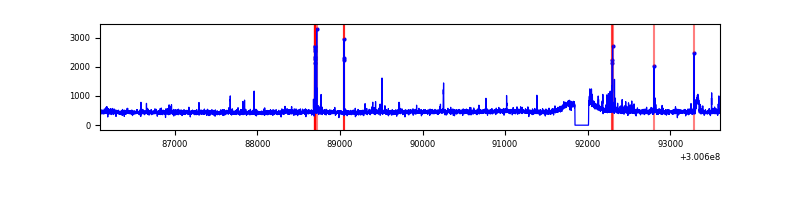 |
| B | 7510 | 7345 | 2 | 2 | 0.03% | 0.03% | 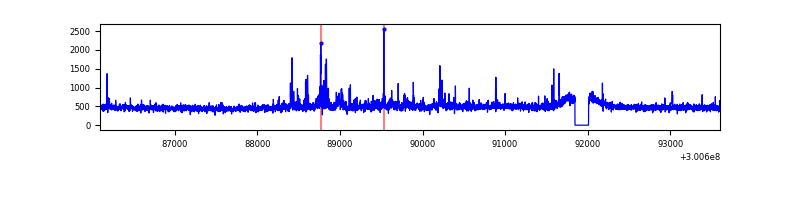 |
| C | 7510 | 7345 | 1 | 1 | 0.01% | 0.01% | 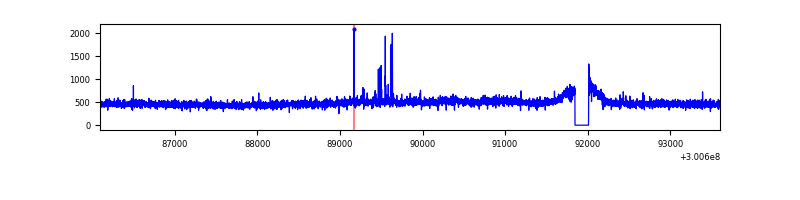 |
| D | 7510 | 7345 | 1023 | 1023 | 13.62% | 13.93% | 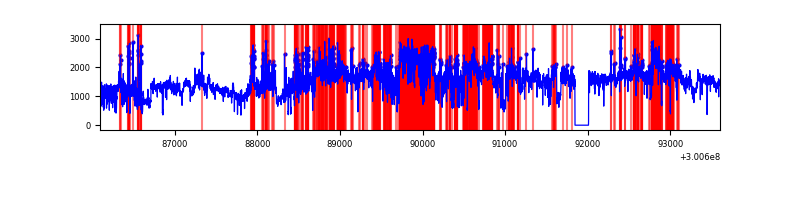 |
Top three noisy pixels from each quadrant. If the there are fewer than three noisy pixels in the level2.evt file, extra rows are filled as -1
| Pixel properties | Quadrant properties | ||||||
|---|---|---|---|---|---|---|---|
| Quadrant | DetID | PixID | Counts | Sigma | Mean | Median | Sigma |
| A | 5 | 16 | 109182 | 614.69 | 869 | 849 | 176.2 |
| A | 12 | 16 | 31057 | 171.4 | 869 | 849 | 176.2 |
| A | 9 | 143 | 17586 | 94.97 | 869 | 849 | 176.2 |
| B | 0 | 189 | 83120 | 493.0 | 872 | 850 | 166.9 |
| B | 0 | 197 | 55109 | 325.14 | 872 | 850 | 166.9 |
| B | 0 | 190 | 53644 | 316.36 | 872 | 850 | 166.9 |
| C | 3 | 233 | 140035 | 709.42 | 839 | 842 | 196.2 |
| C | 14 | 238 | 130215 | 659.37 | 839 | 842 | 196.2 |
| C | 0 | 207 | 31445 | 155.97 | 839 | 842 | 196.2 |
| D | 1 | 52 | 6741685 | 34498.22 | 799 | 776 | 195.4 |
| D | 2 | 165 | 757843 | 3874.47 | 799 | 776 | 195.4 |
| D | 5 | 222 | 611691 | 3126.5 | 799 | 776 | 195.4 |
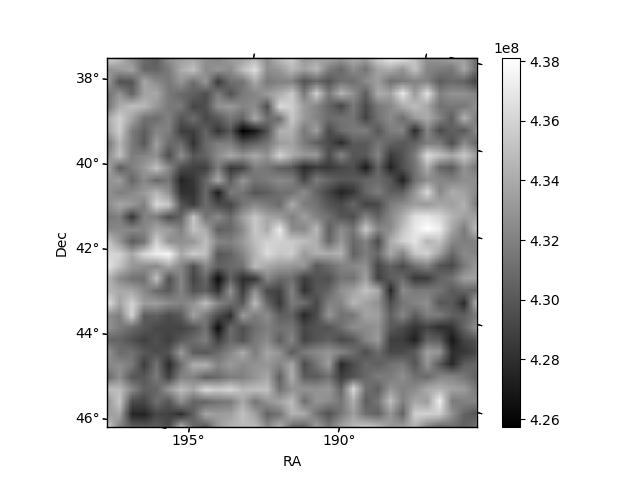
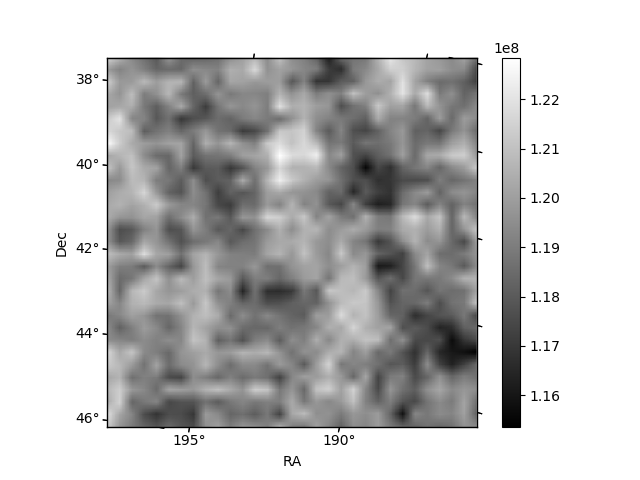
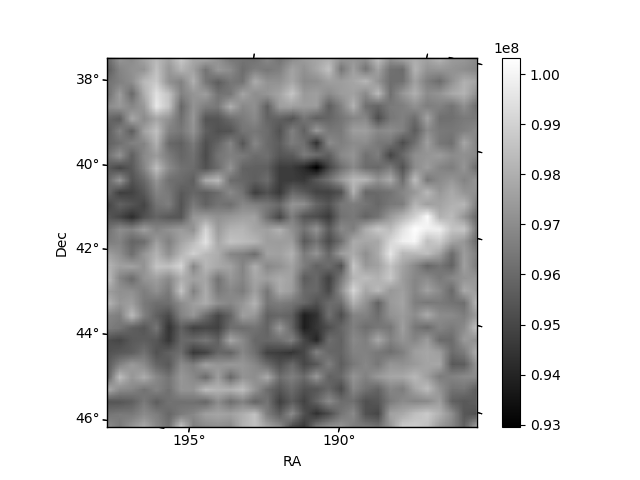
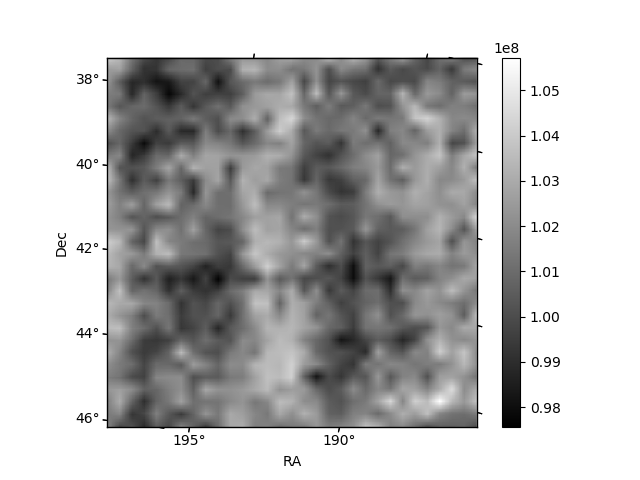
Histogram calculated using DETX and DETY for each event in the final _common_clean file
| Quadrant A | 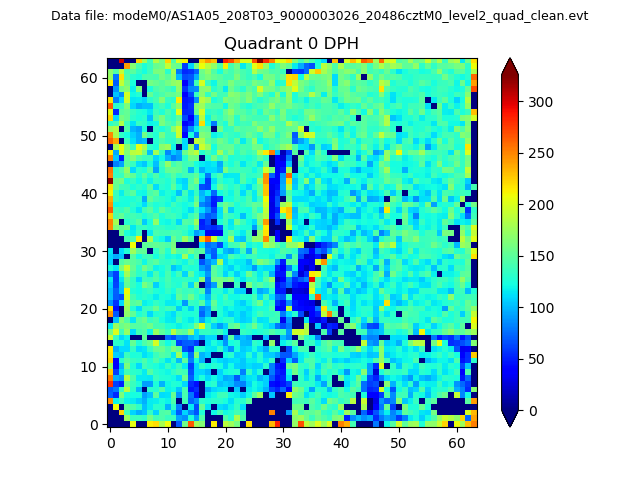 |
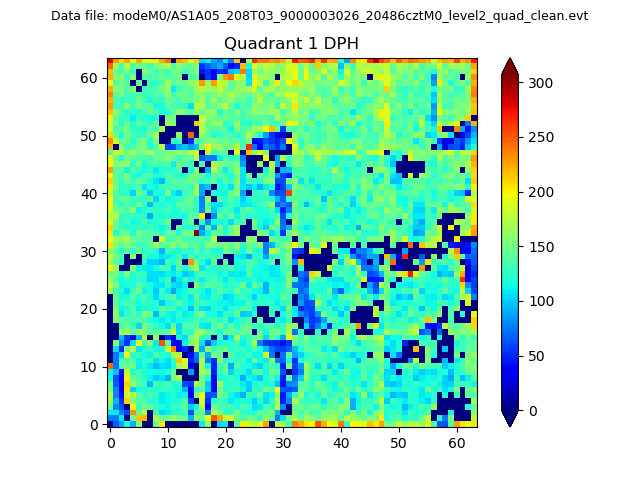 |
Quadrant B |
|---|---|---|---|
| Quadrant D | 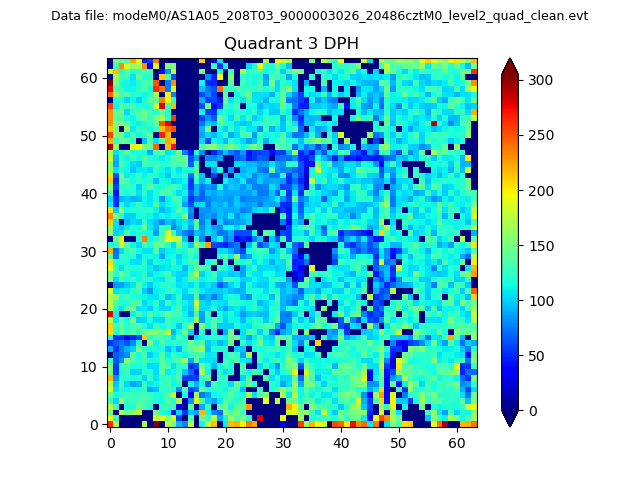 |
 |
Quadrant C |
| Plot type | Count rate plots | Images |
|---|---|---|
| Comparison with Poisson distribution Blue bars denote a histogram of data divided into 1 sec bins. Red curve is a Poisson curve with rate = median count rate of data. |
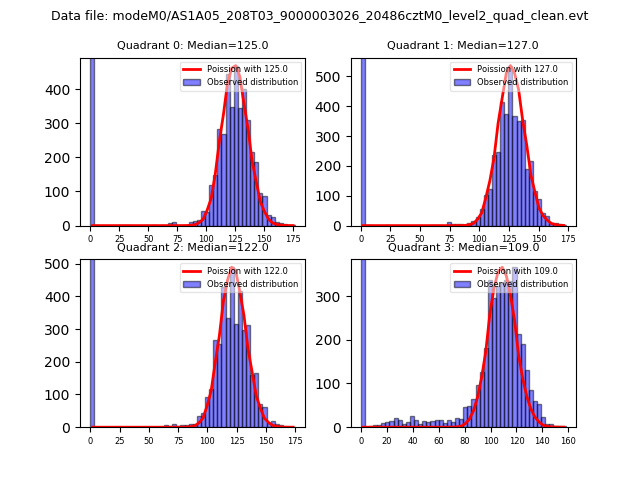 |
 |
| Quadrant-wise count rates Data is divided into 100 sec bins |
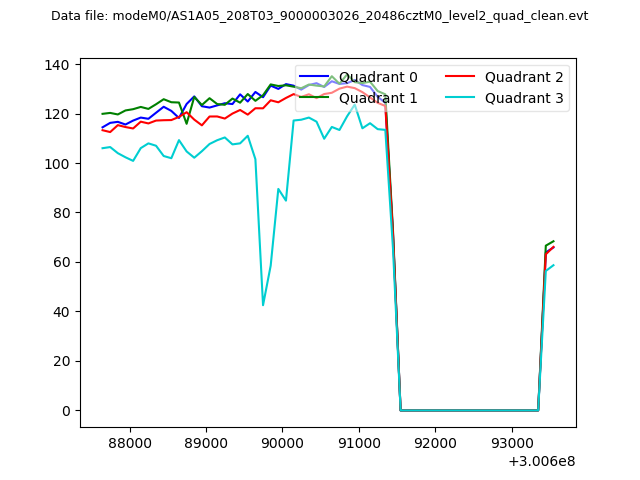 |
|
| Module-wise count rates for Quadrant A Data is divided into 100 sec bins |
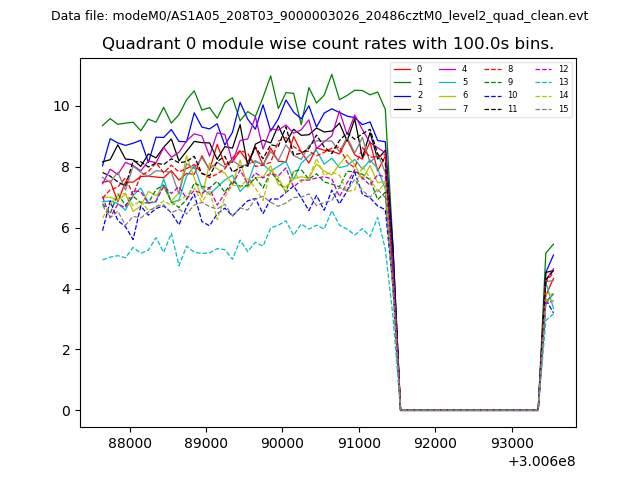 |
 |
| Module-wise count rates for Quadrant B Data is divided into 100 sec bins |
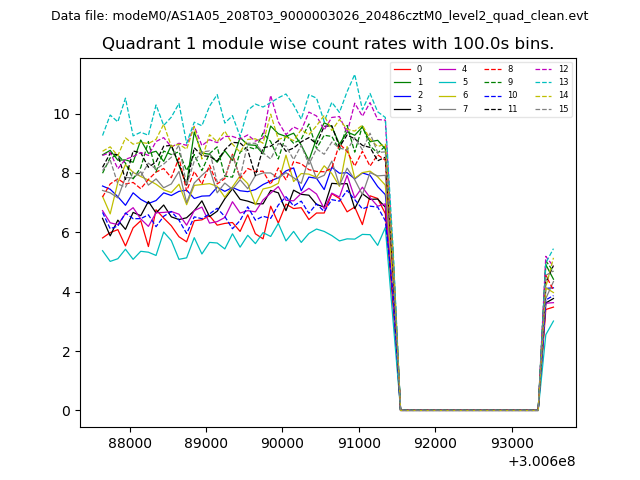 |
 |
| Module-wise count rates for Quadrant C Data is divided into 100 sec bins |
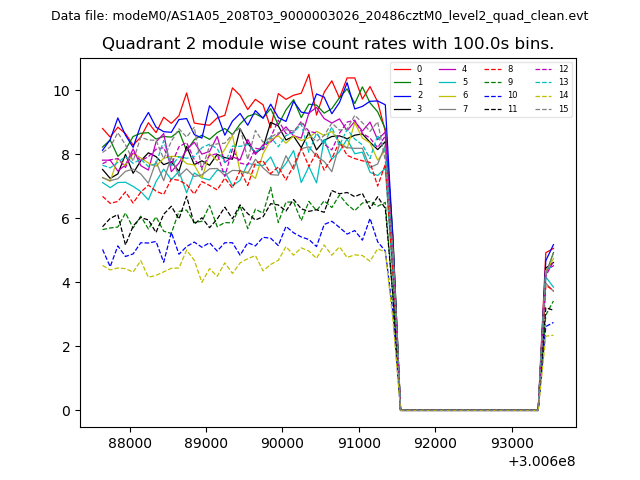 |
 |
| Module-wise count rates for Quadrant D Data is divided into 100 sec bins |
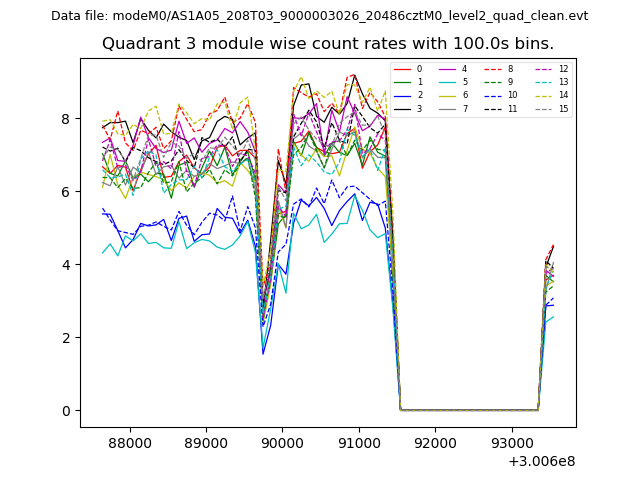 |
 |
| Parameter | Plot |
|---|---|
| CZT HV Monitor | 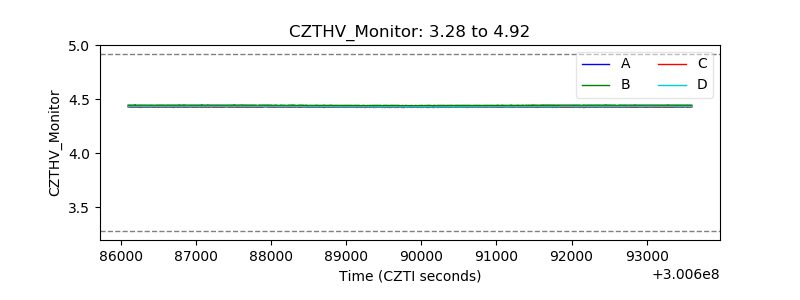 |
| D_VDD | 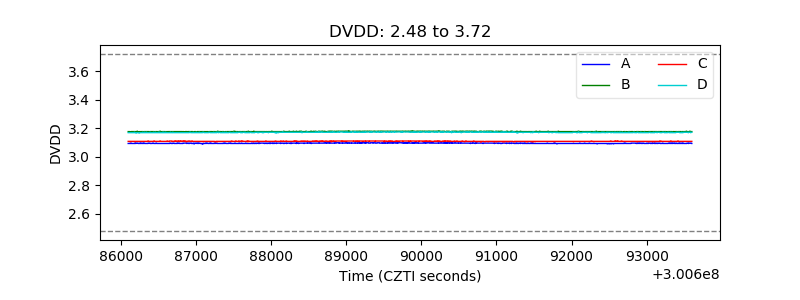 |
| Temperature 1 | 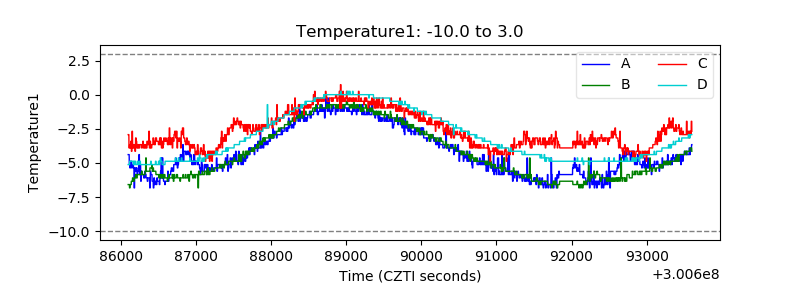 |
| Veto HV Monitor | 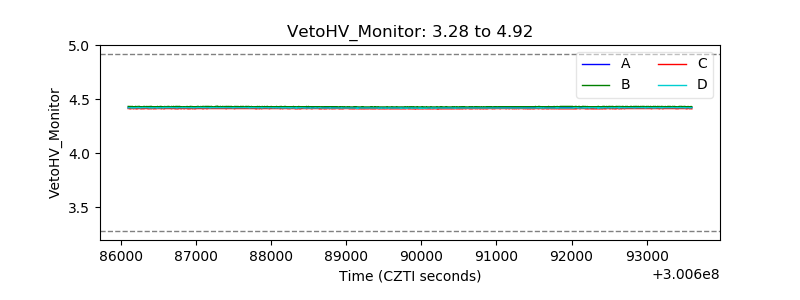 |
| Veto LLD | 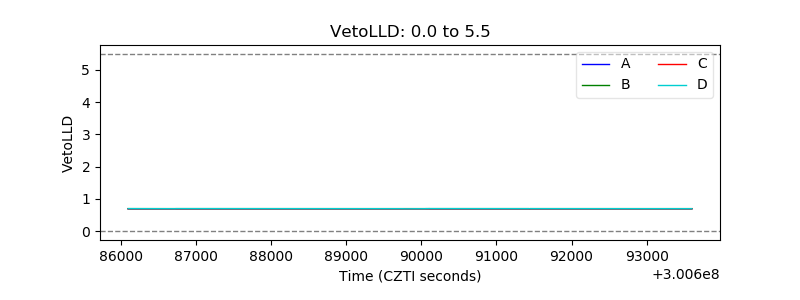 |
| Alpha Counter | 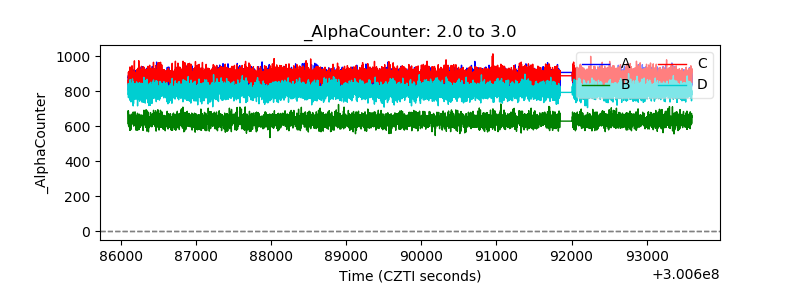 |
| _CPM_Rate | 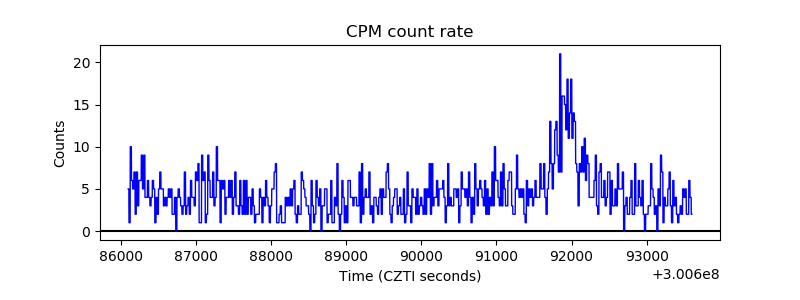 |
| CZT Counter |  |
| +2.5 Volts monitor |  |
| +5 Volts monitor | 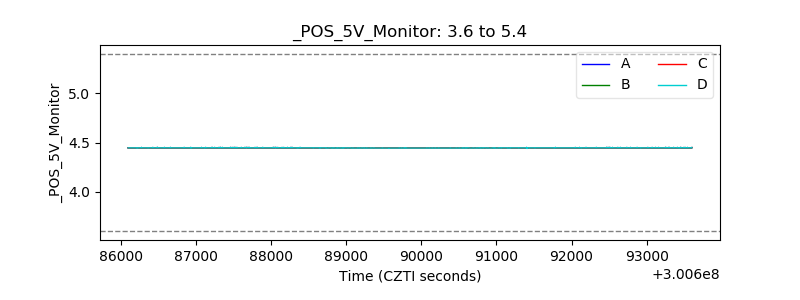 |
| _ROLL_ROT | 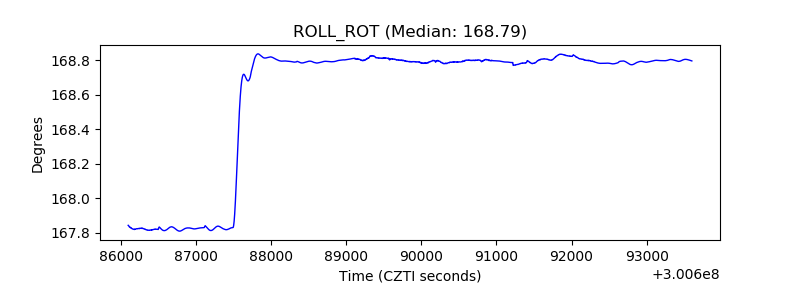 |
| _Roll_DEC | 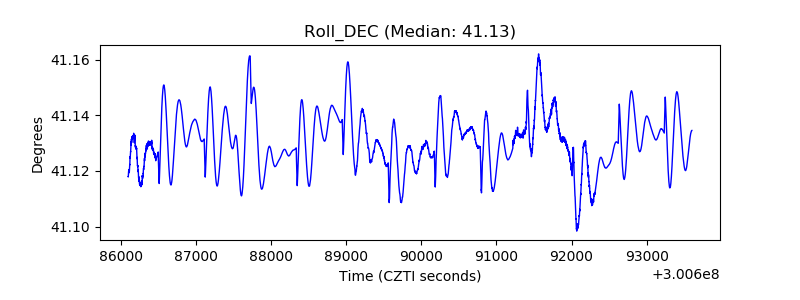 |
| _Roll_RA |  |
| Veto Counter | 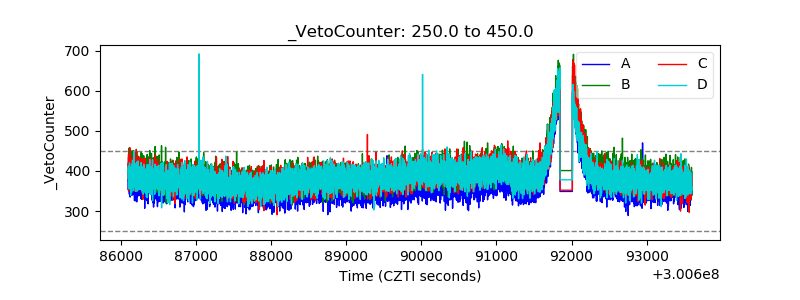 |