| Param | Original file | Final file |
|---|---|---|
| Filename | modeM0/AS1A05_208T03_9000003026_20487cztM0_level2.evt | modeM0/AS1A05_208T03_9000003026_20487cztM0_level2_quad_clean.evt |
| Size (bytes) | 773,709,120 | 87,730,560 |
| Size | 737.9 MB | 83.7 MB |
| Events in quadrant A | 3,763,954 | 549,808 |
| Events in quadrant B | 4,200,481 | 553,624 |
| Events in quadrant C | 3,725,499 | 533,415 |
| Events in quadrant D | 11,218,226 | 479,949 |
| Mode M0 | |||
|---|---|---|---|
| Quadrant | BADHDUFLAG | Total packets | Discarded packets |
| A | 0 | 16391 | 4 |
| B | 0 | 17357 | 3 |
| C | 0 | 16143 | 3 |
| D | 0 | 38745 | 3 |
| Mode SS | |||
|---|---|---|---|
| Quadrant | BADHDUFLAG | Total packets | Discarded packets |
| A | 0 | 160 | 0 |
| B | 0 | 160 | 0 |
| C | 0 | 160 | 0 |
| D | 0 | 160 | 0 |
| Mode M9 | |||
|---|---|---|---|
| Quadrant | BADHDUFLAG | Total packets | Discarded packets |
| A | 0 | 4 | 0 |
| B | 0 | 4 | 0 |
| C | 0 | 4 | 0 |
| D | 0 | 4 | 0 |
| Quadrant | Total seconds | Saturated seconds | Saturation percentage |
|---|---|---|---|
| A | 7756 | 263 | 3.390923% |
| B | 7756 | 314 | 4.048479% |
| C | 7756 | 264 | 3.403816% |
| D | 7756 | 1111 | 14.324394% |
Noise dominated data is calculated using 1-second bins in cleaned event files. If a bin has >2000 counts, and if more than 50% of those come from <1% of pixels, then it is considered to be noise-dominated and hence unusable.
| Quadrant | # 1 sec bins | Bins with >0 counts | Bins with >2000 counts | High rate bins dominated by noise | Noise dominated (total time) | Noise dominated (detector-on time) | Marked lightcurve |
|---|---|---|---|---|---|---|---|
| A | 8166 | 7756 | 15 | 15 | 0.18% | 0.19% | 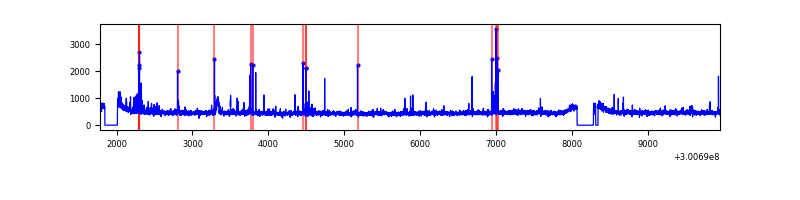 |
| B | 8166 | 7756 | 27 | 27 | 0.33% | 0.35% | 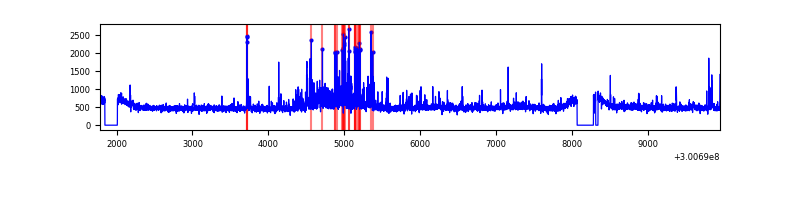 |
| C | 8166 | 7756 | 0 | 0 | 0.00% | 0.00% | 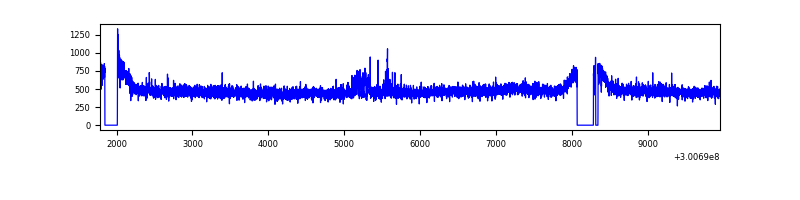 |
| D | 8166 | 7756 | 837 | 837 | 10.25% | 10.79% | 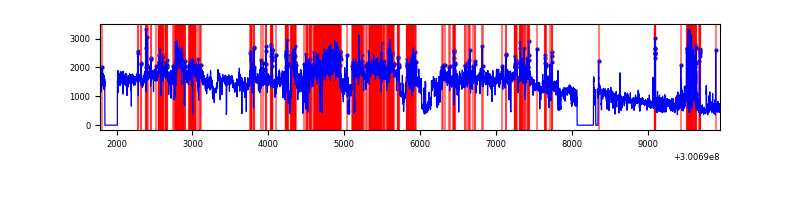 |
Top three noisy pixels from each quadrant. If the there are fewer than three noisy pixels in the level2.evt file, extra rows are filled as -1
| Pixel properties | Quadrant properties | ||||||
|---|---|---|---|---|---|---|---|
| Quadrant | DetID | PixID | Counts | Sigma | Mean | Median | Sigma |
| A | 5 | 16 | 125074 | 656.03 | 930 | 907 | 189.3 |
| A | 12 | 16 | 30533 | 156.53 | 930 | 907 | 189.3 |
| A | 9 | 143 | 17996 | 90.29 | 930 | 907 | 189.3 |
| B | 7 | 220 | 238895 | 1333.38 | 932 | 906 | 178.5 |
| B | 0 | 189 | 68924 | 381.08 | 932 | 906 | 178.5 |
| B | 0 | 219 | 58656 | 323.55 | 932 | 906 | 178.5 |
| C | 14 | 238 | 138516 | 653.86 | 895 | 899 | 210.5 |
| C | 9 | 221 | 54491 | 254.63 | 895 | 899 | 210.5 |
| C | 3 | 233 | 34858 | 161.35 | 895 | 899 | 210.5 |
| D | 1 | 52 | 6915511 | 32417.78 | 875 | 846 | 213.3 |
| D | 2 | 165 | 324344 | 1516.64 | 875 | 846 | 213.3 |
| D | 7 | 238 | 252206 | 1178.44 | 875 | 846 | 213.3 |
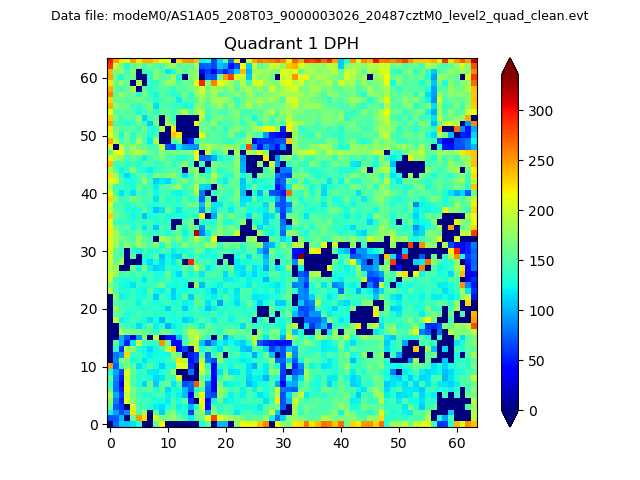
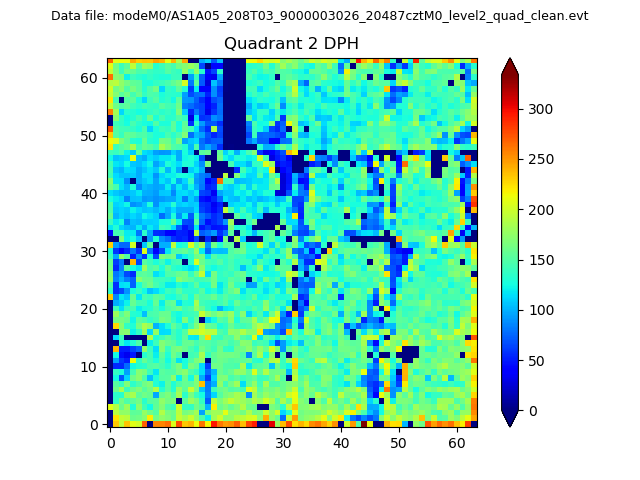
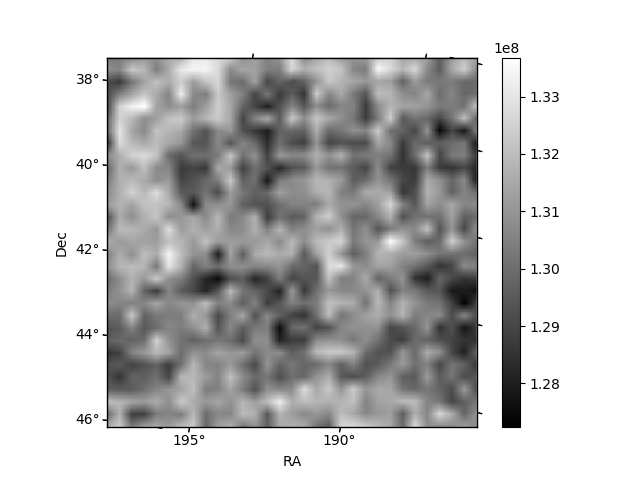
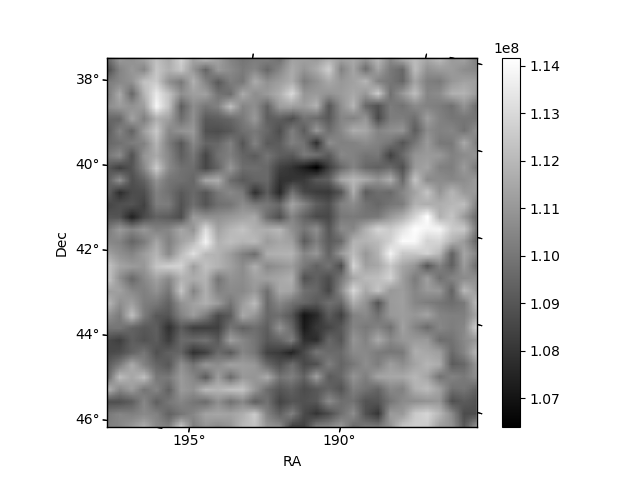
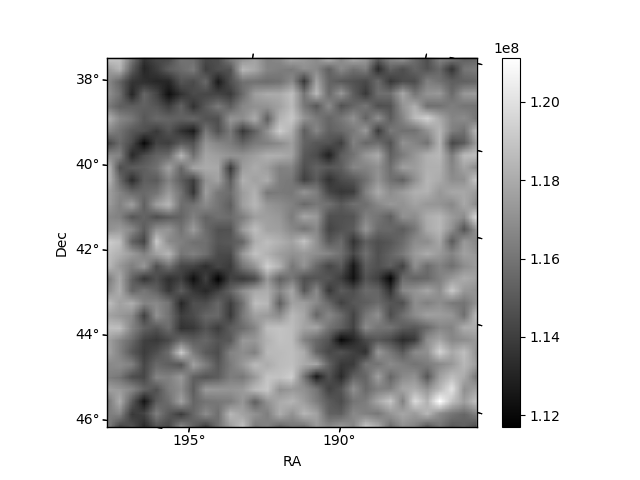
Histogram calculated using DETX and DETY for each event in the final _common_clean file
| Quadrant A |  |
 |
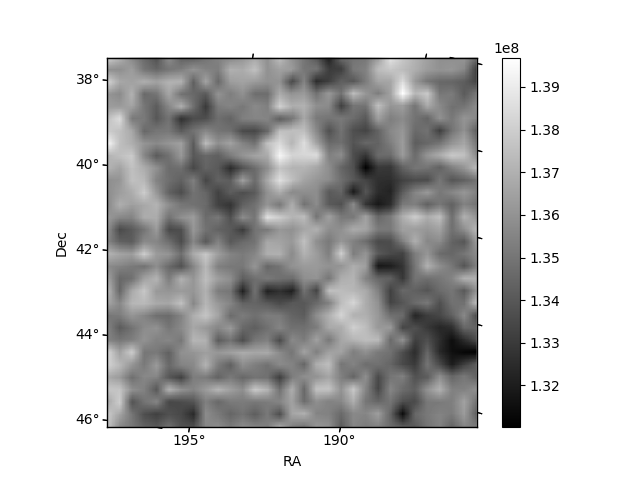
Quadrant B |
|---|---|---|---|
| Quadrant D |  |
 |
Quadrant C |
| Plot type | Count rate plots | Images |
|---|---|---|
| Comparison with Poisson distribution Blue bars denote a histogram of data divided into 1 sec bins. Red curve is a Poisson curve with rate = median count rate of data. |
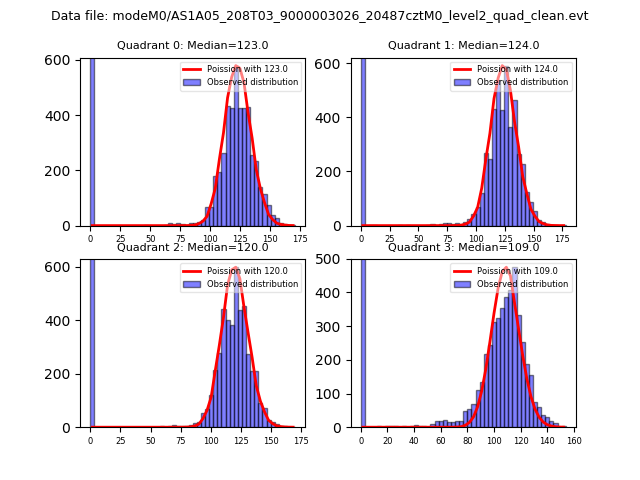 |
 |
| Quadrant-wise count rates Data is divided into 100 sec bins |
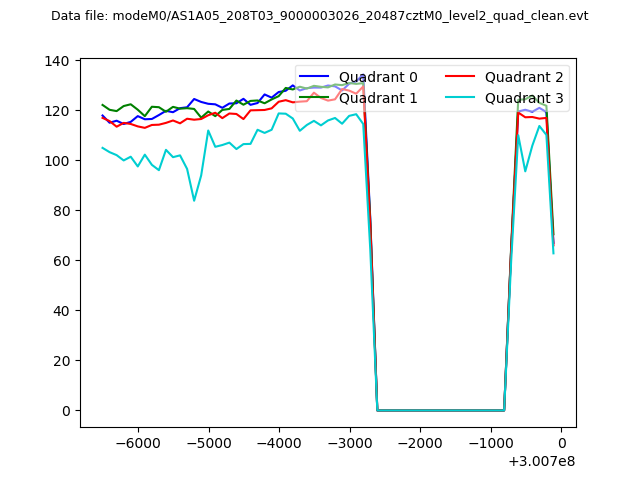 |
|
| Module-wise count rates for Quadrant A Data is divided into 100 sec bins |
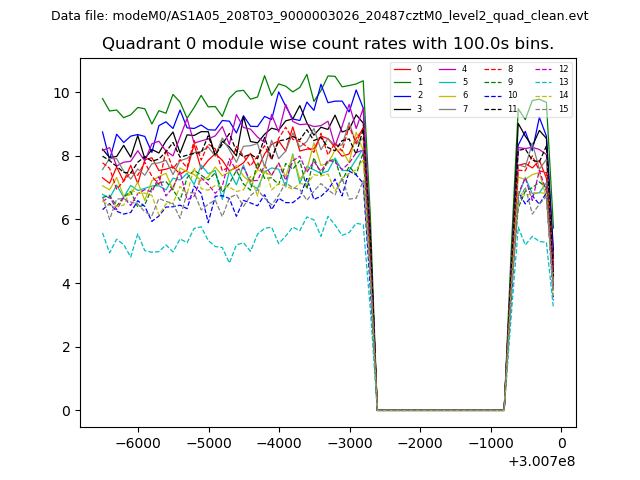 |
 |
| Module-wise count rates for Quadrant B Data is divided into 100 sec bins |
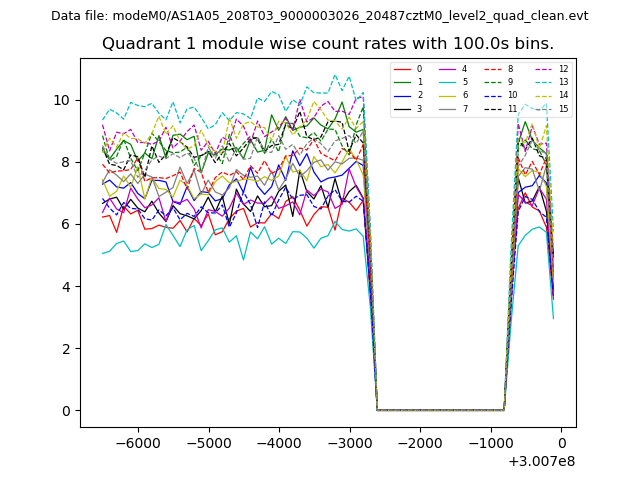 |
 |
| Module-wise count rates for Quadrant C Data is divided into 100 sec bins |
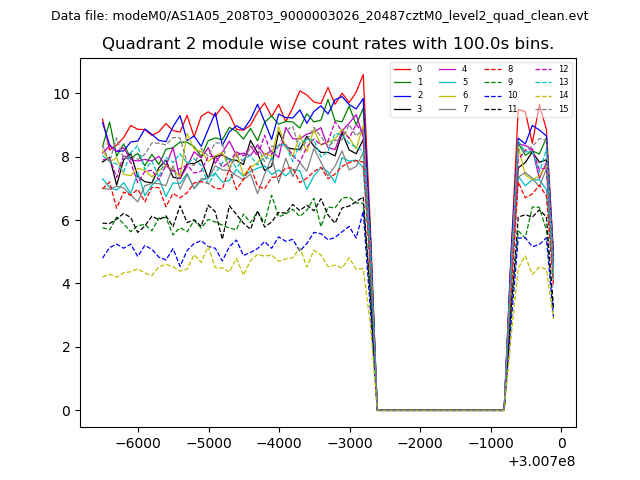 |
 |
| Module-wise count rates for Quadrant D Data is divided into 100 sec bins |
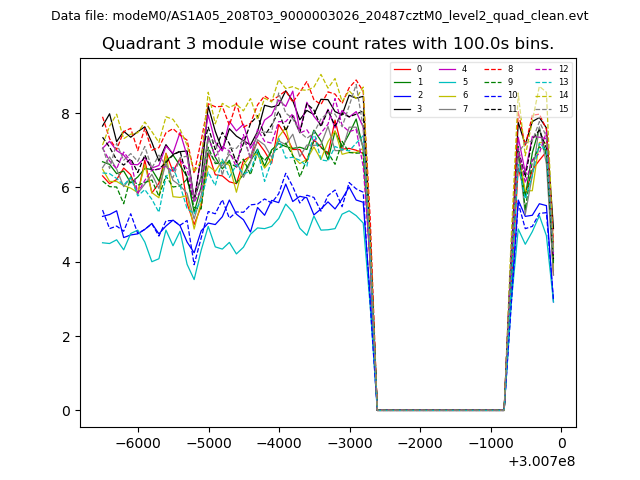 |
 |
| Parameter | Plot |
|---|---|
| CZT HV Monitor | 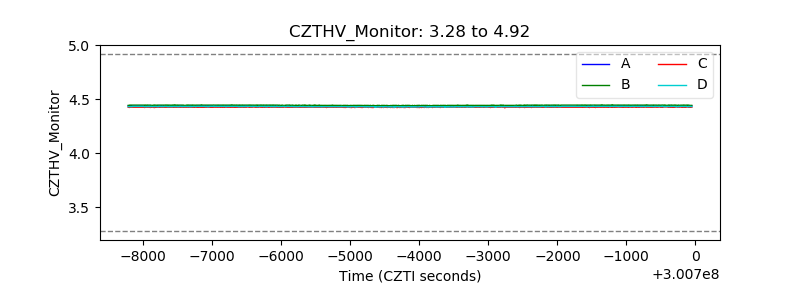 |
| D_VDD | 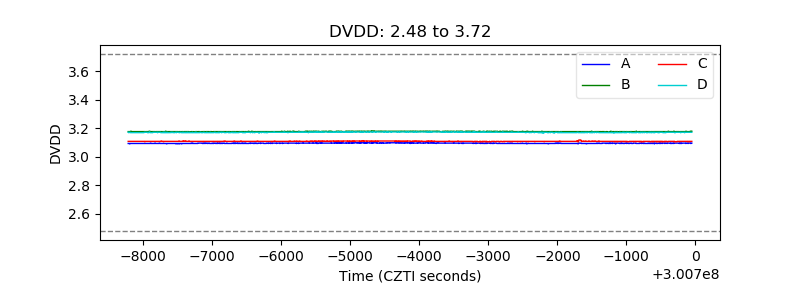 |
| Temperature 1 | 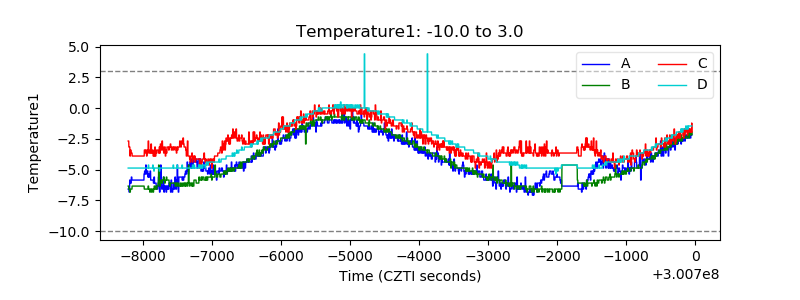 |
| Veto HV Monitor | 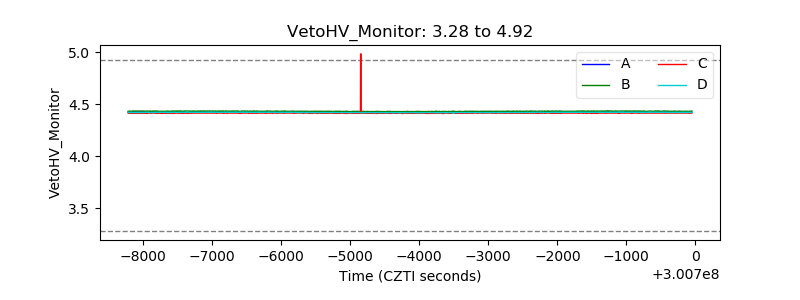 |
| Veto LLD | 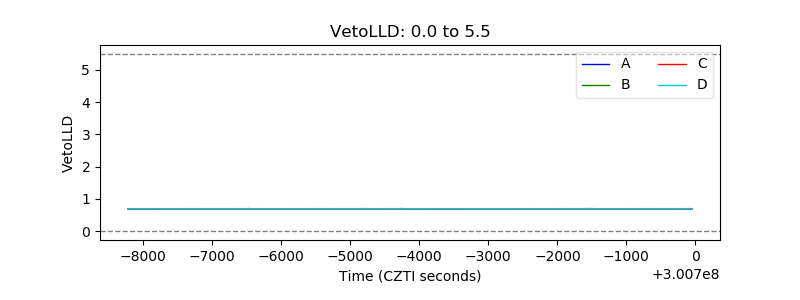 |
| Alpha Counter | 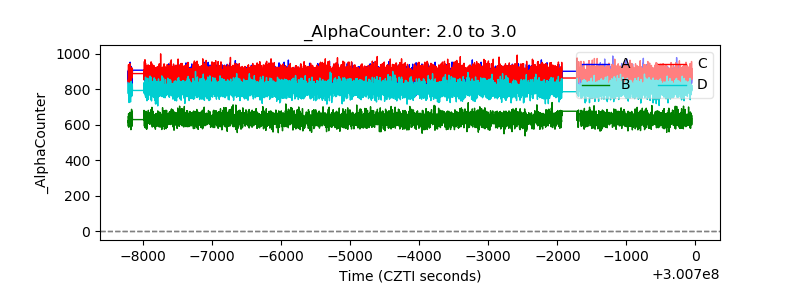 |
| _CPM_Rate | 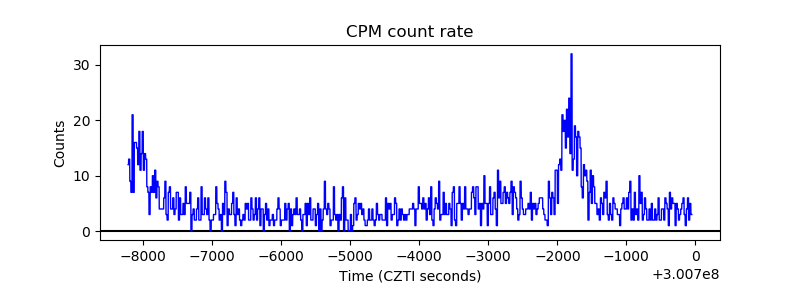 |
| CZT Counter |  |
| +2.5 Volts monitor |  |
| +5 Volts monitor | 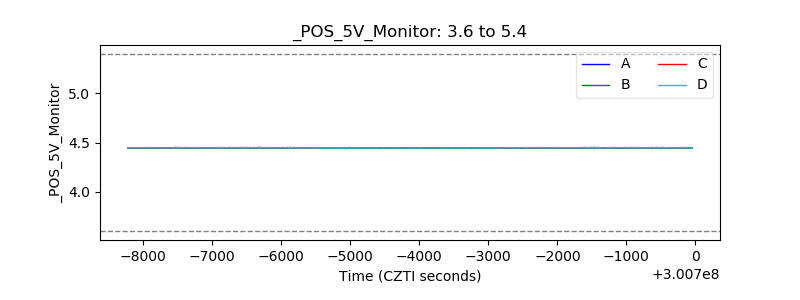 |
| _ROLL_ROT | 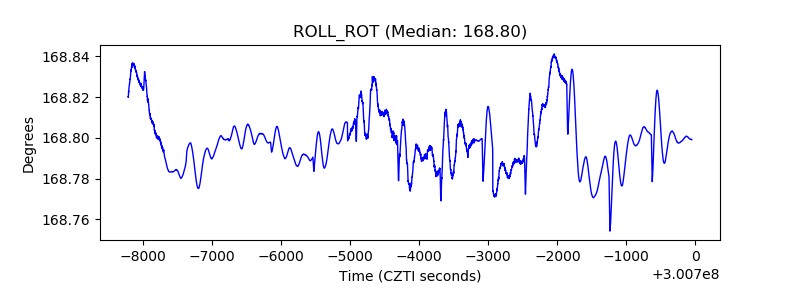 |
| _Roll_DEC | 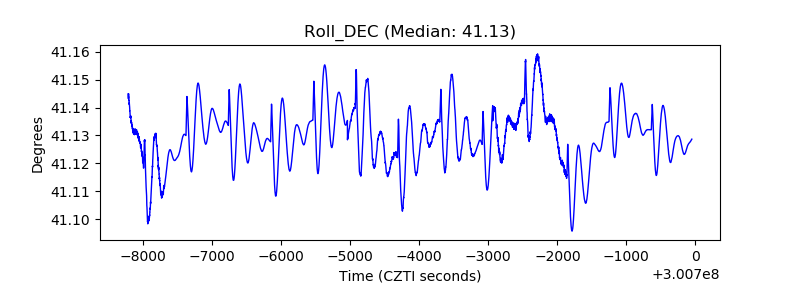 |
| _Roll_RA |  |
| Veto Counter | 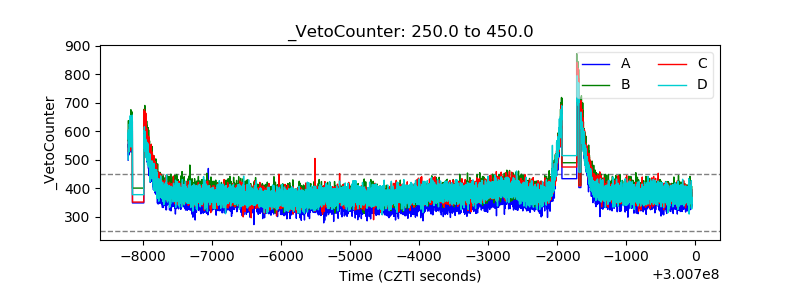 |