| Param | Original file | Final file |
|---|---|---|
| Filename | modeM0/AS1A05_208T03_9000003026_20489cztM0_level2.evt | modeM0/AS1A05_208T03_9000003026_20489cztM0_level2_quad_clean.evt |
| Size (bytes) | 356,261,760 | 58,227,840 |
| Size | 339.8 MB | 55.5 MB |
| Events in quadrant A | 1,772,204 | 392,872 |
| Events in quadrant B | 2,071,904 | 392,686 |
| Events in quadrant C | 1,769,361 | 378,022 |
| Events in quadrant D | 4,909,264 | 322,734 |
| Mode M0 | |||
|---|---|---|---|
| Quadrant | BADHDUFLAG | Total packets | Discarded packets |
| A | 0 | 7977 | 0 |
| B | 0 | 8650 | 0 |
| C | 0 | 7851 | 0 |
| D | 0 | 17266 | 0 |
| Mode SS | |||
|---|---|---|---|
| Quadrant | BADHDUFLAG | Total packets | Discarded packets |
| A | 0 | 78 | 0 |
| B | 0 | 78 | 0 |
| C | 0 | 78 | 0 |
| D | 0 | 78 | 0 |
| Quadrant | Total seconds | Saturated seconds | Saturation percentage |
|---|---|---|---|
| A | 3916 | 7 | 0.178754% |
| B | 3917 | 24 | 0.612714% |
| C | 3917 | 9 | 0.229768% |
| D | 3917 | 770 | 19.657901% |
Noise dominated data is calculated using 1-second bins in cleaned event files. If a bin has >2000 counts, and if more than 50% of those come from <1% of pixels, then it is considered to be noise-dominated and hence unusable.
| Quadrant | # 1 sec bins | Bins with >0 counts | Bins with >2000 counts | High rate bins dominated by noise | Noise dominated (total time) | Noise dominated (detector-on time) | Marked lightcurve |
|---|---|---|---|---|---|---|---|
| A | 3916 | 3916 | 5 | 5 | 0.13% | 0.13% | 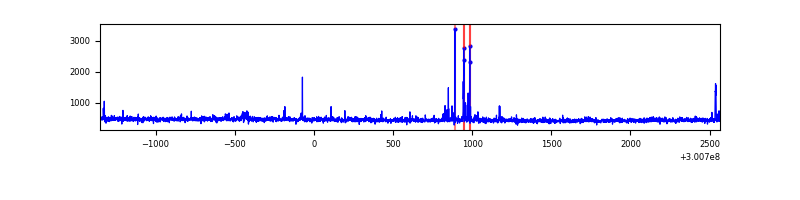 |
| B | 3917 | 3917 | 15 | 15 | 0.38% | 0.38% | 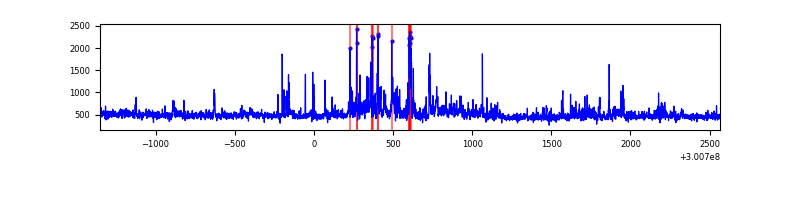 |
| C | 3917 | 3917 | 0 | 0 | 0.00% | 0.00% | 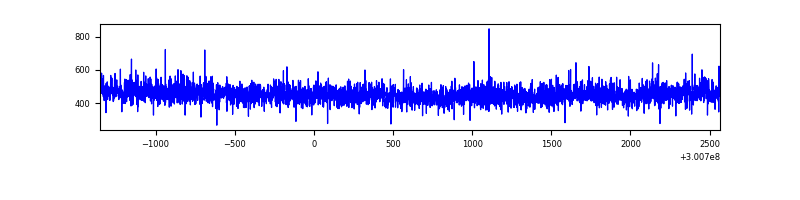 |
| D | 3916 | 3916 | 792 | 792 | 20.22% | 20.22% | 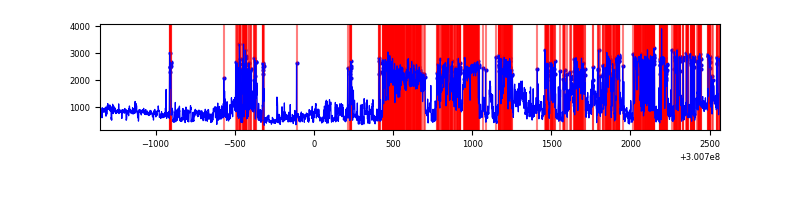 |
Top three noisy pixels from each quadrant. If the there are fewer than three noisy pixels in the level2.evt file, extra rows are filled as -1
| Pixel properties | Quadrant properties | ||||||
|---|---|---|---|---|---|---|---|
| Quadrant | DetID | PixID | Counts | Sigma | Mean | Median | Sigma |
| A | 5 | 16 | 58899 | 640.02 | 444 | 434 | 91.3 |
| A | 0 | 226 | 3950 | 38.49 | 444 | 434 | 91.3 |
| A | 3 | 137 | 3514 | 33.72 | 444 | 434 | 91.3 |
| B | 0 | 197 | 80838 | 937.45 | 442 | 431 | 85.8 |
| B | 7 | 220 | 63641 | 736.95 | 442 | 431 | 85.8 |
| B | 0 | 189 | 62469 | 723.29 | 442 | 431 | 85.8 |
| C | 14 | 238 | 64667 | 642.55 | 424 | 427 | 100.0 |
| C | 3 | 233 | 48848 | 484.32 | 424 | 427 | 100.0 |
| C | 13 | 61 | 2970 | 25.44 | 424 | 427 | 100.0 |
| D | 7 | 238 | 1614323 | 16226.05 | 400 | 388 | 99.5 |
| D | 7 | 38 | 972752 | 9775.88 | 400 | 388 | 99.5 |
| D | 1 | 52 | 596158 | 5989.71 | 400 | 388 | 99.5 |
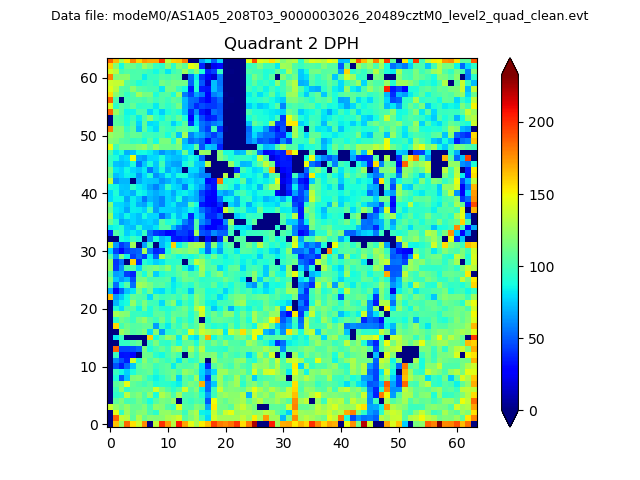
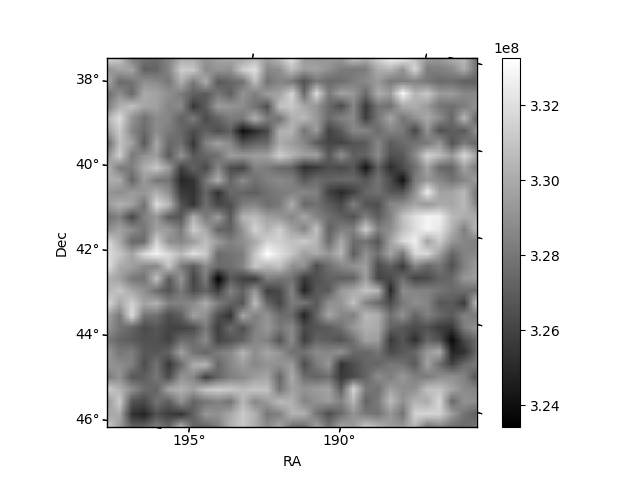
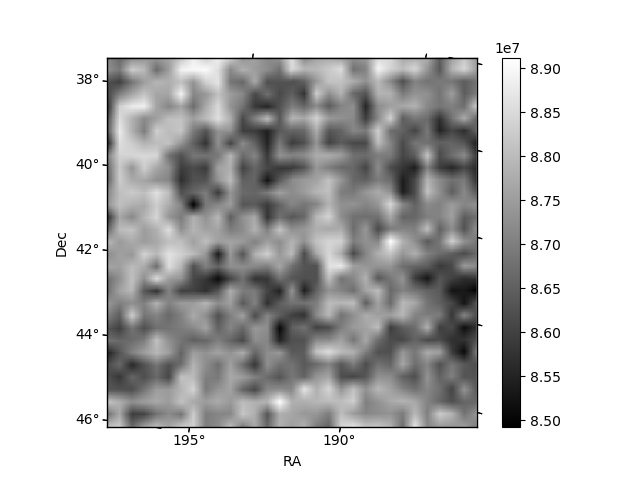
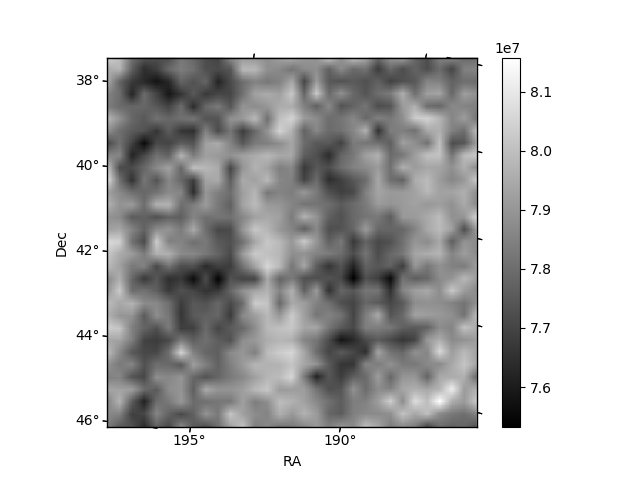
Histogram calculated using DETX and DETY for each event in the final _common_clean file
| Quadrant A | 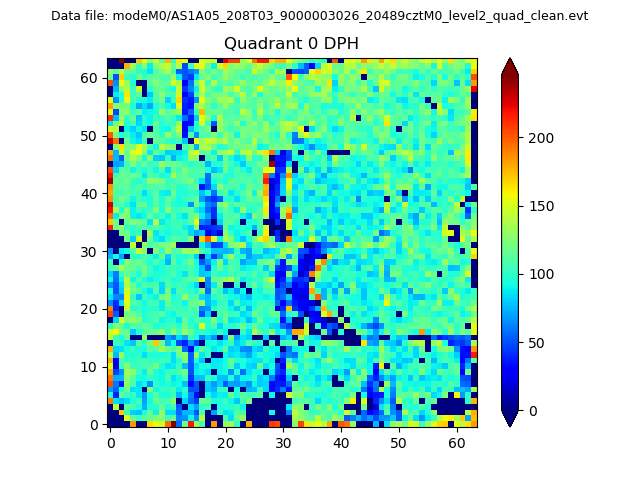 |
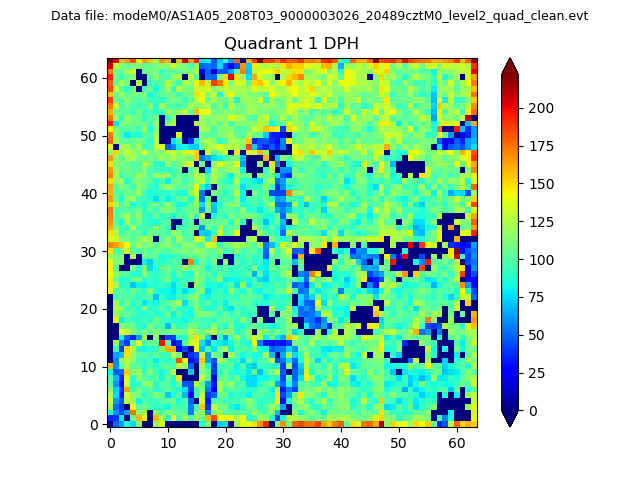 |
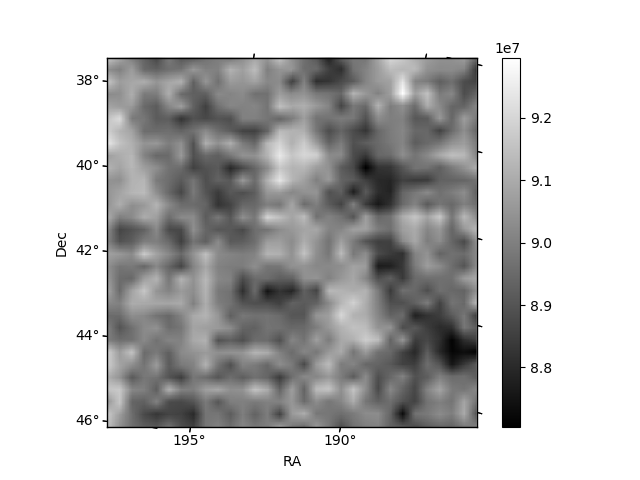
Quadrant B |
|---|---|---|---|
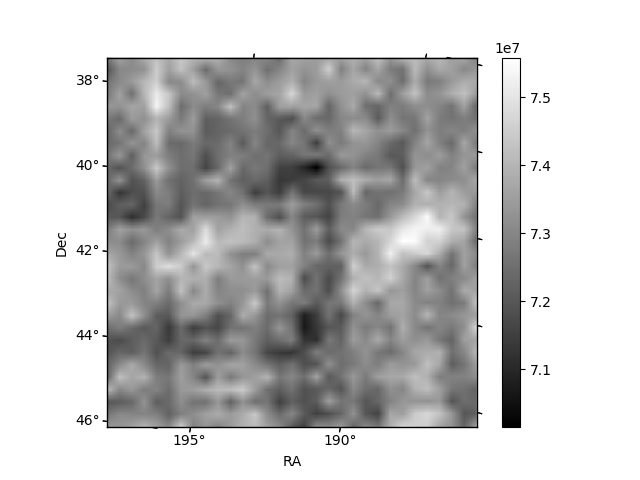
| Quadrant D | 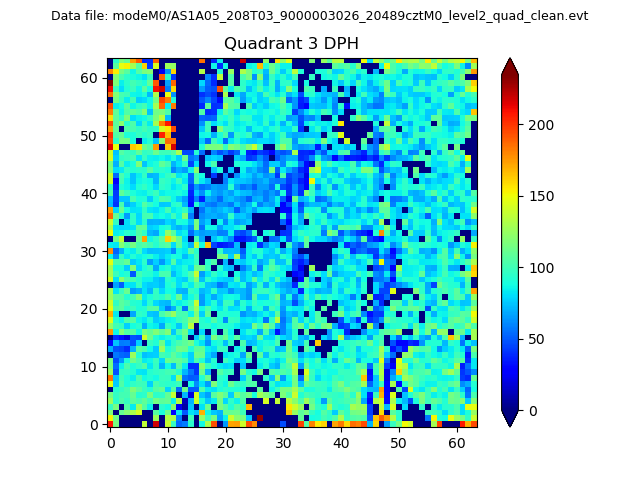 |
 |
Quadrant C |
| Plot type | Count rate plots | Images |
|---|---|---|
| Comparison with Poisson distribution Blue bars denote a histogram of data divided into 1 sec bins. Red curve is a Poisson curve with rate = median count rate of data. |
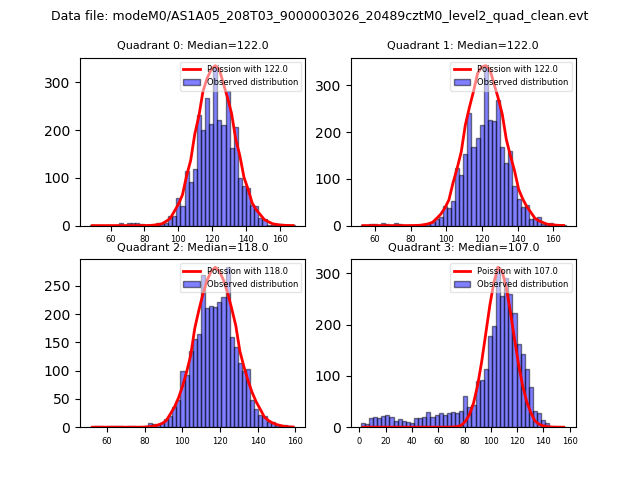 |
 |
| Quadrant-wise count rates Data is divided into 100 sec bins |
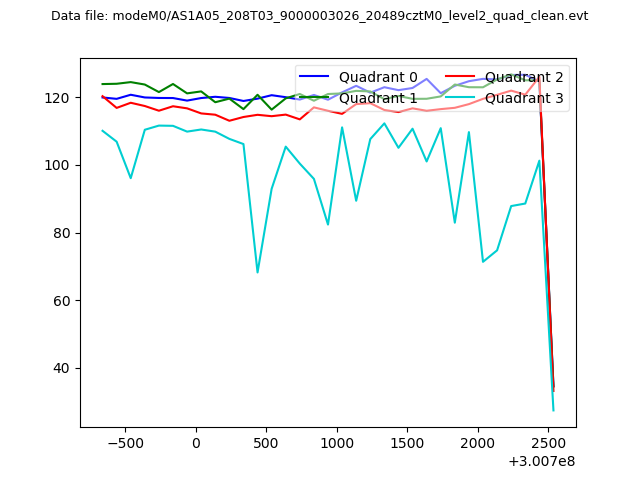 |
|
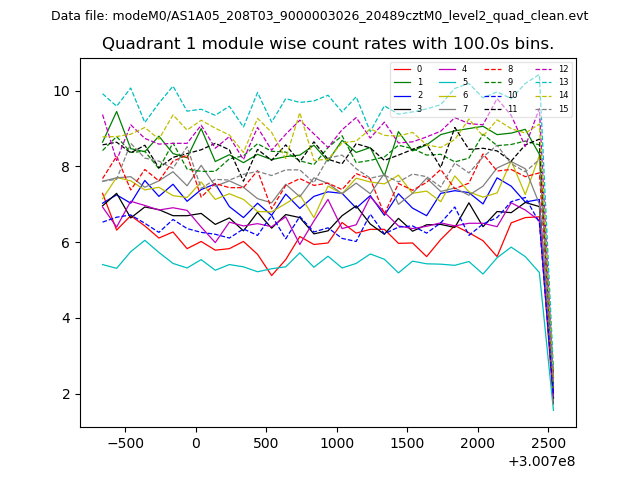
| Module-wise count rates for Quadrant A Data is divided into 100 sec bins |
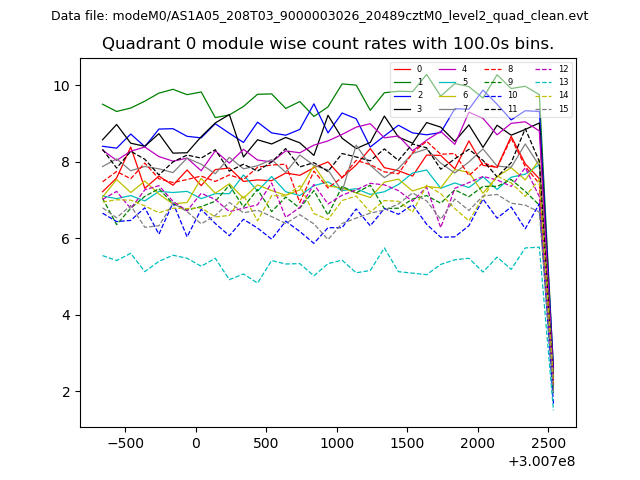 |
 |
| Module-wise count rates for Quadrant B Data is divided into 100 sec bins |
 |
 |
| Module-wise count rates for Quadrant C Data is divided into 100 sec bins |
 |
 |
| Module-wise count rates for Quadrant D Data is divided into 100 sec bins |
 |
 |
| Parameter | Plot |
|---|---|
| CZT HV Monitor | 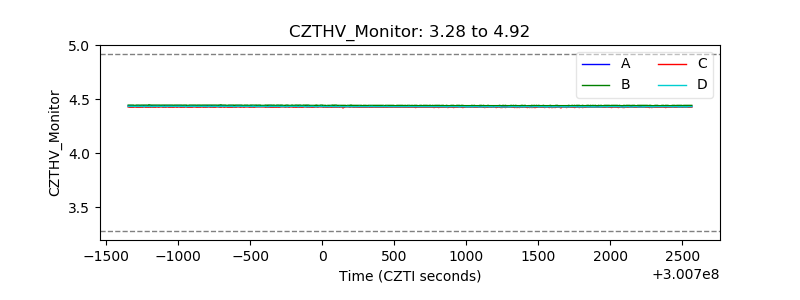 |
| D_VDD | 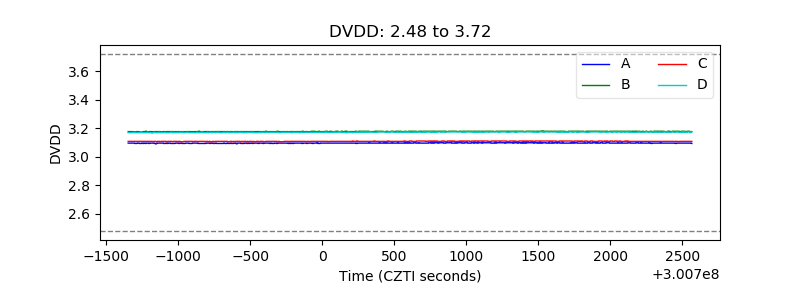 |
| Temperature 1 | 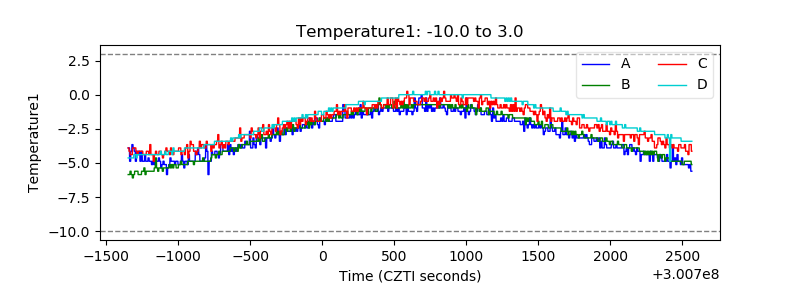 |
| Veto HV Monitor | 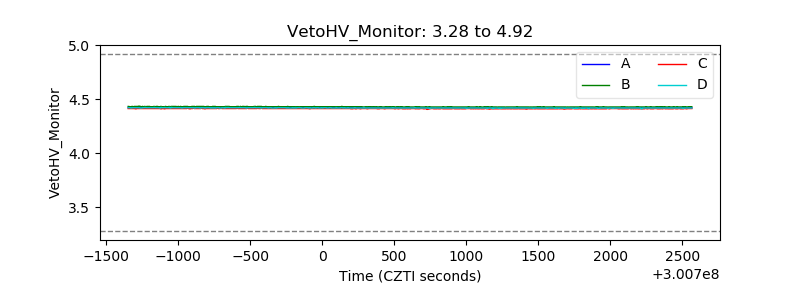 |
| Veto LLD |  |
| Alpha Counter | 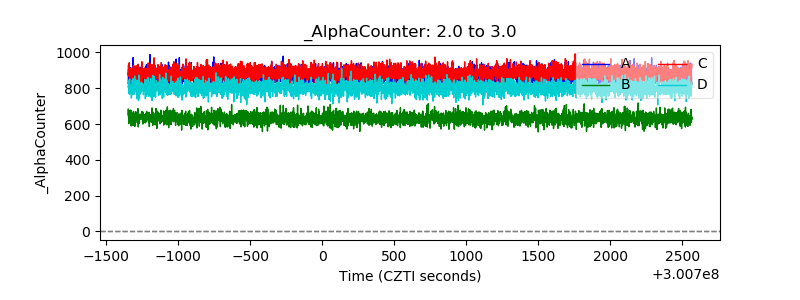 |
| _CPM_Rate | 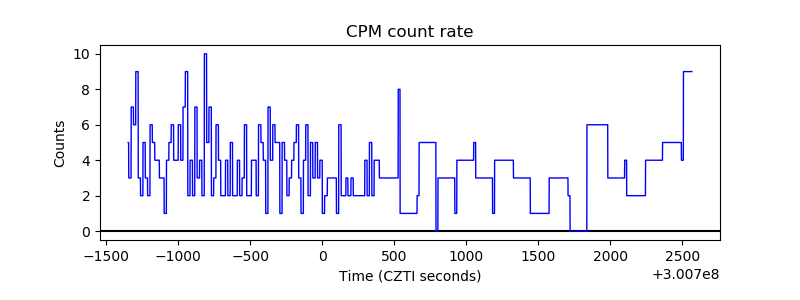 |
| CZT Counter | 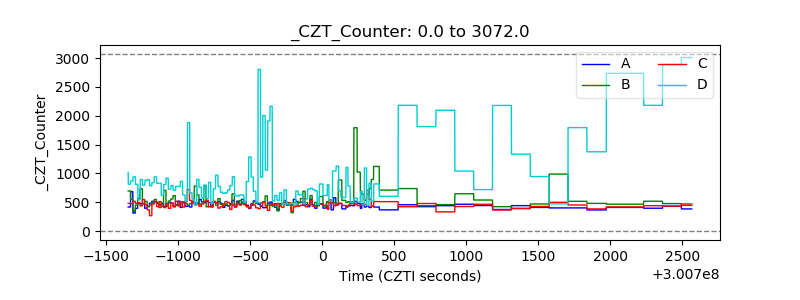 |
| +2.5 Volts monitor |  |
| +5 Volts monitor |  |
| _ROLL_ROT | 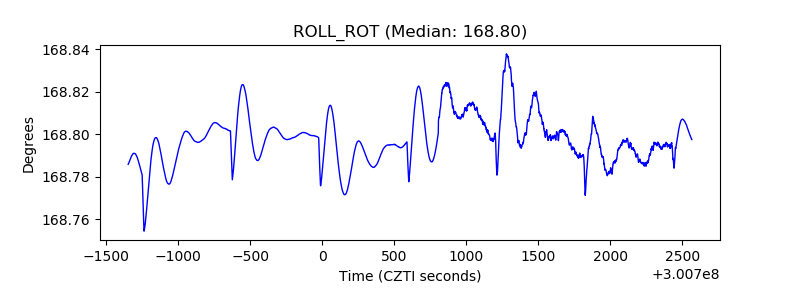 |
| _Roll_DEC | 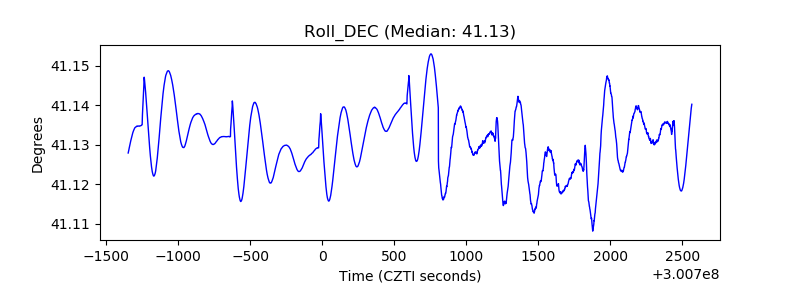 |
| _Roll_RA | 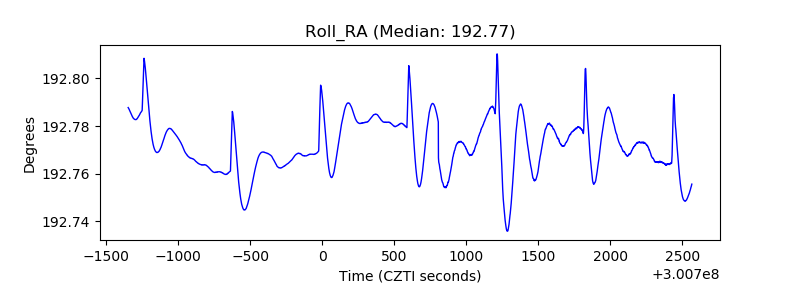 |
| Veto Counter | 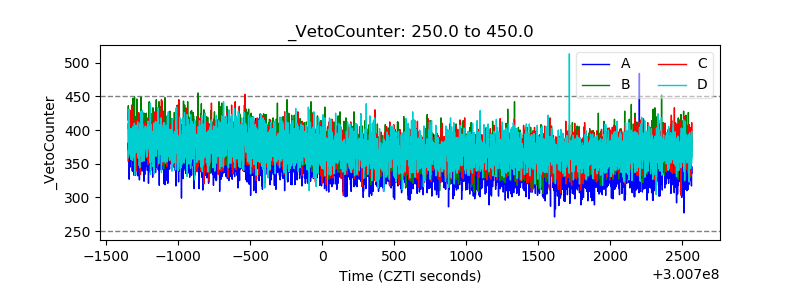 |