| Param | Original file | Final file |
|---|---|---|
| Filename | modeM0/AS1A05_115T01_9000003030cztM0_level2.fits | modeM0/AS1A05_115T01_9000003030cztM0_level2_quad_clean.evt |
| Size (bytes) | 956,090,880 | 694,779,840 |
| Size | 911.8 MB | 662.6 MB |
| Events in quadrant A | 6,004,170 | 3,926,740 |
| Events in quadrant B | 5,754,768 | 3,897,567 |
| Events in quadrant C | 5,832,636 | 3,684,960 |
| Events in quadrant D | 4,598,078 | 2,770,332 |
| Mode M9 | |||
|---|---|---|---|
| Quadrant | BADHDUFLAG | Total packets | Discarded packets |
| A | 0 | 188 | 0 |
| B | 0 | 188 | 0 |
| C | 0 | 188 | 0 |
| D | 0 | 188 | 0 |
| Mode SS | |||
|---|---|---|---|
| Quadrant | BADHDUFLAG | Total packets | Discarded packets |
| A | 0 | 2004 | 0 |
| B | 0 | 2004 | 0 |
| C | 0 | 2004 | 0 |
| D | 0 | 2004 | 0 |
| Mode M0 | |||
|---|---|---|---|
| Quadrant | BADHDUFLAG | Total packets | Discarded packets |
| A | 0 | 208911 | 0 |
| B | 0 | 220722 | 0 |
| C | 0 | 207766 | 0 |
| D | 0 | 381421 | 0 |
| Quadrant | Total seconds | Saturated seconds | Saturation percentage |
|---|---|---|---|
| A | 98609 | 1376 | 1.395410% |
| B | 98613 | 1815 | 1.840528% |
| C | 98610 | 1560 | 1.581990% |
| D | 98607 | 17005 | 17.245226% |
Noise dominated data is calculated using 1-second bins in cleaned event files. If a bin has >2000 counts, and if more than 50% of those come from <1% of pixels, then it is considered to be noise-dominated and hence unusable.
| Quadrant | # 1 sec bins | Bins with >0 counts | Bins with >2000 counts | High rate bins dominated by noise | Noise dominated (total time) | Noise dominated (detector-on time) | Marked lightcurve |
|---|---|---|---|---|---|---|---|
| A | 117229 | 98594 | 0 | 0 | 0.00% | 0.00% | 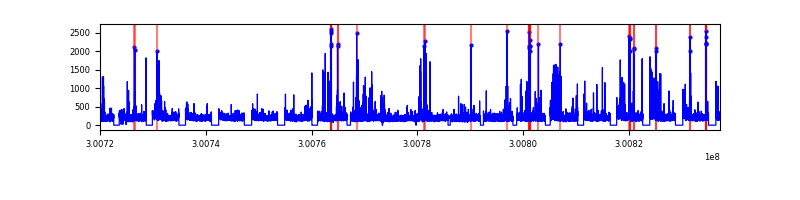 |
| B | 117228 | 98598 | 0 | 0 | 0.00% | 0.00% |  |
| C | 117228 | 98597 | 0 | 0 | 0.00% | 0.00% |  |
| D | 117229 | 98260 | 0 | 0 | 0.00% | 0.00% |  |
Top three noisy pixels from each quadrant. If the there are fewer than three noisy pixels in the level2.evt file, extra rows are filled as -1
| Pixel properties | Quadrant properties | ||||||
|---|---|---|---|---|---|---|---|
| Quadrant | DetID | PixID | Counts | Sigma | Mean | Median | Sigma |
| A | 0 | 29 | 5821 | 11.44 | 1561 | 1471 | 380.1 |
| A | 7 | 110 | 4824 | 8.82 | 1561 | 1471 | 380.1 |
| A | 0 | 30 | 4585 | 8.19 | 1561 | 1471 | 380.1 |
| B | 14 | 254 | 3743 | 7.68 | 1527 | 1457 | 297.7 |
| B | 5 | 128 | 3693 | 7.51 | 1527 | 1457 | 297.7 |
| B | 3 | 17 | 3689 | 7.5 | 1527 | 1457 | 297.7 |
| C | 12 | 241 | 4036 | 6.56 | 1542 | 1441 | 395.5 |
| C | 12 | 250 | 3932 | 6.3 | 1542 | 1441 | 395.5 |
| C | 9 | 209 | 3929 | 6.29 | 1542 | 1441 | 395.5 |
| D | 10 | 189 | 3291 | 5.94 | 1317 | 1199 | 352.3 |
| D | 3 | 14 | 3250 | 5.82 | 1317 | 1199 | 352.3 |
| D | 4 | 160 | 3197 | 5.67 | 1317 | 1199 | 352.3 |
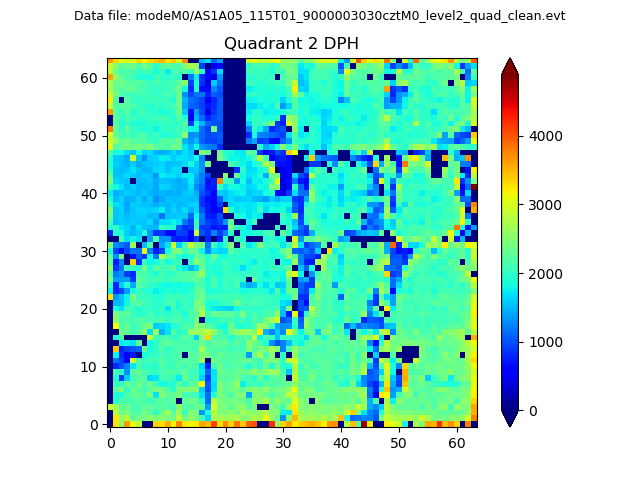
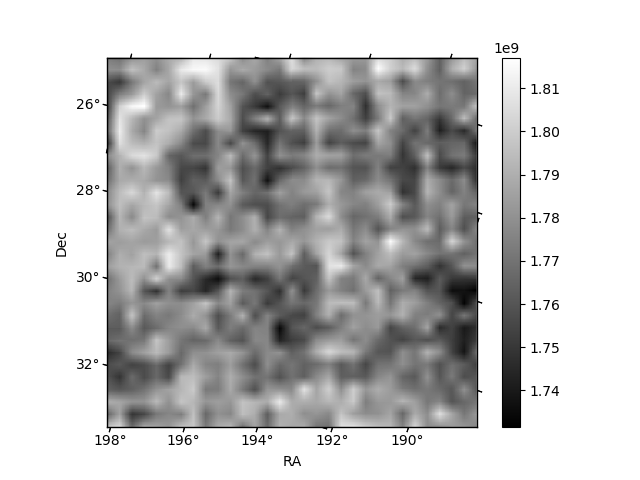
Histogram calculated using DETX and DETY for each event in the final _common_clean file
| Quadrant A |  |
 |
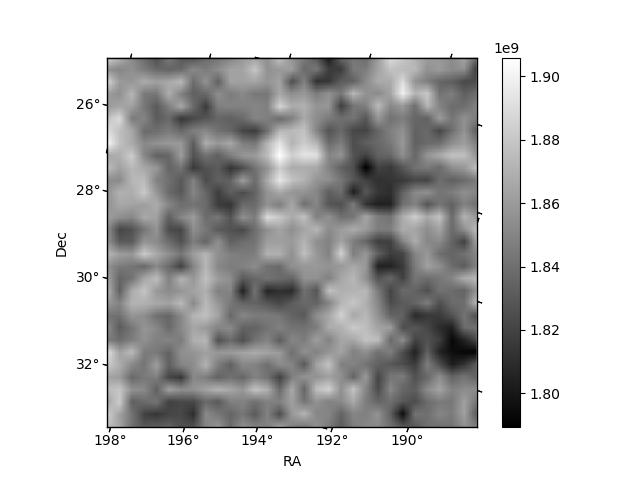
Quadrant B |
|---|---|---|---|
| Quadrant D | 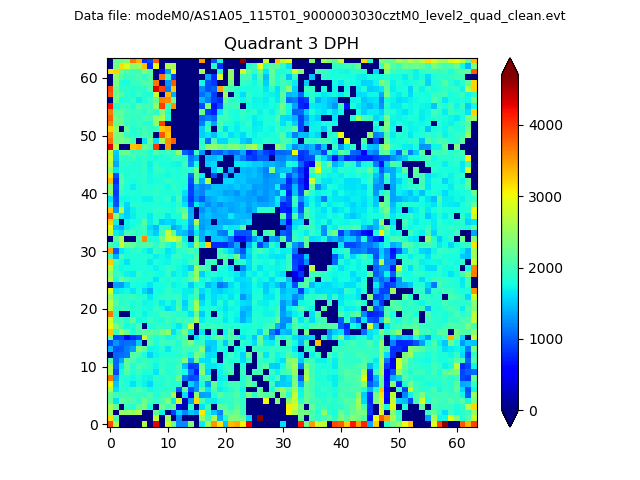 |
 |
Quadrant C |
| Plot type | Count rate plots | Images |
|---|---|---|
| Comparison with Poisson distribution Blue bars denote a histogram of data divided into 1 sec bins. Red curve is a Poisson curve with rate = median count rate of data. |
 |
 |
| Quadrant-wise count rates Data is divided into 100 sec bins |
 |
|
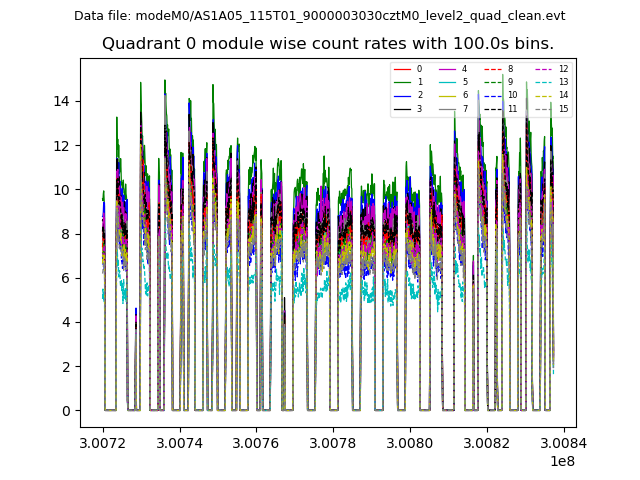
| Module-wise count rates for Quadrant A Data is divided into 100 sec bins |
 |
 |
| Module-wise count rates for Quadrant B Data is divided into 100 sec bins |
 |
 |
| Module-wise count rates for Quadrant C Data is divided into 100 sec bins |
 |
 |
| Module-wise count rates for Quadrant D Data is divided into 100 sec bins |
 |
 |
| Parameter | Plot |
|---|---|
| CZT HV Monitor |  |
| D_VDD | 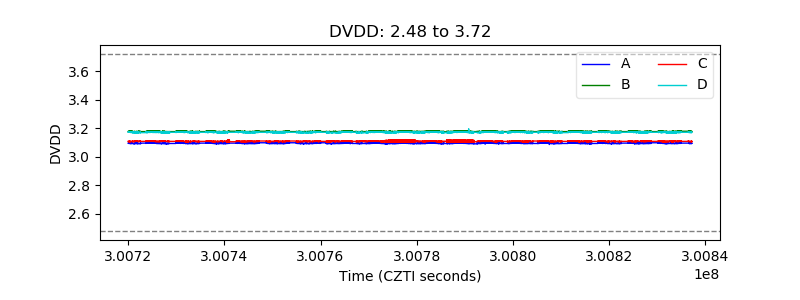 |
| Temperature 1 |  |
| Veto HV Monitor |  |
| Veto LLD |  |
| Alpha Counter |  |
| _CPM_Rate |  |
| CZT Counter |  |
| +2.5 Volts monitor |  |
| +5 Volts monitor |  |
| _ROLL_ROT |  |
| _Roll_DEC |  |
| _Roll_RA |  |
| Veto Counter |  |