| Param | Original file | Final file |
|---|---|---|
| Filename | modeM0/AS1A05_115T01_9000003030_20491cztM0_level2.evt | modeM0/AS1A05_115T01_9000003030_20491cztM0_level2_quad_clean.evt |
| Size (bytes) | 319,394,880 | 44,605,440 |
| Size | 304.6 MB | 42.5 MB |
| Events in quadrant A | 1,905,575 | 279,469 |
| Events in quadrant B | 2,172,432 | 281,675 |
| Events in quadrant C | 1,990,827 | 266,539 |
| Events in quadrant D | 3,334,290 | 243,229 |
| Mode M9 | |||
|---|---|---|---|
| Quadrant | BADHDUFLAG | Total packets | Discarded packets |
| A | 0 | 10 | 0 |
| B | 0 | 10 | 0 |
| C | 0 | 10 | 0 |
| D | 0 | 10 | 0 |
| Mode SS | |||
|---|---|---|---|
| Quadrant | BADHDUFLAG | Total packets | Discarded packets |
| A | 0 | 80 | 0 |
| B | 0 | 80 | 0 |
| C | 0 | 80 | 0 |
| D | 0 | 80 | 0 |
| Mode M0 | |||
|---|---|---|---|
| Quadrant | BADHDUFLAG | Total packets | Discarded packets |
| A | 0 | 8284 | 10 |
| B | 0 | 9035 | 4 |
| C | 0 | 8410 | 8 |
| D | 0 | 12658 | 35 |
| Quadrant | Total seconds | Saturated seconds | Saturation percentage |
|---|---|---|---|
| A | 3958 | 22 | 0.555836% |
| B | 3961 | 39 | 0.984600% |
| C | 3958 | 47 | 1.187468% |
| D | 3955 | 427 | 10.796460% |
Noise dominated data is calculated using 1-second bins in cleaned event files. If a bin has >2000 counts, and if more than 50% of those come from <1% of pixels, then it is considered to be noise-dominated and hence unusable.
| Quadrant | # 1 sec bins | Bins with >0 counts | Bins with >2000 counts | High rate bins dominated by noise | Noise dominated (total time) | Noise dominated (detector-on time) | Marked lightcurve |
|---|---|---|---|---|---|---|---|
| A | 4997 | 3962 | 2 | 2 | 0.04% | 0.05% | 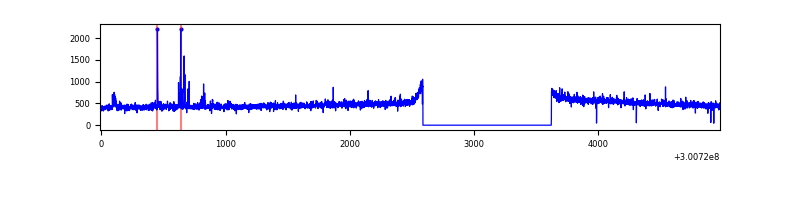 |
| B | 4996 | 3962 | 3 | 3 | 0.06% | 0.08% | 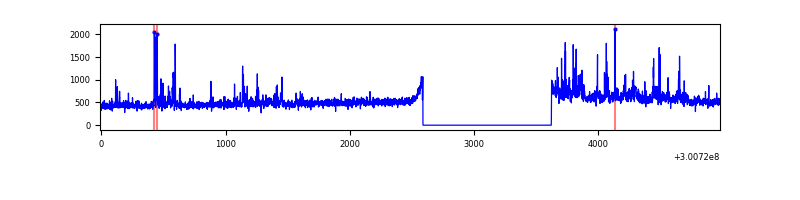 |
| C | 4996 | 3961 | 0 | 0 | 0.00% | 0.00% | 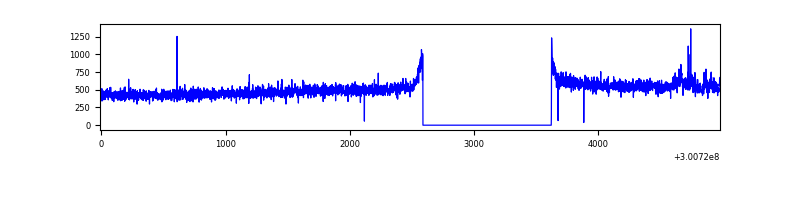 |
| D | 4996 | 3957 | 368 | 368 | 7.37% | 9.30% | 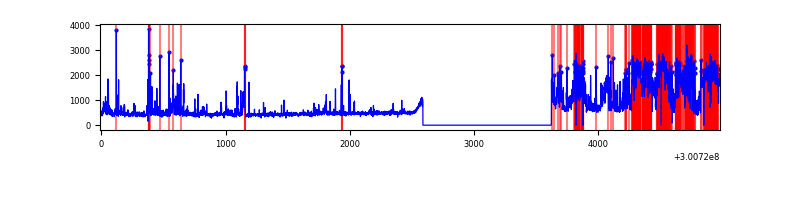 |
Top three noisy pixels from each quadrant. If the there are fewer than three noisy pixels in the level2.evt file, extra rows are filled as -1
| Pixel properties | Quadrant properties | ||||||
|---|---|---|---|---|---|---|---|
| Quadrant | DetID | PixID | Counts | Sigma | Mean | Median | Sigma |
| A | 12 | 96 | 28332 | 281.53 | 488 | 477 | 98.9 |
| A | 0 | 226 | 4362 | 39.27 | 488 | 477 | 98.9 |
| A | 3 | 137 | 3912 | 34.72 | 488 | 477 | 98.9 |
| B | 0 | 189 | 96945 | 1010.37 | 489 | 477 | 95.5 |
| B | 0 | 197 | 71710 | 746.07 | 489 | 477 | 95.5 |
| B | 0 | 219 | 45773 | 474.42 | 489 | 477 | 95.5 |
| C | 3 | 233 | 91078 | 825.69 | 467 | 470 | 109.7 |
| C | 14 | 238 | 72607 | 657.37 | 467 | 470 | 109.7 |
| C | 0 | 207 | 4923 | 40.58 | 467 | 470 | 109.7 |
| D | 7 | 38 | 841234 | 7341.18 | 464 | 450 | 114.5 |
| D | 7 | 238 | 155545 | 1354.19 | 464 | 450 | 114.5 |
| D | 5 | 222 | 139956 | 1218.08 | 464 | 450 | 114.5 |
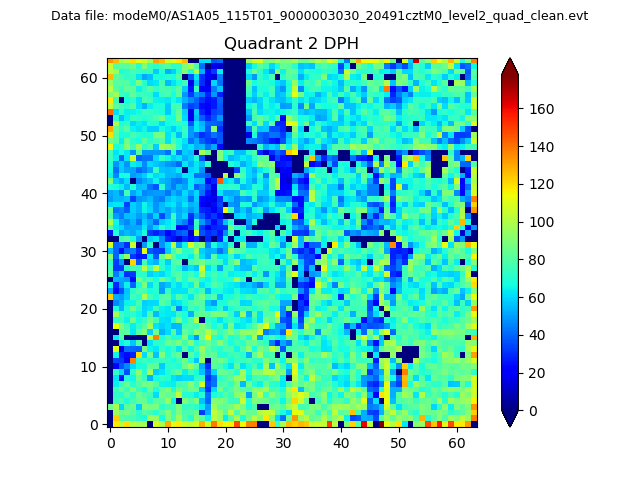
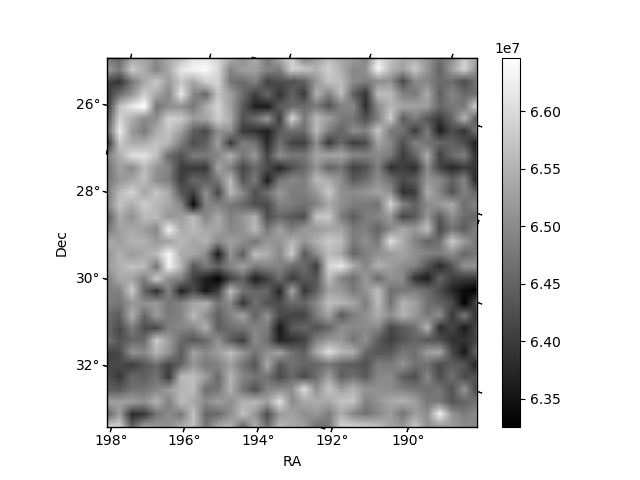
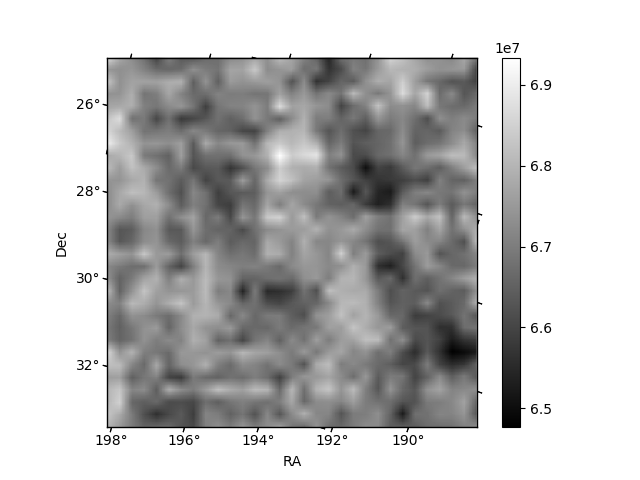
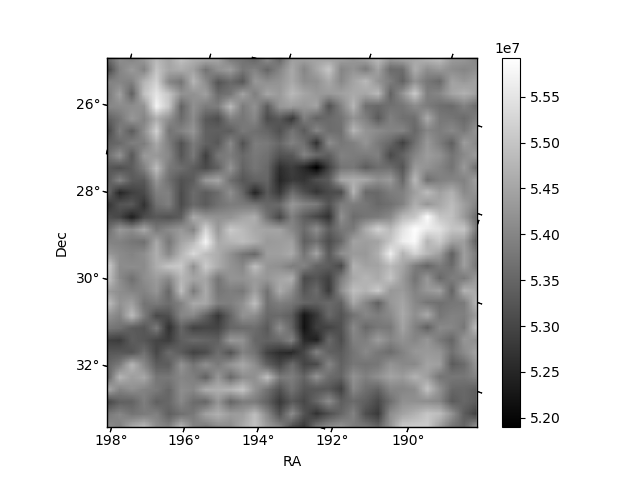
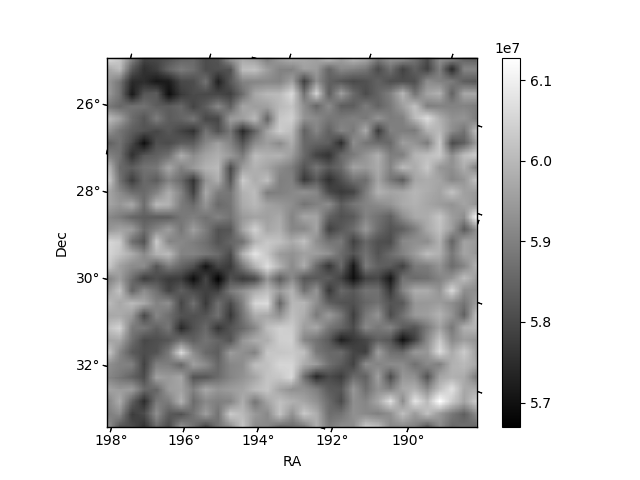
Histogram calculated using DETX and DETY for each event in the final _common_clean file
| Quadrant A |  |
 |
Quadrant B |
|---|---|---|---|
| Quadrant D | 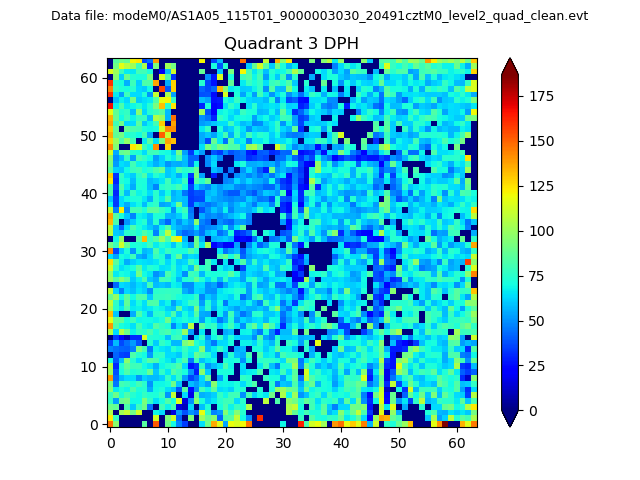 |
 |
Quadrant C |
| Plot type | Count rate plots | Images |
|---|---|---|
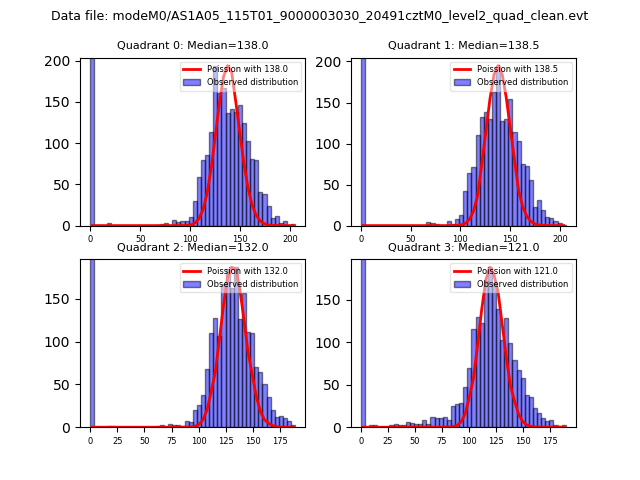
| Comparison with Poisson distribution Blue bars denote a histogram of data divided into 1 sec bins. Red curve is a Poisson curve with rate = median count rate of data. |
 |
 |
| Quadrant-wise count rates Data is divided into 100 sec bins |
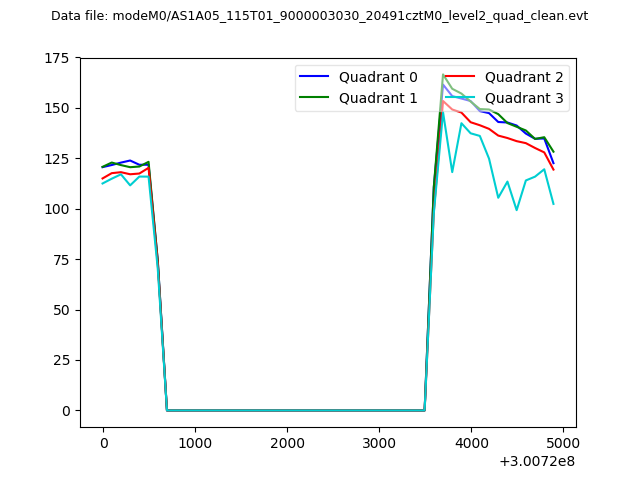 |
|
| Module-wise count rates for Quadrant A Data is divided into 100 sec bins |
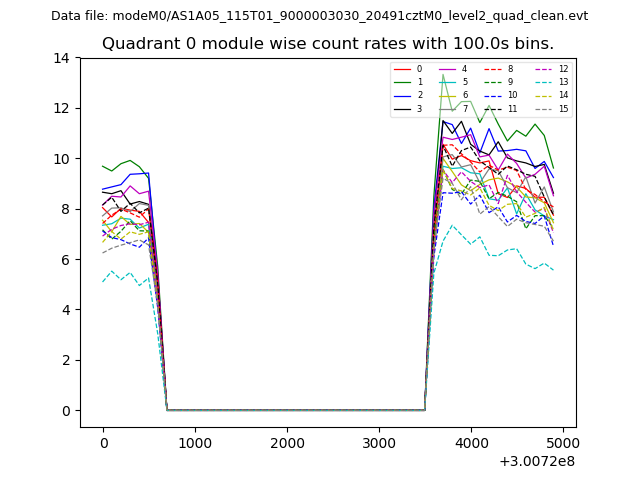 |
 |
| Module-wise count rates for Quadrant B Data is divided into 100 sec bins |
 |
 |
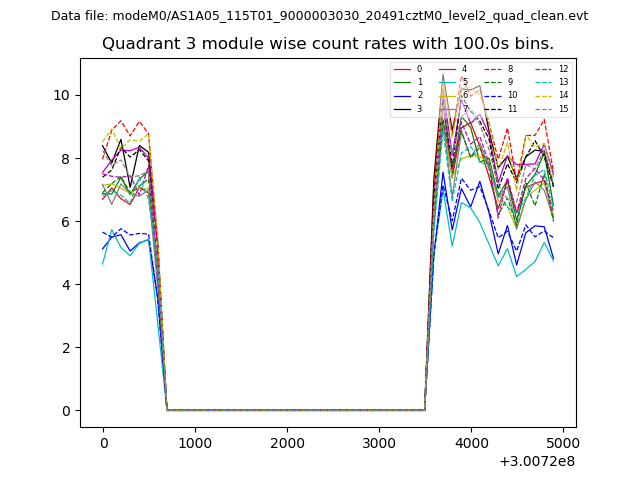
| Module-wise count rates for Quadrant C Data is divided into 100 sec bins |
 |
 |
| Module-wise count rates for Quadrant D Data is divided into 100 sec bins |
 |
 |
| Parameter | Plot |
|---|---|
| CZT HV Monitor | 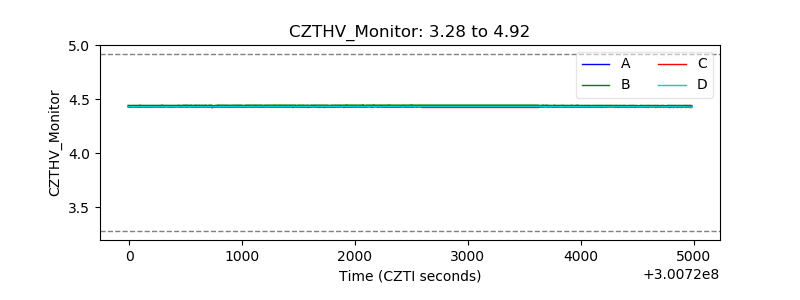 |
| D_VDD | 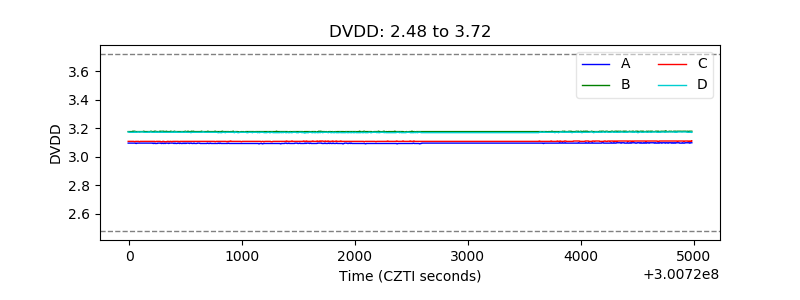 |
| Temperature 1 | 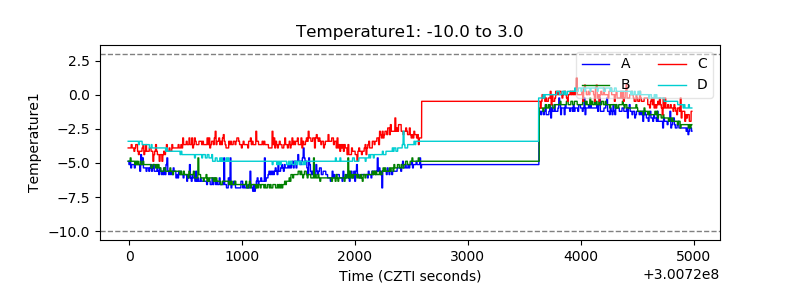 |
| Veto HV Monitor | 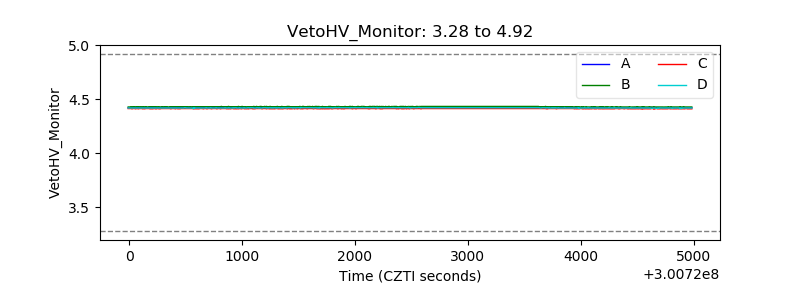 |
| Veto LLD | 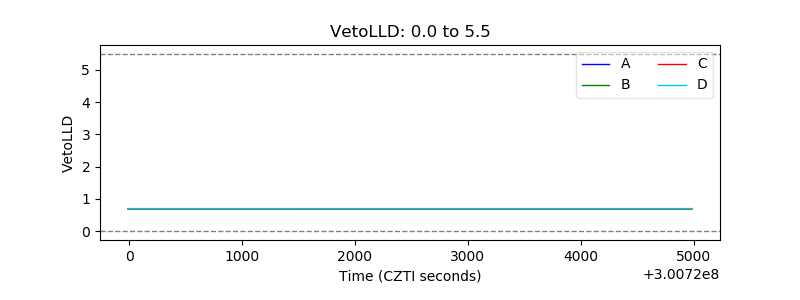 |
| Alpha Counter | 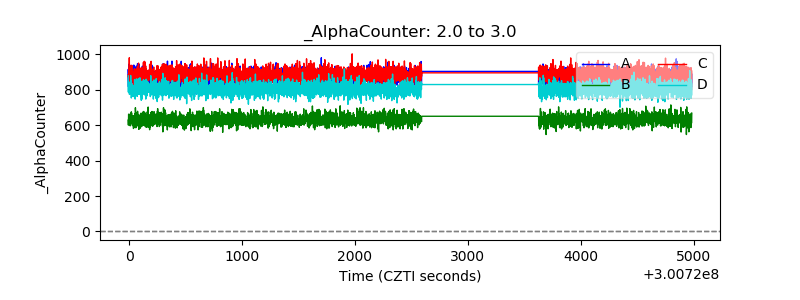 |
| _CPM_Rate | 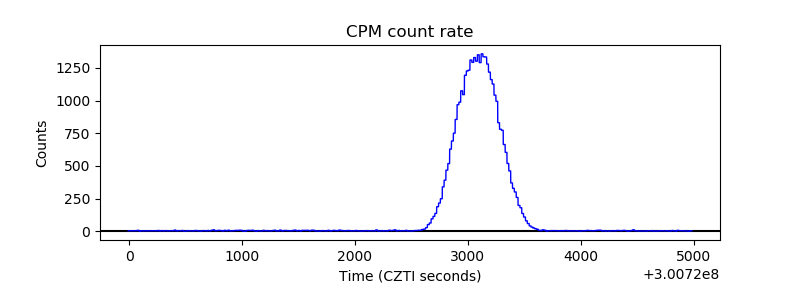 |
| CZT Counter | 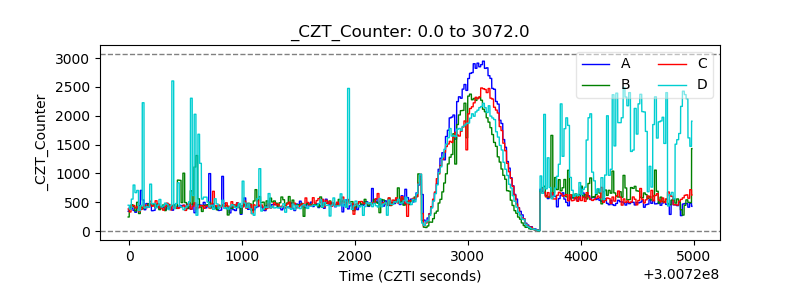 |
| +2.5 Volts monitor | 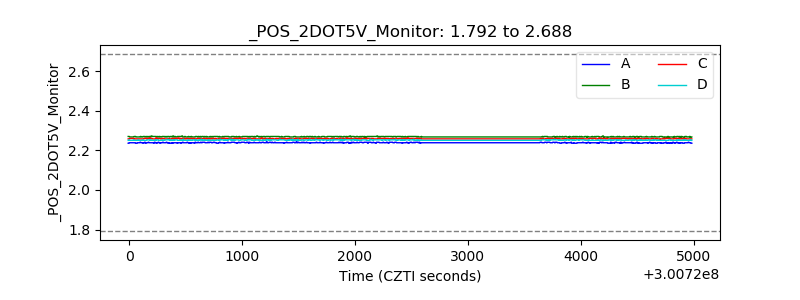 |
| +5 Volts monitor |  |
| _ROLL_ROT | 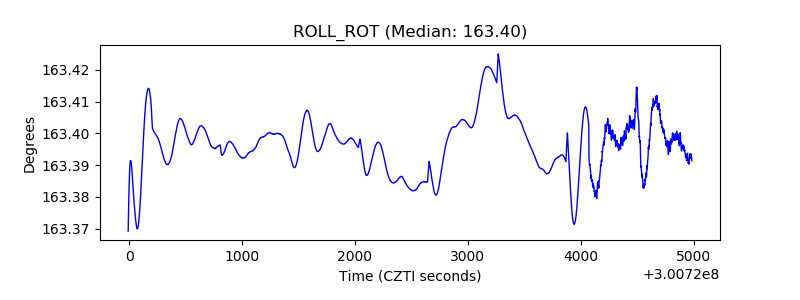 |
| _Roll_DEC | 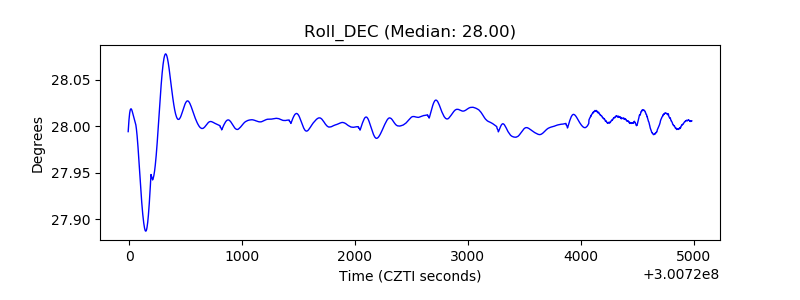 |
| _Roll_RA | 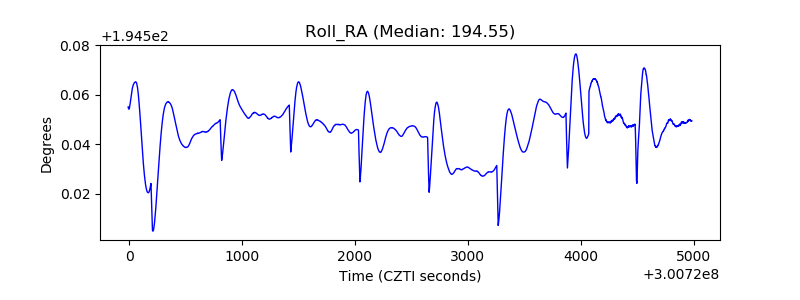 |
| Veto Counter | 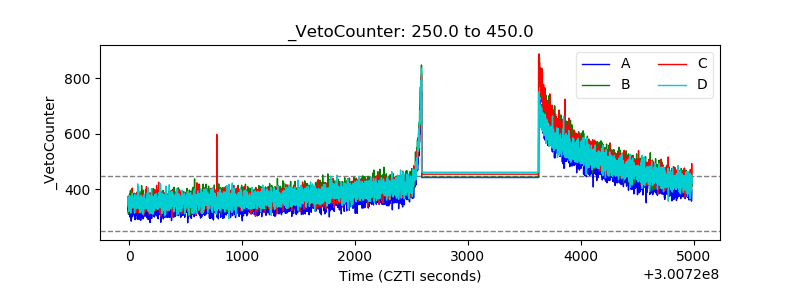 |