| Param | Original file | Final file |
|---|---|---|
| Filename | modeM0/AS1A05_115T01_9000003030_20494cztM0_level2.evt | modeM0/AS1A05_115T01_9000003030_20494cztM0_level2_quad_clean.evt |
| Size (bytes) | 580,821,120 | 92,269,440 |
| Size | 553.9 MB | 88.0 MB |
| Events in quadrant A | 3,200,012 | 622,089 |
| Events in quadrant B | 3,614,615 | 628,648 |
| Events in quadrant C | 3,400,240 | 597,682 |
| Events in quadrant D | 6,954,763 | 511,731 |
| Mode M9 | |||
|---|---|---|---|
| Quadrant | BADHDUFLAG | Total packets | Discarded packets |
| A | 0 | 13 | 0 |
| B | 0 | 14 | 0 |
| C | 0 | 14 | 0 |
| D | 0 | 14 | 0 |
| Mode SS | |||
|---|---|---|---|
| Quadrant | BADHDUFLAG | Total packets | Discarded packets |
| A | 0 | 124 | 0 |
| B | 0 | 124 | 0 |
| C | 0 | 124 | 0 |
| D | 0 | 124 | 0 |
| Mode M0 | |||
|---|---|---|---|
| Quadrant | BADHDUFLAG | Total packets | Discarded packets |
| A | 0 | 13523 | 2 |
| B | 0 | 14848 | 2 |
| C | 0 | 14110 | 2 |
| D | 0 | 24926 | 3 |
| Quadrant | Total seconds | Saturated seconds | Saturation percentage |
|---|---|---|---|
| A | 6220 | 21 | 0.337621% |
| B | 6220 | 92 | 1.479100% |
| C | 6220 | 78 | 1.254019% |
| D | 6219 | 1101 | 17.703811% |
Noise dominated data is calculated using 1-second bins in cleaned event files. If a bin has >2000 counts, and if more than 50% of those come from <1% of pixels, then it is considered to be noise-dominated and hence unusable.
| Quadrant | # 1 sec bins | Bins with >0 counts | Bins with >2000 counts | High rate bins dominated by noise | Noise dominated (total time) | Noise dominated (detector-on time) | Marked lightcurve |
|---|---|---|---|---|---|---|---|
| A | 7495 | 6221 | 2 | 2 | 0.03% | 0.03% | 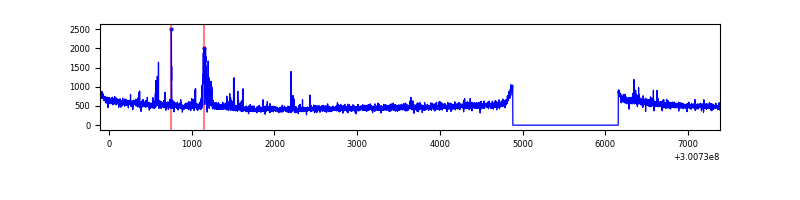 |
| B | 7495 | 6221 | 21 | 21 | 0.28% | 0.34% | 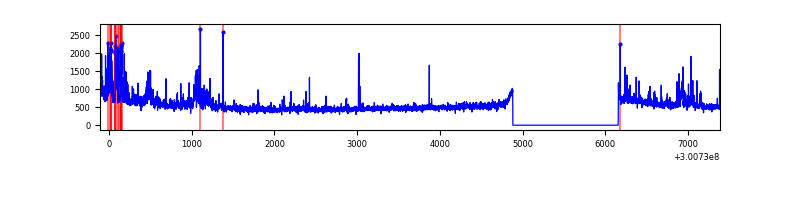 |
| C | 7495 | 6221 | 0 | 0 | 0.00% | 0.00% |  |
| D | 7494 | 6220 | 1113 | 1113 | 14.85% | 17.89% | 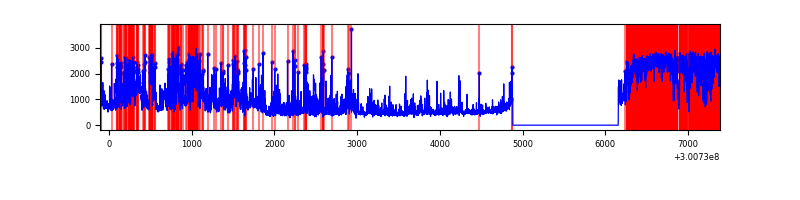 |
Top three noisy pixels from each quadrant. If the there are fewer than three noisy pixels in the level2.evt file, extra rows are filled as -1
| Pixel properties | Quadrant properties | ||||||
|---|---|---|---|---|---|---|---|
| Quadrant | DetID | PixID | Counts | Sigma | Mean | Median | Sigma |
| A | 12 | 96 | 130313 | 820.96 | 796 | 782 | 157.8 |
| A | 0 | 226 | 7033 | 39.62 | 796 | 782 | 157.8 |
| A | 3 | 137 | 5777 | 31.66 | 796 | 782 | 157.8 |
| B | 0 | 197 | 241277 | 1623.4 | 796 | 778 | 148.1 |
| B | 0 | 189 | 160721 | 1079.63 | 796 | 778 | 148.1 |
| B | 0 | 190 | 45209 | 299.91 | 796 | 778 | 148.1 |
| C | 3 | 233 | 288513 | 1612.95 | 766 | 773 | 178.4 |
| C | 14 | 238 | 121161 | 674.85 | 766 | 773 | 178.4 |
| C | 13 | 61 | 5506 | 26.53 | 766 | 773 | 178.4 |
| D | 7 | 38 | 1762178 | 9968.54 | 730 | 709 | 176.7 |
| D | 2 | 16 | 852789 | 4822.11 | 730 | 709 | 176.7 |
| D | 7 | 238 | 588644 | 3327.25 | 730 | 709 | 176.7 |
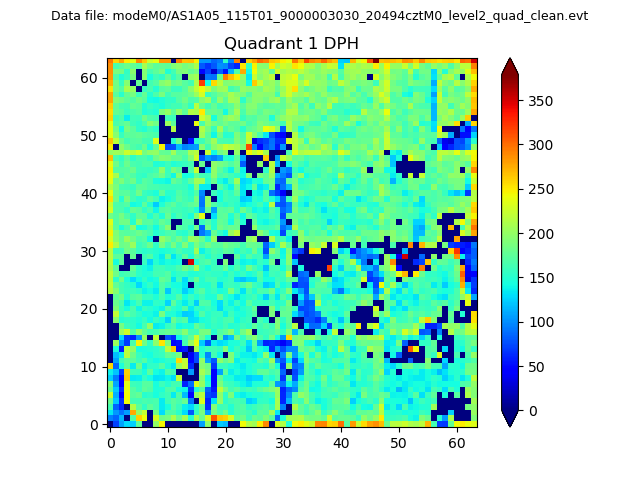
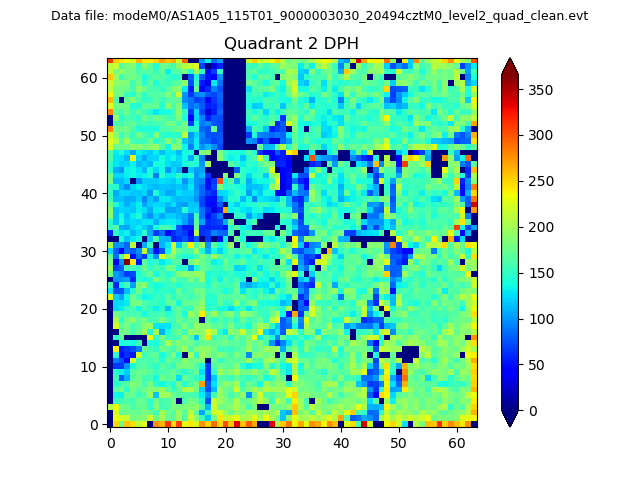
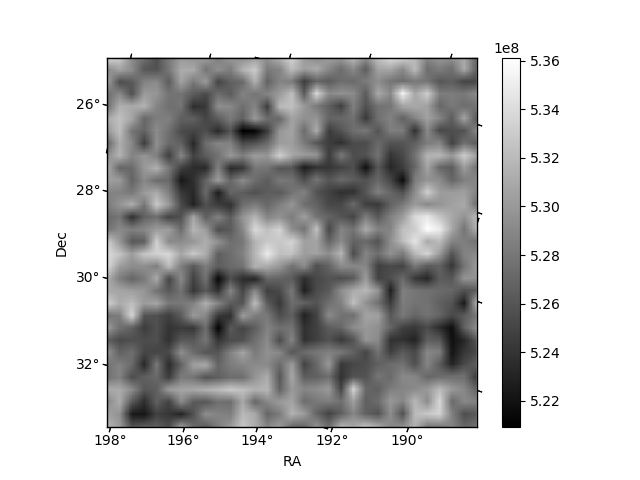
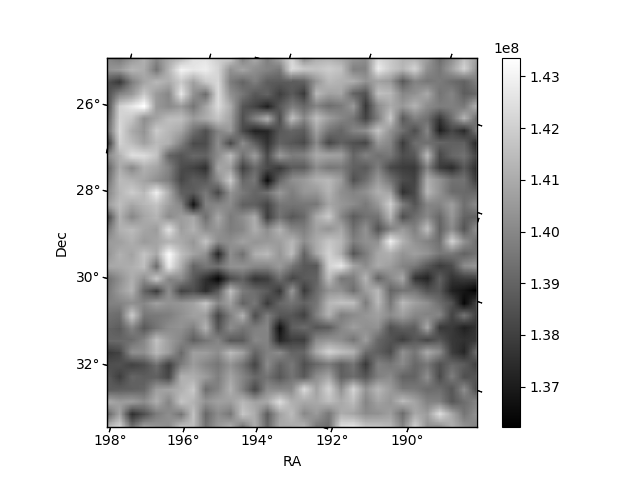
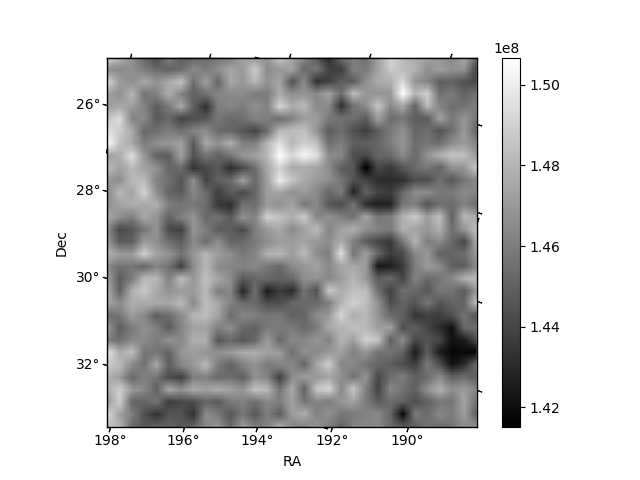
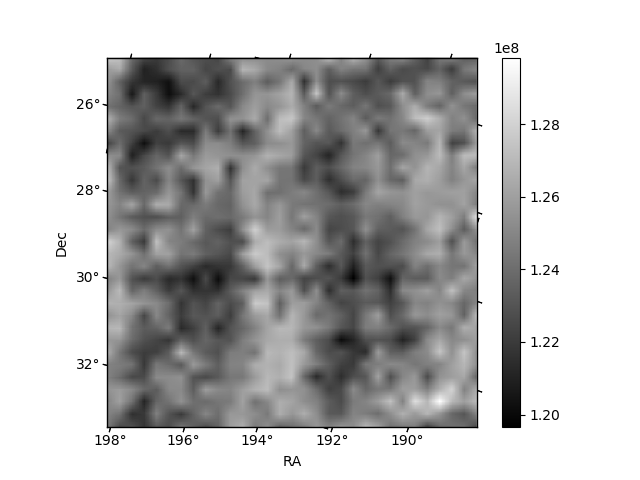
Histogram calculated using DETX and DETY for each event in the final _common_clean file
| Quadrant A | 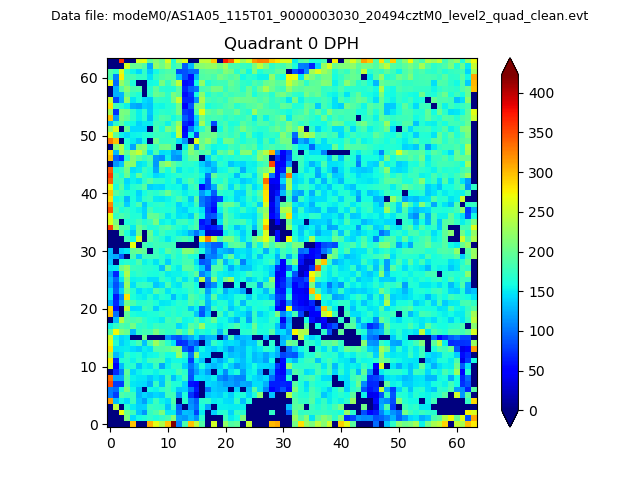 |
 |
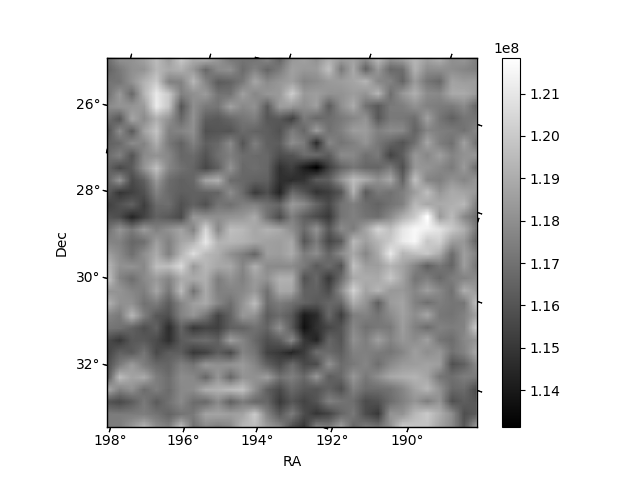
Quadrant B |
|---|---|---|---|
| Quadrant D | 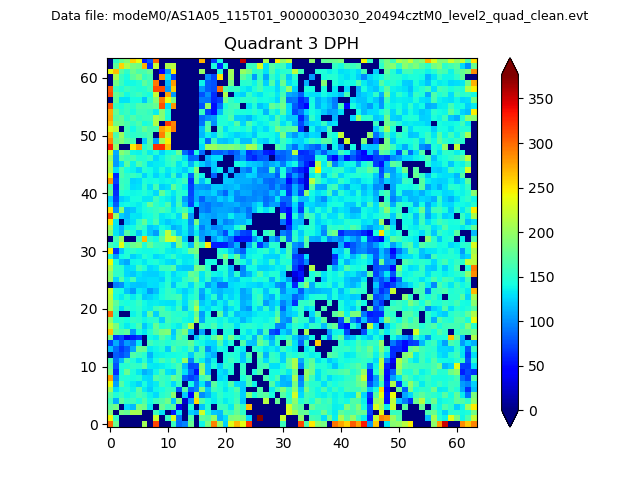 |
 |
Quadrant C |
| Plot type | Count rate plots | Images |
|---|---|---|
| Comparison with Poisson distribution Blue bars denote a histogram of data divided into 1 sec bins. Red curve is a Poisson curve with rate = median count rate of data. |
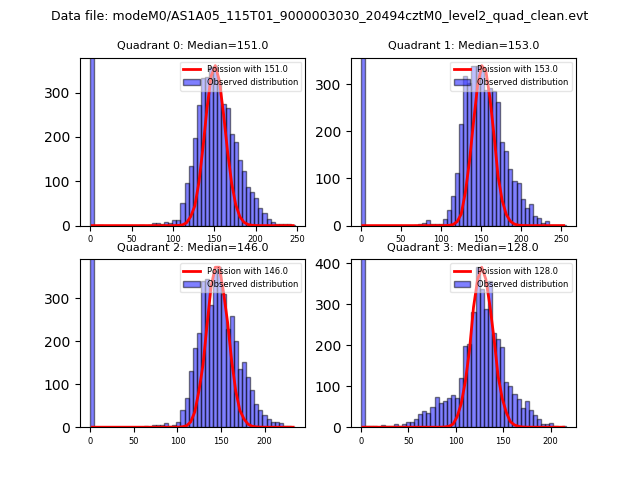 |
 |
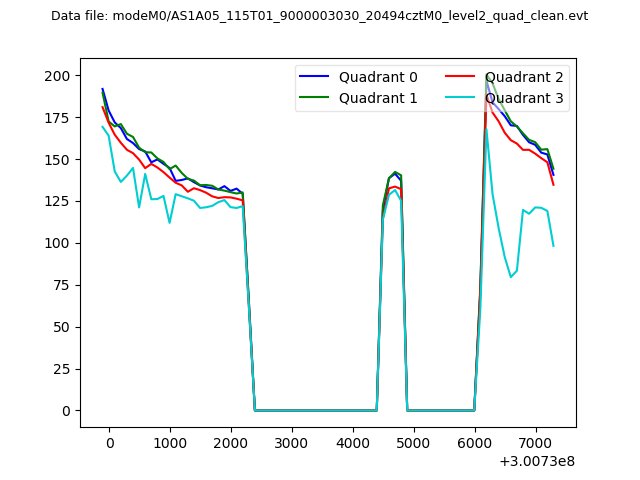
| Quadrant-wise count rates Data is divided into 100 sec bins |
 |
|
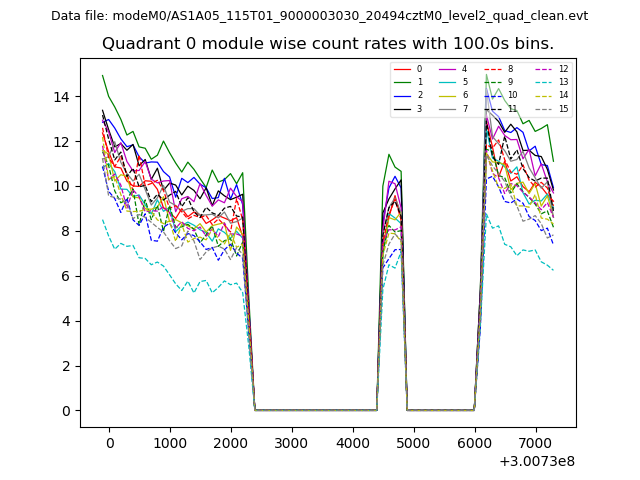
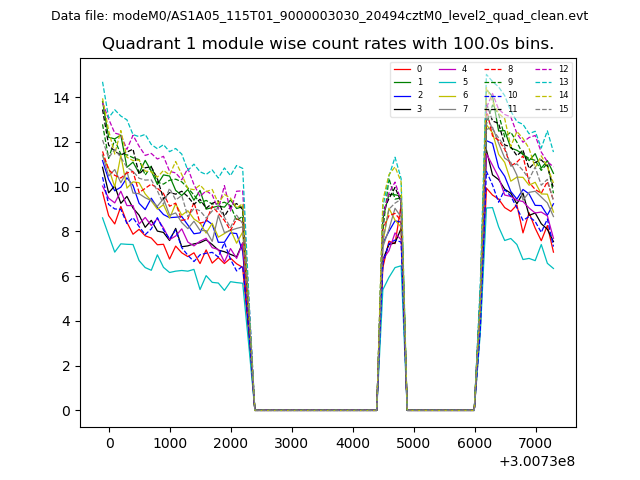
| Module-wise count rates for Quadrant A Data is divided into 100 sec bins |
 |
 |
| Module-wise count rates for Quadrant B Data is divided into 100 sec bins |
 |
 |
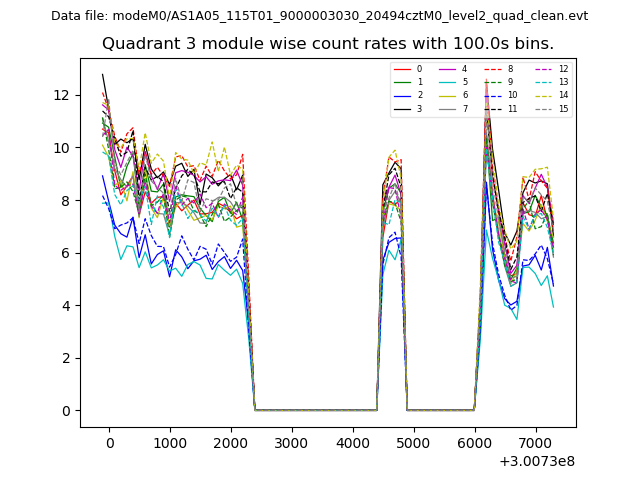
| Module-wise count rates for Quadrant C Data is divided into 100 sec bins |
 |
 |
| Module-wise count rates for Quadrant D Data is divided into 100 sec bins |
 |
 |
| Parameter | Plot |
|---|---|
| CZT HV Monitor | 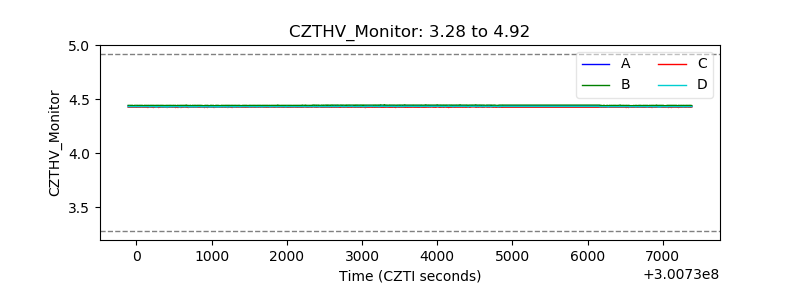 |
| D_VDD | 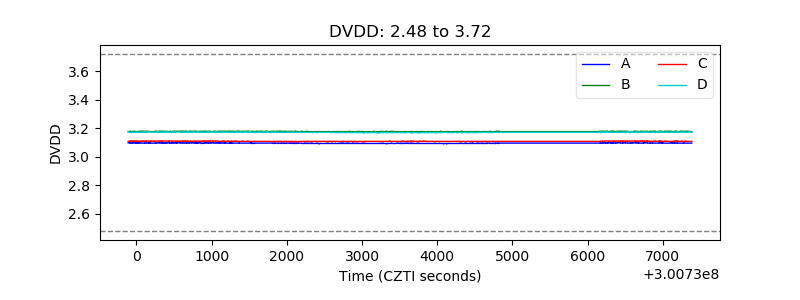 |
| Temperature 1 | 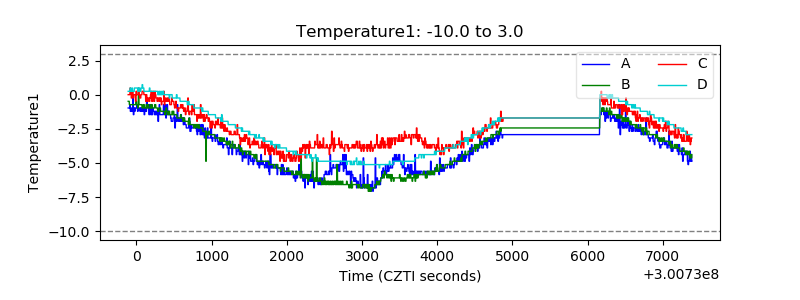 |
| Veto HV Monitor | 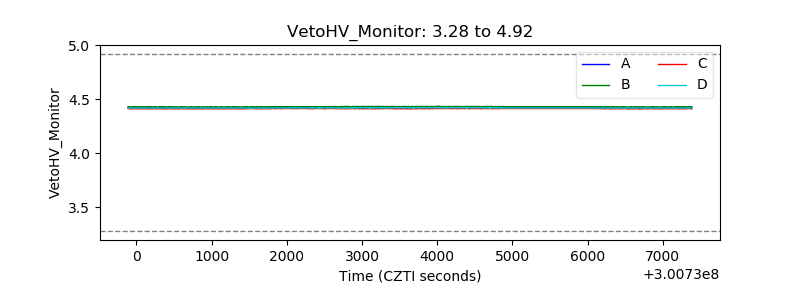 |
| Veto LLD | 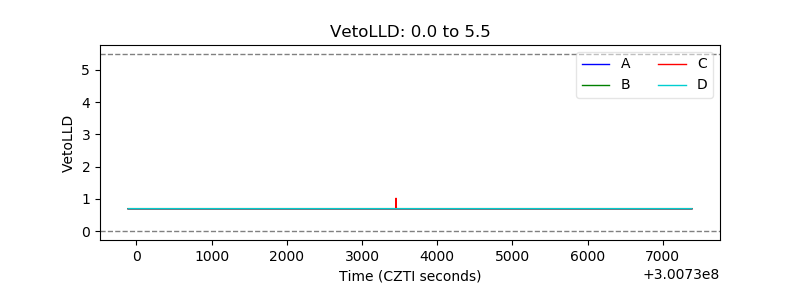 |
| Alpha Counter | 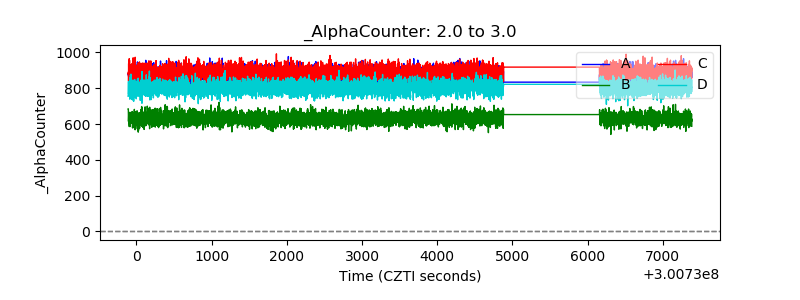 |
| _CPM_Rate | 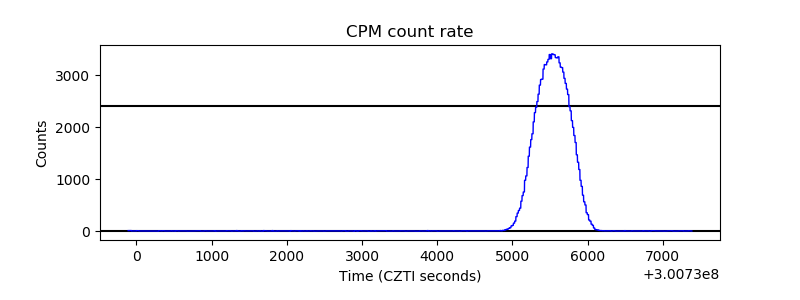 |
| CZT Counter | 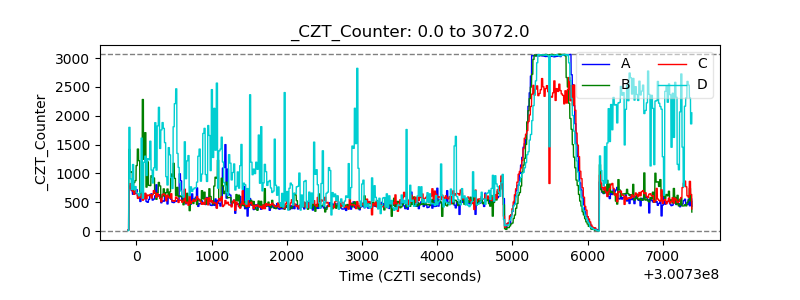 |
| +2.5 Volts monitor | 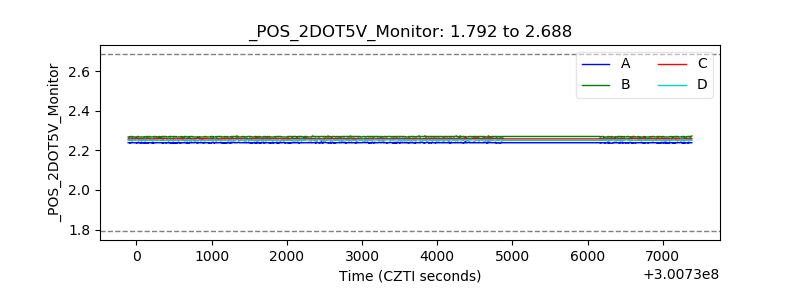 |
| +5 Volts monitor |  |
| _ROLL_ROT | 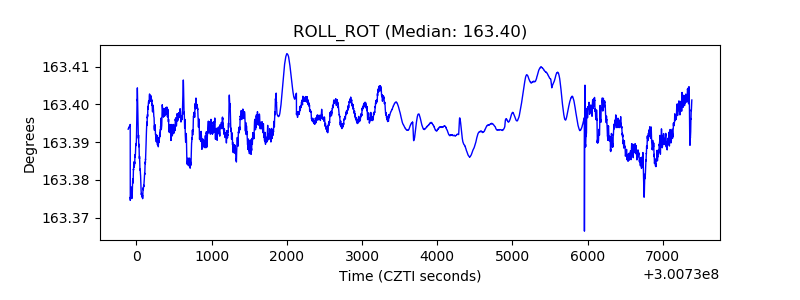 |
| _Roll_DEC | 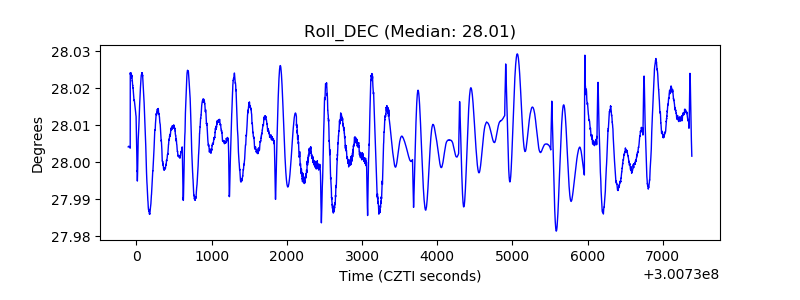 |
| _Roll_RA |  |
| Veto Counter | 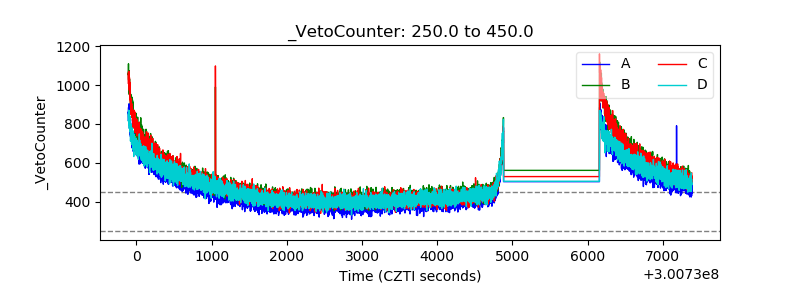 |