| Param | Original file | Final file |
|---|---|---|
| Filename | modeM0/AS1A05_115T01_9000003030_20495cztM0_level2.evt | modeM0/AS1A05_115T01_9000003030_20495cztM0_level2_quad_clean.evt |
| Size (bytes) | 564,200,640 | 95,063,040 |
| Size | 538.1 MB | 90.7 MB |
| Events in quadrant A | 3,127,392 | 641,243 |
| Events in quadrant B | 3,459,963 | 657,390 |
| Events in quadrant C | 3,393,503 | 616,380 |
| Events in quadrant D | 6,685,120 | 529,841 |
| Mode M9 | |||
|---|---|---|---|
| Quadrant | BADHDUFLAG | Total packets | Discarded packets |
| A | 0 | 14 | 0 |
| B | 0 | 14 | 0 |
| C | 0 | 14 | 0 |
| D | 0 | 14 | 0 |
| Mode SS | |||
|---|---|---|---|
| Quadrant | BADHDUFLAG | Total packets | Discarded packets |
| A | 0 | 126 | 0 |
| B | 0 | 126 | 0 |
| C | 0 | 126 | 0 |
| D | 0 | 126 | 0 |
| Mode M0 | |||
|---|---|---|---|
| Quadrant | BADHDUFLAG | Total packets | Discarded packets |
| A | 0 | 13150 | 2 |
| B | 0 | 14214 | 2 |
| C | 0 | 14071 | 2 |
| D | 0 | 24121 | 2 |
| Quadrant | Total seconds | Saturated seconds | Saturation percentage |
|---|---|---|---|
| A | 6213 | 35 | 0.563335% |
| B | 6214 | 56 | 0.901191% |
| C | 6214 | 83 | 1.335694% |
| D | 6214 | 1058 | 17.026070% |
Noise dominated data is calculated using 1-second bins in cleaned event files. If a bin has >2000 counts, and if more than 50% of those come from <1% of pixels, then it is considered to be noise-dominated and hence unusable.
| Quadrant | # 1 sec bins | Bins with >0 counts | Bins with >2000 counts | High rate bins dominated by noise | Noise dominated (total time) | Noise dominated (detector-on time) | Marked lightcurve |
|---|---|---|---|---|---|---|---|
| A | 7578 | 6214 | 0 | 0 | 0.00% | 0.00% | 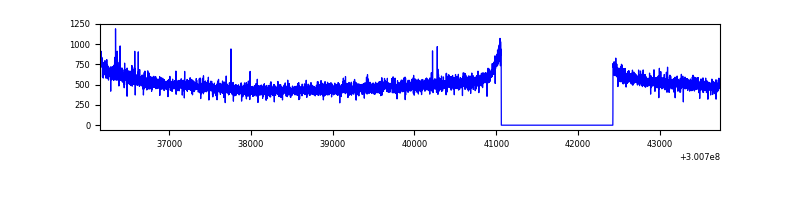 |
| B | 7579 | 6215 | 3 | 3 | 0.04% | 0.05% | 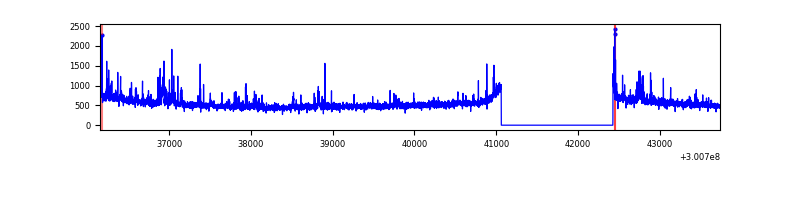 |
| C | 7579 | 6214 | 0 | 0 | 0.00% | 0.00% | 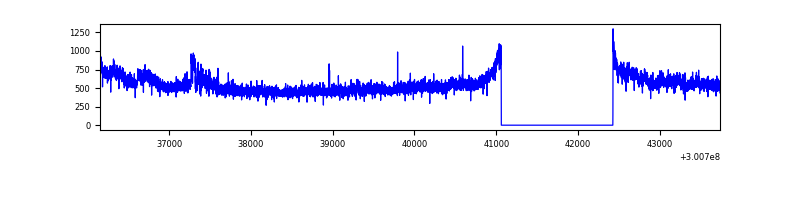 |
| D | 7579 | 6214 | 1125 | 1125 | 14.84% | 18.10% | 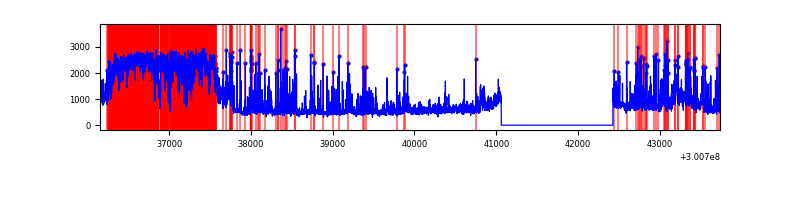 |
Top three noisy pixels from each quadrant. If the there are fewer than three noisy pixels in the level2.evt file, extra rows are filled as -1
| Pixel properties | Quadrant properties | ||||||
|---|---|---|---|---|---|---|---|
| Quadrant | DetID | PixID | Counts | Sigma | Mean | Median | Sigma |
| A | 12 | 96 | 8679 | 49.23 | 808 | 794 | 160.2 |
| A | 11 | 29 | 7933 | 44.58 | 808 | 794 | 160.2 |
| A | 0 | 226 | 7193 | 39.96 | 808 | 794 | 160.2 |
| B | 0 | 189 | 101123 | 661.86 | 817 | 799 | 151.6 |
| B | 0 | 197 | 47570 | 308.56 | 817 | 799 | 151.6 |
| B | 0 | 190 | 43116 | 279.18 | 817 | 799 | 151.6 |
| C | 3 | 233 | 217487 | 1185.36 | 782 | 787 | 182.8 |
| C | 14 | 238 | 123098 | 669.05 | 782 | 787 | 182.8 |
| C | 13 | 61 | 5345 | 24.93 | 782 | 787 | 182.8 |
| D | 7 | 38 | 1924799 | 10690.64 | 744 | 724 | 180.0 |
| D | 2 | 16 | 840897 | 4668.21 | 744 | 724 | 180.0 |
| D | 1 | 52 | 477191 | 2647.37 | 744 | 724 | 180.0 |
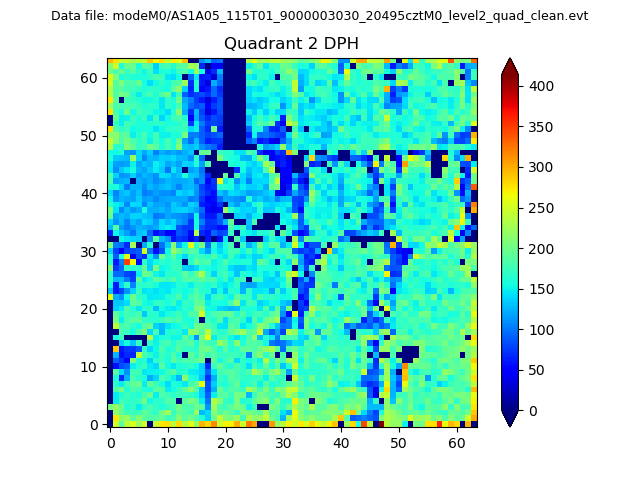
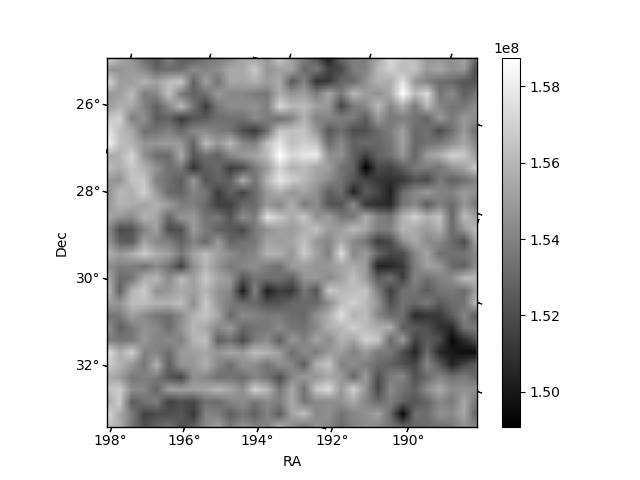
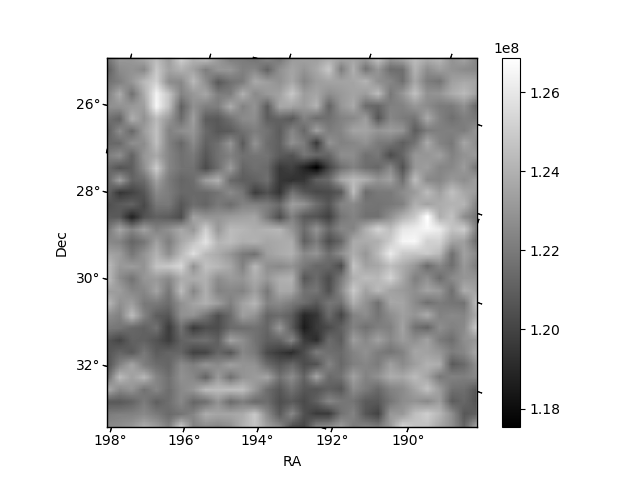
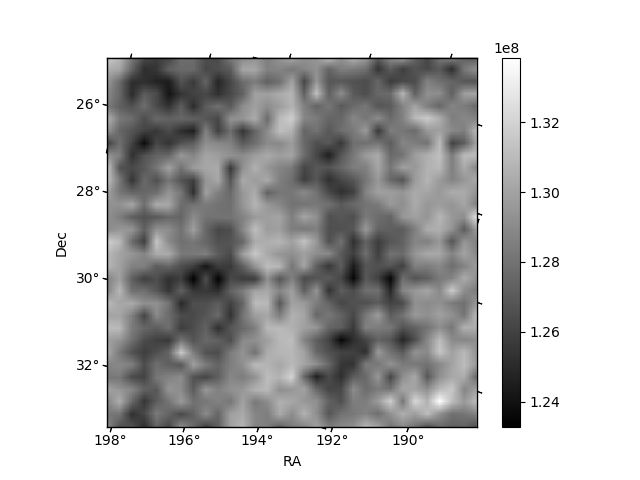
Histogram calculated using DETX and DETY for each event in the final _common_clean file
| Quadrant A | 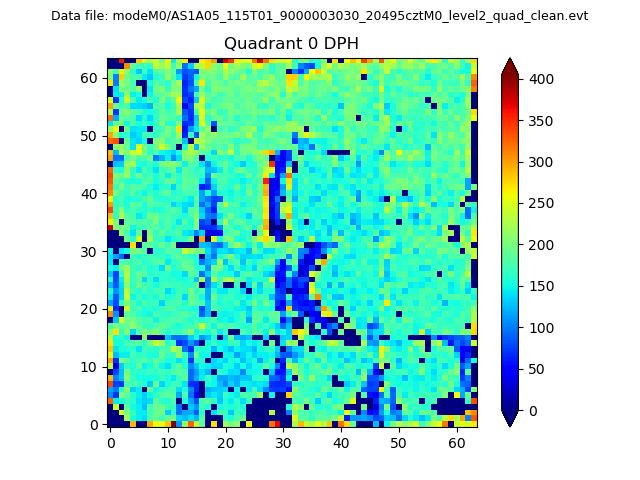 |
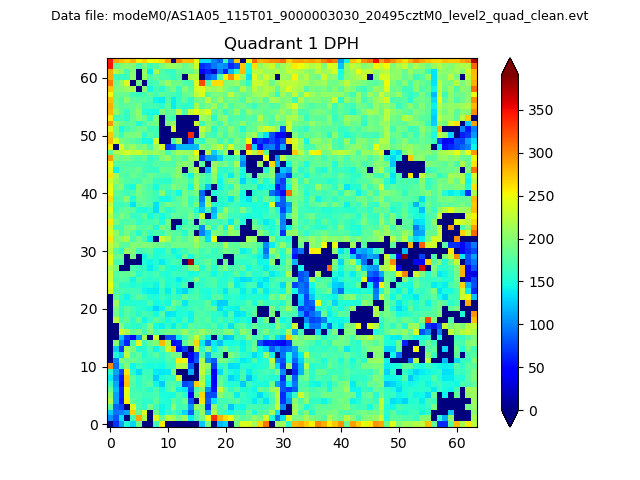 |
Quadrant B |
|---|---|---|---|
| Quadrant D | 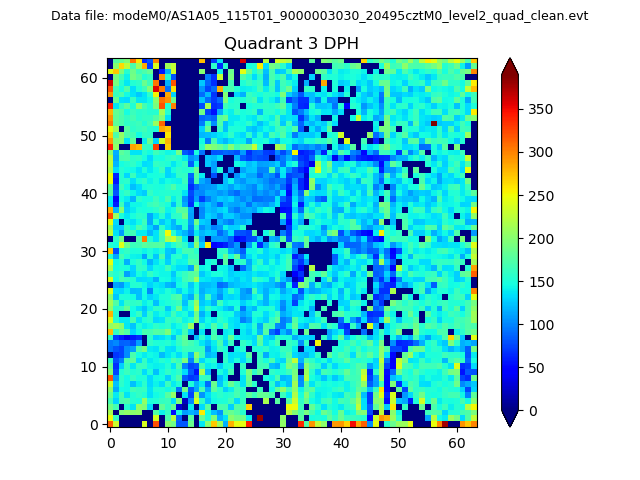 |
 |
Quadrant C |
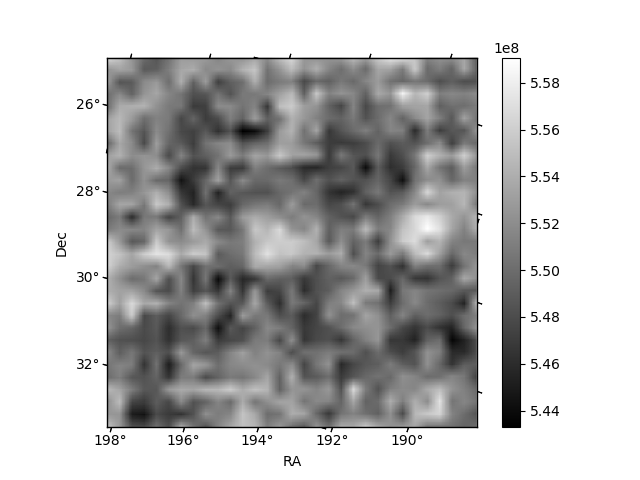
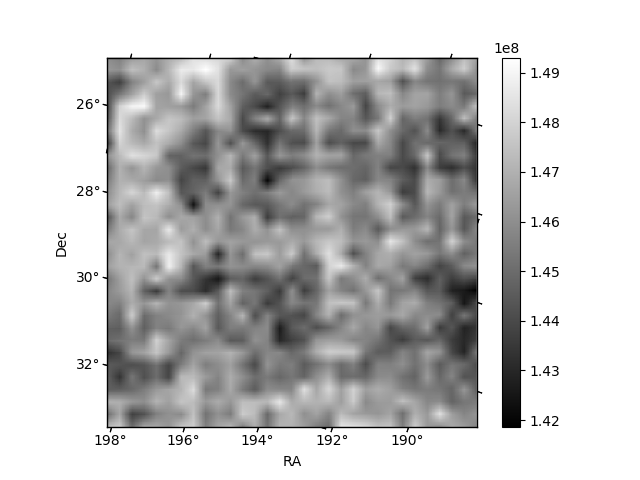
| Plot type | Count rate plots | Images |
|---|---|---|
| Comparison with Poisson distribution Blue bars denote a histogram of data divided into 1 sec bins. Red curve is a Poisson curve with rate = median count rate of data. |
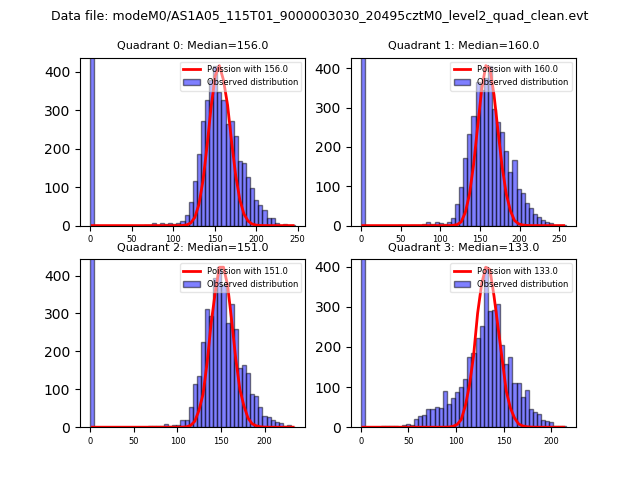 |
 |
| Quadrant-wise count rates Data is divided into 100 sec bins |
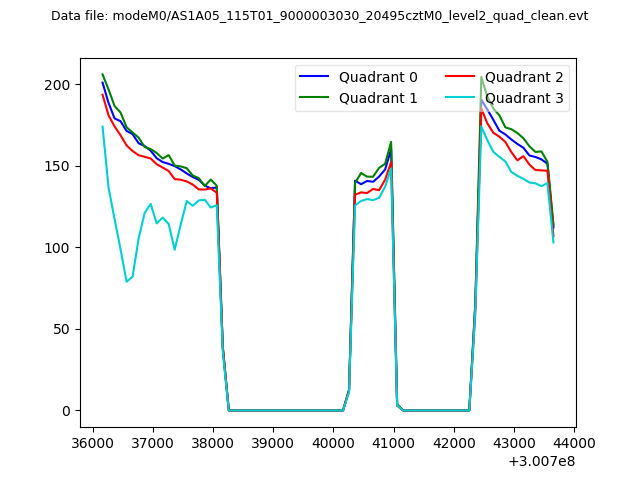 |
|
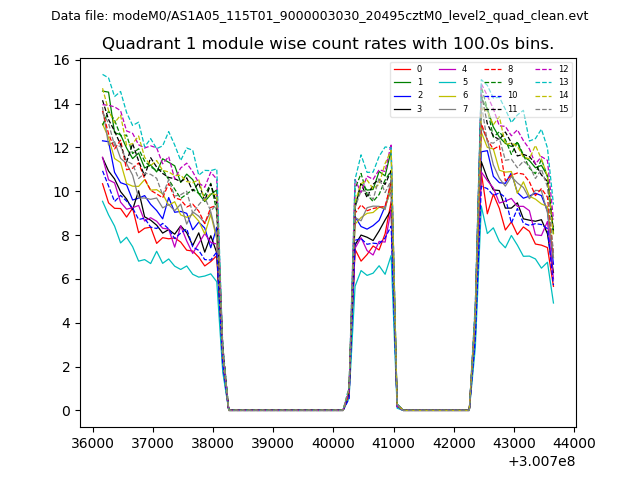
| Module-wise count rates for Quadrant A Data is divided into 100 sec bins |
 |
 |
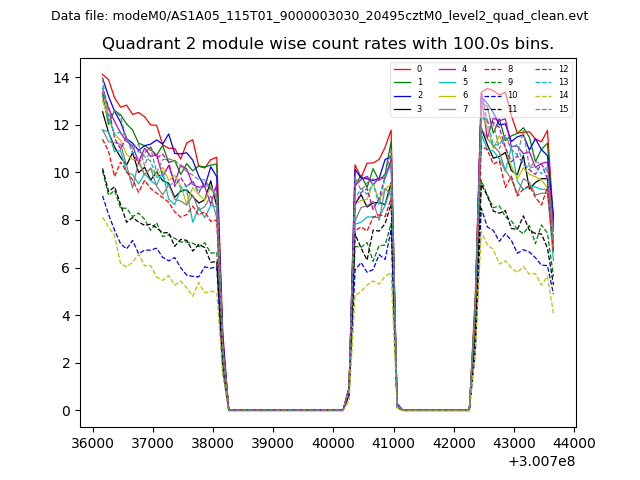
| Module-wise count rates for Quadrant B Data is divided into 100 sec bins |
 |
 |
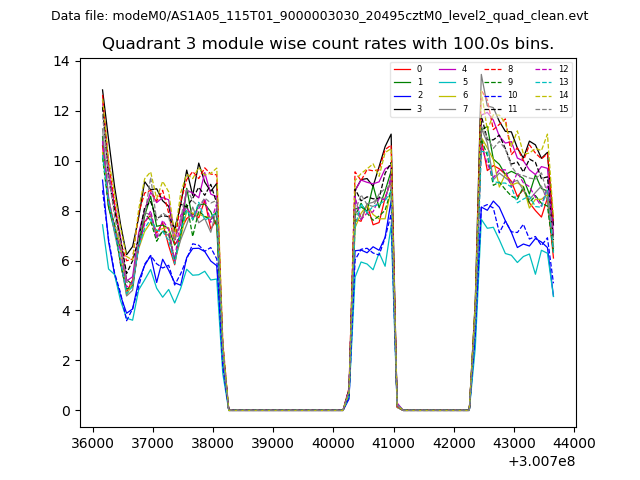
| Module-wise count rates for Quadrant C Data is divided into 100 sec bins |
 |
 |
| Module-wise count rates for Quadrant D Data is divided into 100 sec bins |
 |
 |
| Parameter | Plot |
|---|---|
| CZT HV Monitor | 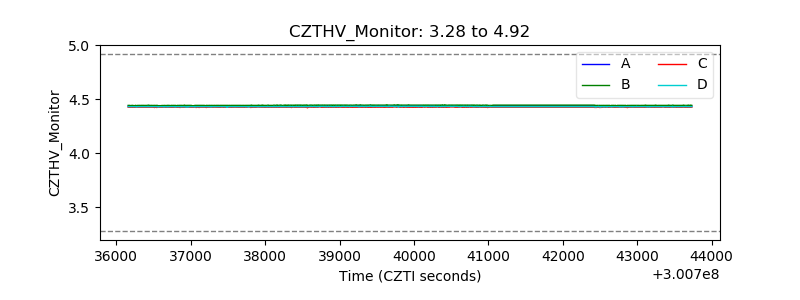 |
| D_VDD | 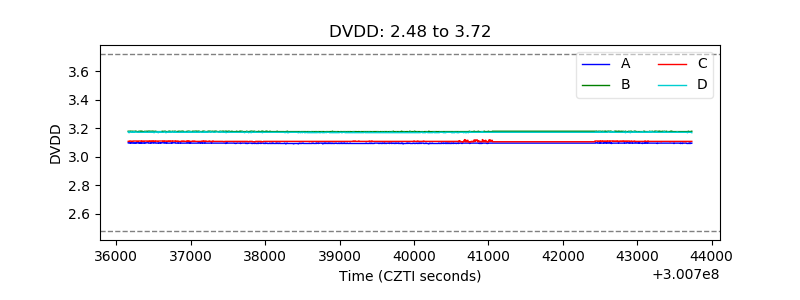 |
| Temperature 1 | 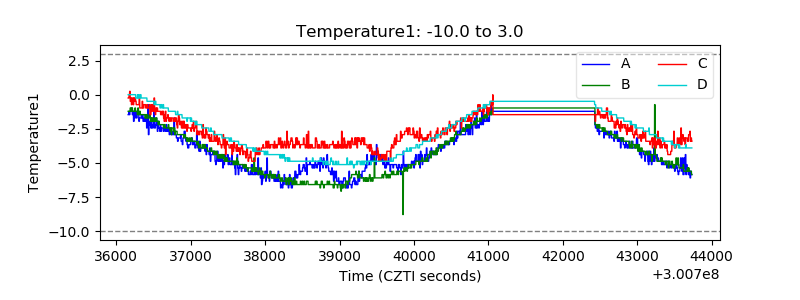 |
| Veto HV Monitor | 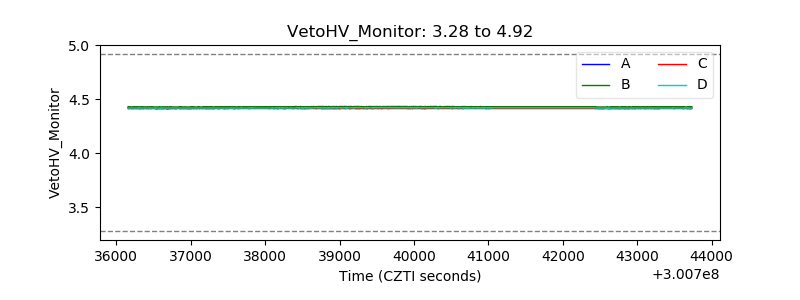 |
| Veto LLD | 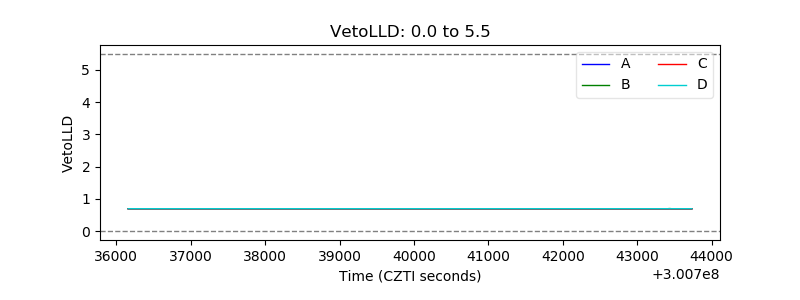 |
| Alpha Counter | 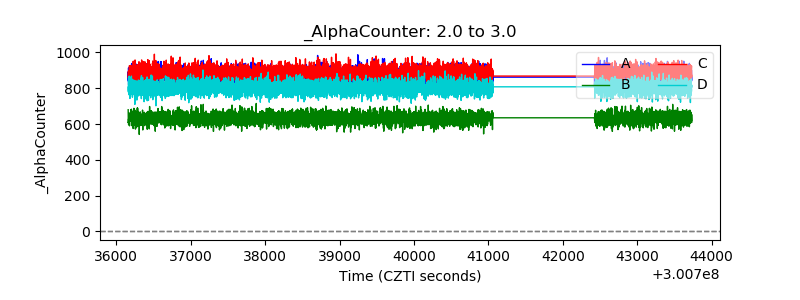 |
| _CPM_Rate | 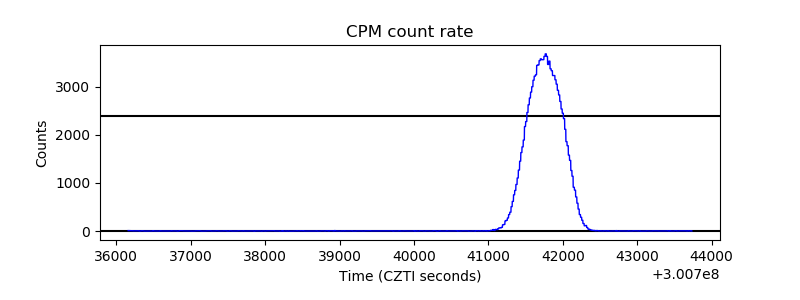 |
| CZT Counter | 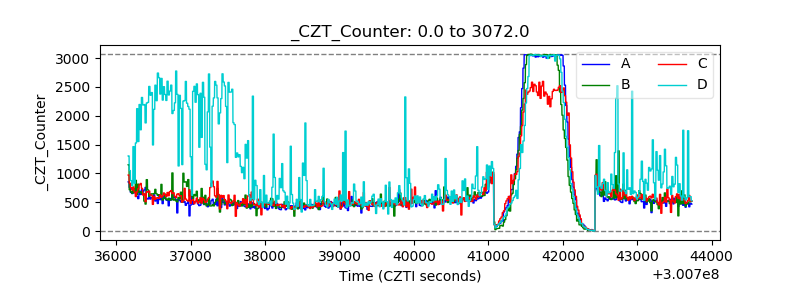 |
| +2.5 Volts monitor |  |
| +5 Volts monitor |  |
| _ROLL_ROT | 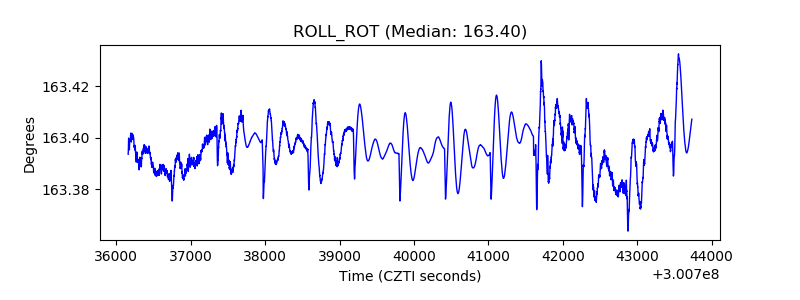 |
| _Roll_DEC | 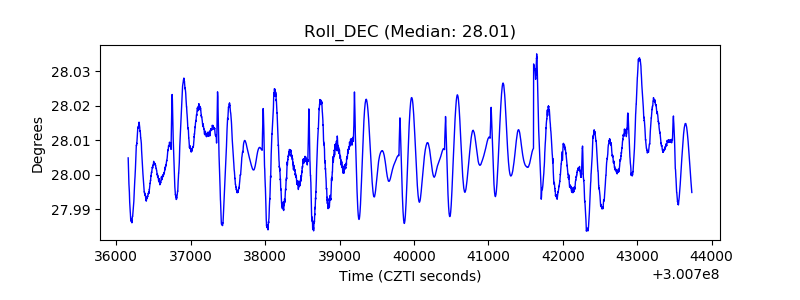 |
| _Roll_RA | 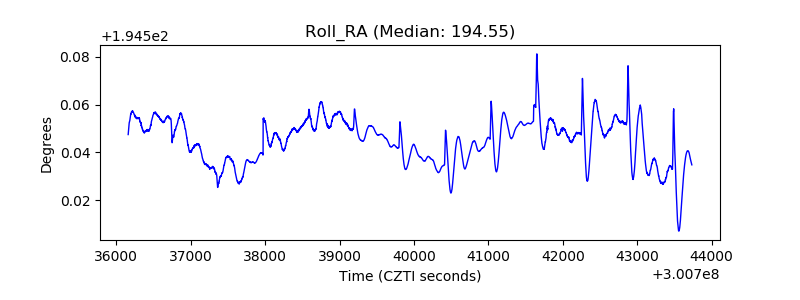 |
| Veto Counter | 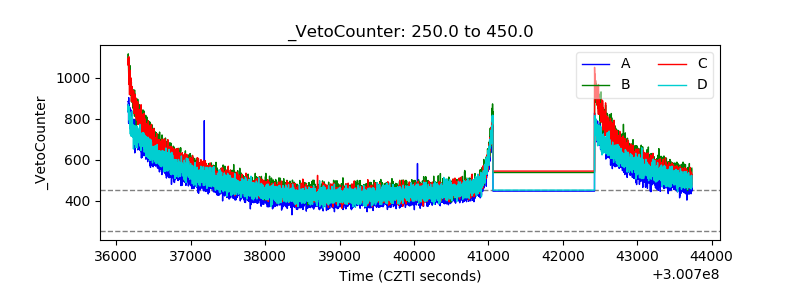 |