| Param | Original file | Final file |
|---|---|---|
| Filename | modeM0/AS1A05_115T01_9000003030_20496cztM0_level2.evt | modeM0/AS1A05_115T01_9000003030_20496cztM0_level2_quad_clean.evt |
| Size (bytes) | 566,674,560 | 91,874,880 |
| Size | 540.4 MB | 87.6 MB |
| Events in quadrant A | 3,080,594 | 609,381 |
| Events in quadrant B | 3,456,586 | 627,257 |
| Events in quadrant C | 3,645,838 | 585,237 |
| Events in quadrant D | 6,563,040 | 531,206 |
| Mode M9 | |||
|---|---|---|---|
| Quadrant | BADHDUFLAG | Total packets | Discarded packets |
| A | 0 | 14 | 0 |
| B | 0 | 15 | 0 |
| C | 0 | 15 | 0 |
| D | 0 | 15 | 0 |
| Mode SS | |||
|---|---|---|---|
| Quadrant | BADHDUFLAG | Total packets | Discarded packets |
| A | 0 | 124 | 0 |
| B | 0 | 124 | 0 |
| C | 0 | 124 | 0 |
| D | 0 | 124 | 0 |
| Mode M0 | |||
|---|---|---|---|
| Quadrant | BADHDUFLAG | Total packets | Discarded packets |
| A | 0 | 12862 | 2 |
| B | 0 | 14000 | 2 |
| C | 0 | 14711 | 2 |
| D | 0 | 23911 | 3 |
| Quadrant | Total seconds | Saturated seconds | Saturation percentage |
|---|---|---|---|
| A | 6150 | 21 | 0.341463% |
| B | 6150 | 86 | 1.398374% |
| C | 6150 | 62 | 1.008130% |
| D | 6149 | 468 | 7.610994% |
Noise dominated data is calculated using 1-second bins in cleaned event files. If a bin has >2000 counts, and if more than 50% of those come from <1% of pixels, then it is considered to be noise-dominated and hence unusable.
| Quadrant | # 1 sec bins | Bins with >0 counts | Bins with >2000 counts | High rate bins dominated by noise | Noise dominated (total time) | Noise dominated (detector-on time) | Marked lightcurve |
|---|---|---|---|---|---|---|---|
| A | 7560 | 6150 | 0 | 0 | 0.00% | 0.00% | 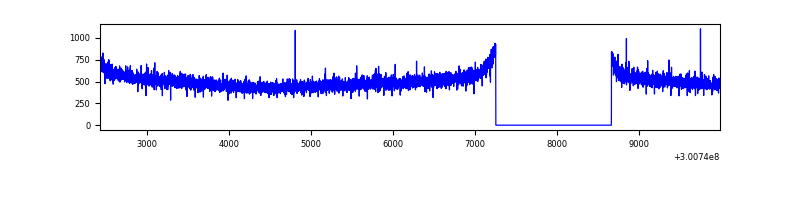 |
| B | 7560 | 6150 | 12 | 12 | 0.16% | 0.20% | 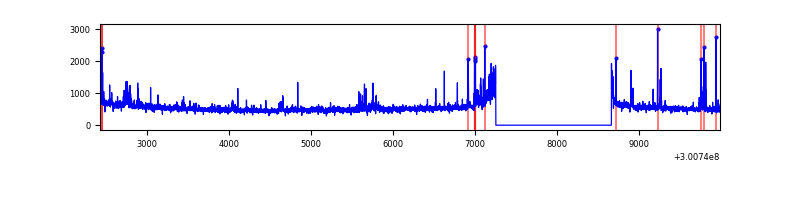 |
| C | 7560 | 6150 | 0 | 0 | 0.00% | 0.00% | 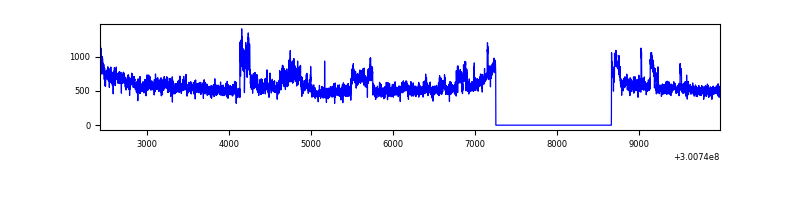 |
| D | 7559 | 6150 | 496 | 496 | 6.56% | 8.07% | 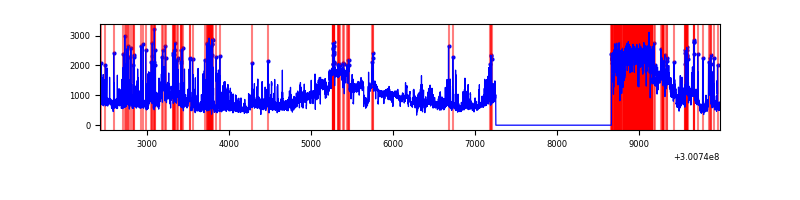 |
Top three noisy pixels from each quadrant. If the there are fewer than three noisy pixels in the level2.evt file, extra rows are filled as -1
| Pixel properties | Quadrant properties | ||||||
|---|---|---|---|---|---|---|---|
| Quadrant | DetID | PixID | Counts | Sigma | Mean | Median | Sigma |
| A | 0 | 226 | 7130 | 39.67 | 797 | 783 | 160.0 |
| A | 13 | 254 | 6639 | 36.6 | 797 | 783 | 160.0 |
| A | 11 | 29 | 6605 | 36.39 | 797 | 783 | 160.0 |
| B | 0 | 197 | 70165 | 461.91 | 805 | 788 | 150.2 |
| B | 7 | 220 | 70015 | 460.92 | 805 | 788 | 150.2 |
| B | 0 | 189 | 47998 | 314.33 | 805 | 788 | 150.2 |
| C | 3 | 233 | 521742 | 2916.77 | 768 | 774 | 178.6 |
| C | 14 | 238 | 123105 | 684.9 | 768 | 774 | 178.6 |
| C | 0 | 2 | 9720 | 50.09 | 768 | 774 | 178.6 |
| D | 7 | 238 | 1260895 | 6895.12 | 750 | 729 | 182.8 |
| D | 7 | 38 | 795310 | 4347.63 | 750 | 729 | 182.8 |
| D | 2 | 16 | 791040 | 4324.26 | 750 | 729 | 182.8 |
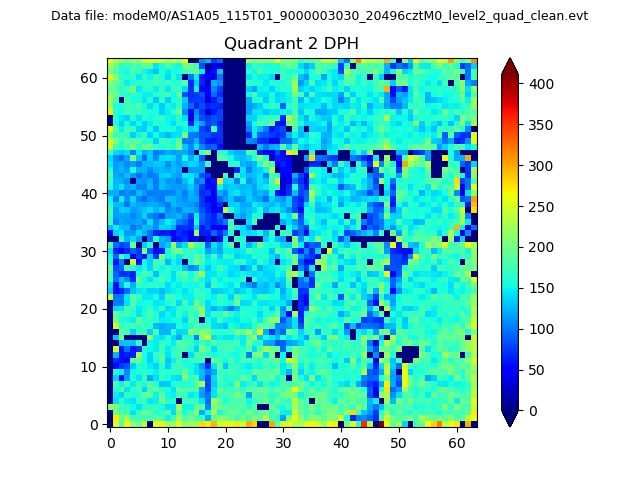
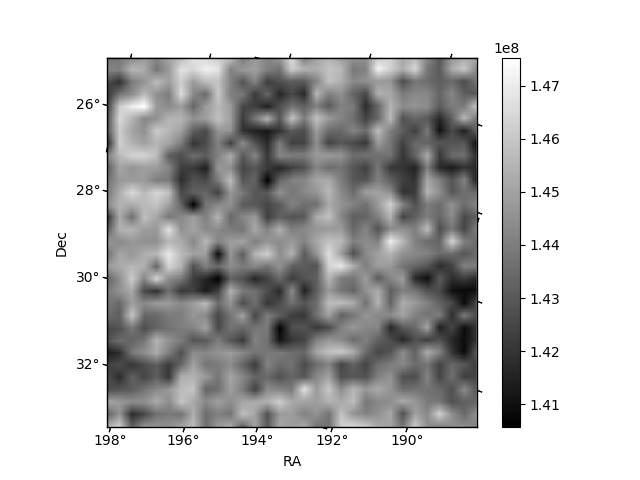
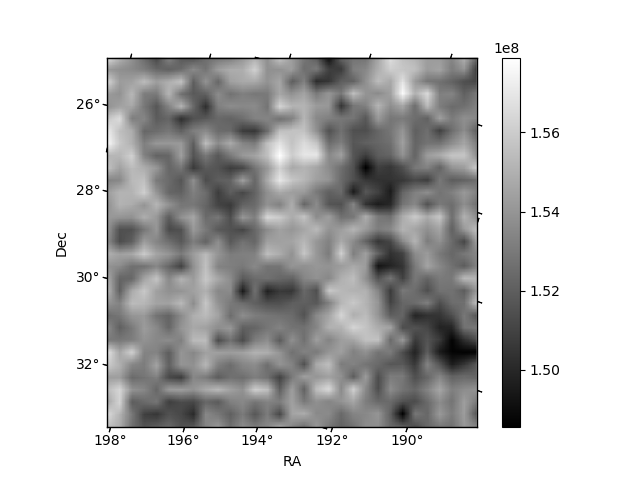
Histogram calculated using DETX and DETY for each event in the final _common_clean file
| Quadrant A | 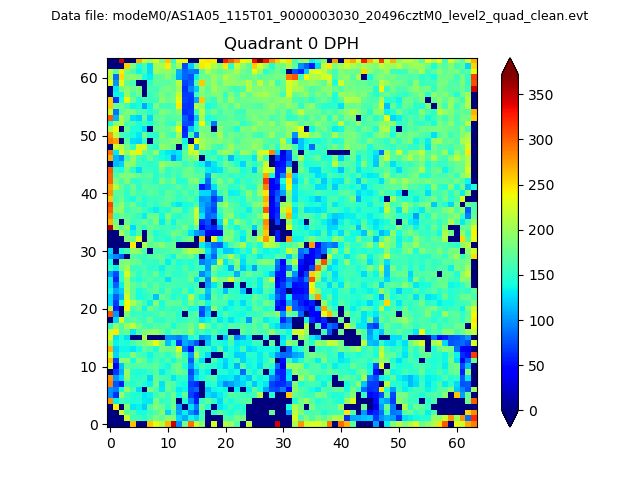 |
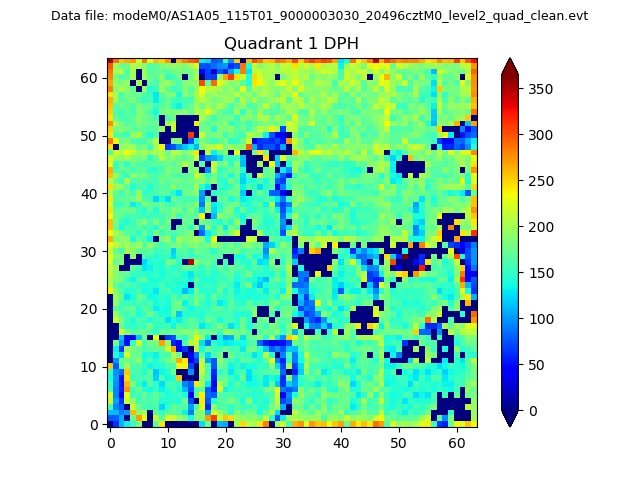 |
Quadrant B |
|---|---|---|---|
| Quadrant D | 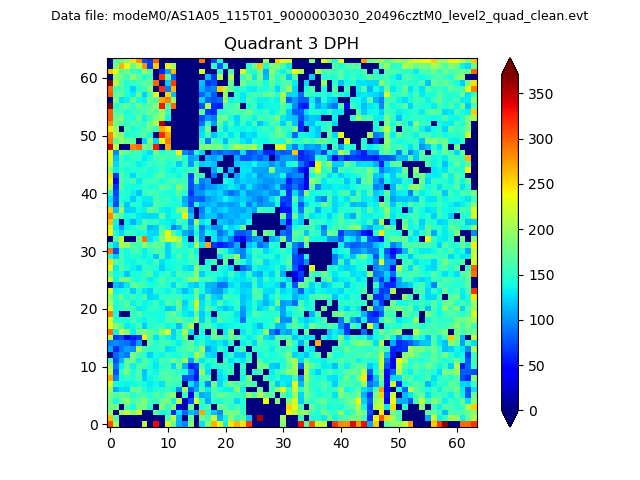 |
 |
Quadrant C |
| Plot type | Count rate plots | Images |
|---|---|---|
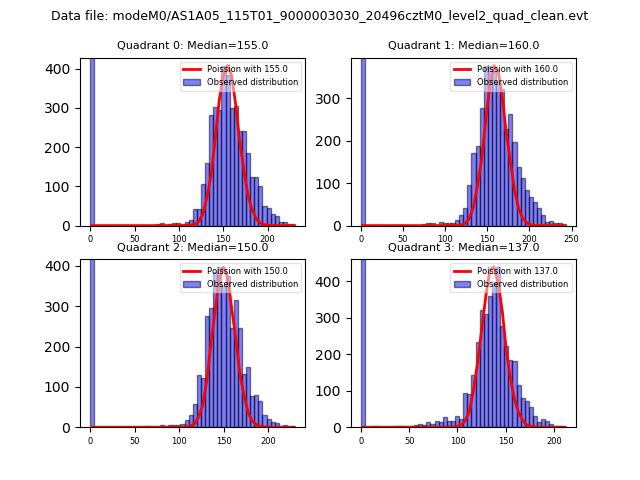
| Comparison with Poisson distribution Blue bars denote a histogram of data divided into 1 sec bins. Red curve is a Poisson curve with rate = median count rate of data. |
 |
 |
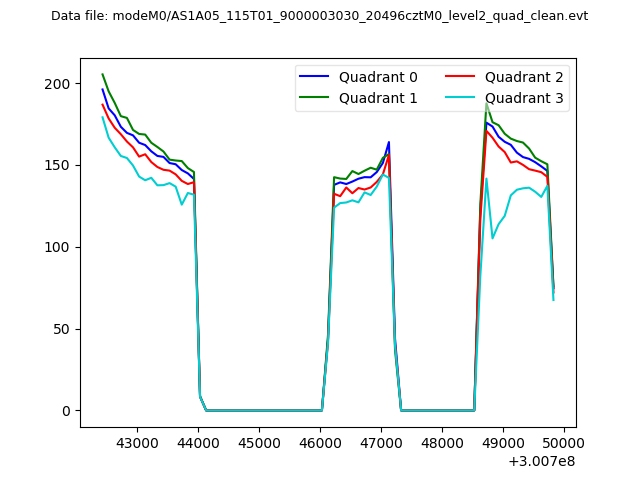
| Quadrant-wise count rates Data is divided into 100 sec bins |
 |
|
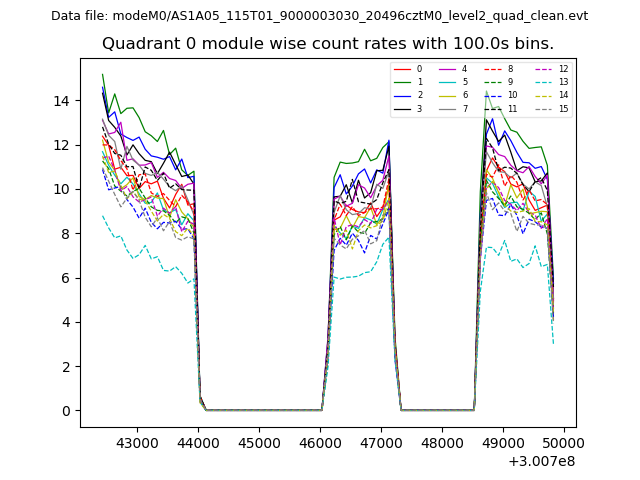
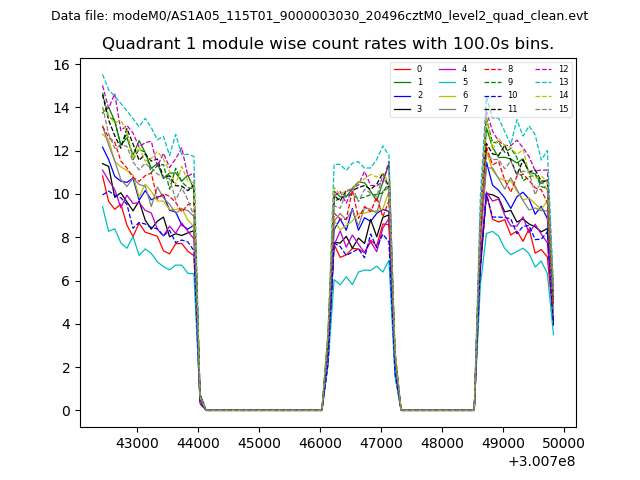
| Module-wise count rates for Quadrant A Data is divided into 100 sec bins |
 |
 |
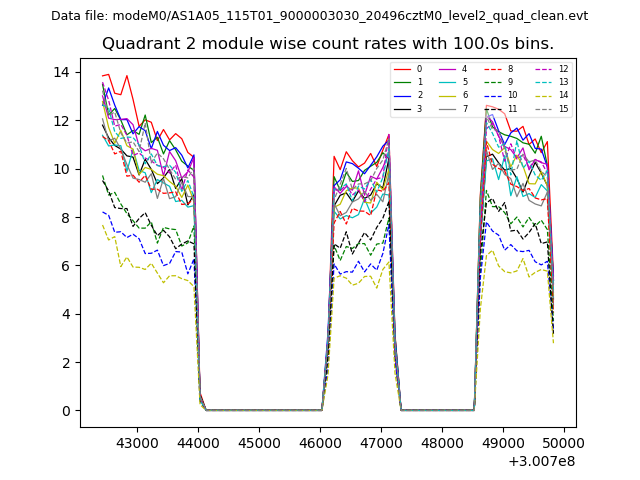
| Module-wise count rates for Quadrant B Data is divided into 100 sec bins |
 |
 |
| Module-wise count rates for Quadrant C Data is divided into 100 sec bins |
 |
 |
| Module-wise count rates for Quadrant D Data is divided into 100 sec bins |
 |
 |
| Parameter | Plot |
|---|---|
| CZT HV Monitor | 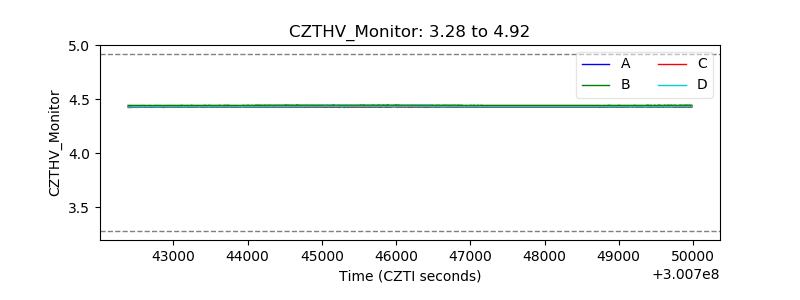 |
| D_VDD | 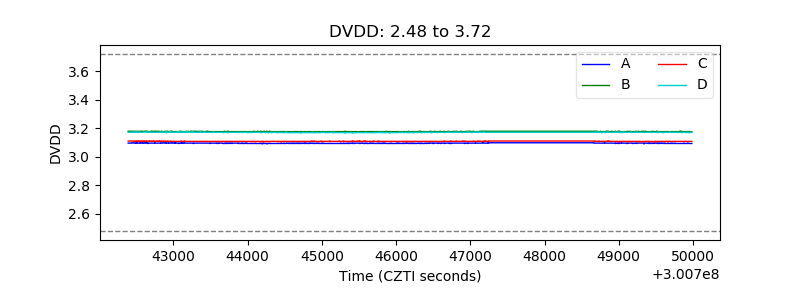 |
| Temperature 1 | 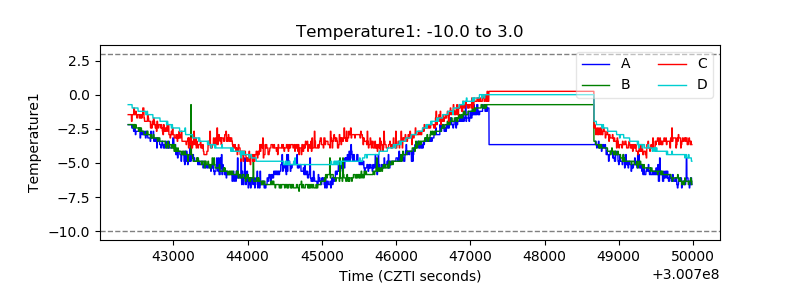 |
| Veto HV Monitor | 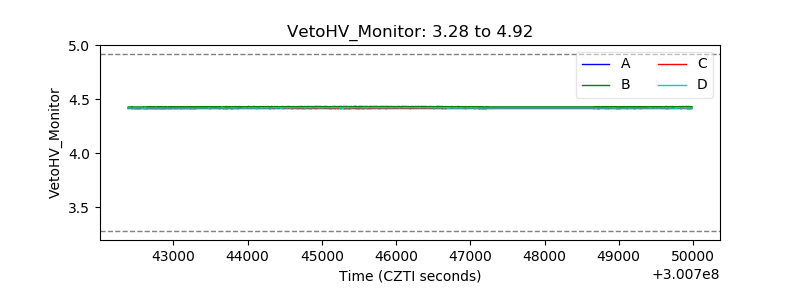 |
| Veto LLD | 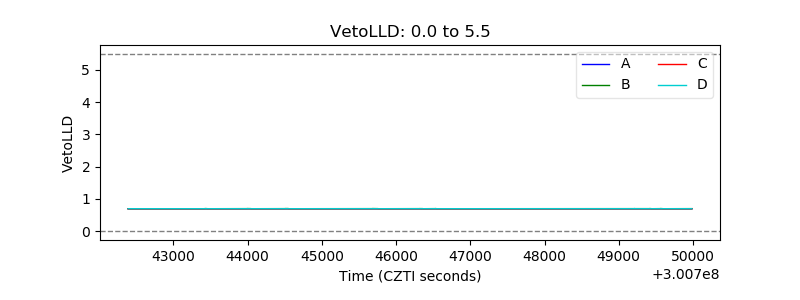 |
| Alpha Counter | 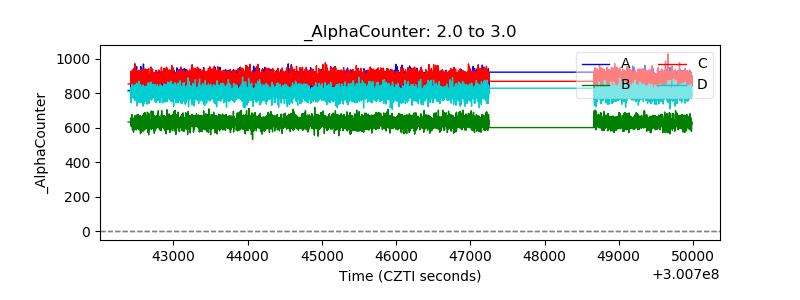 |
| _CPM_Rate | 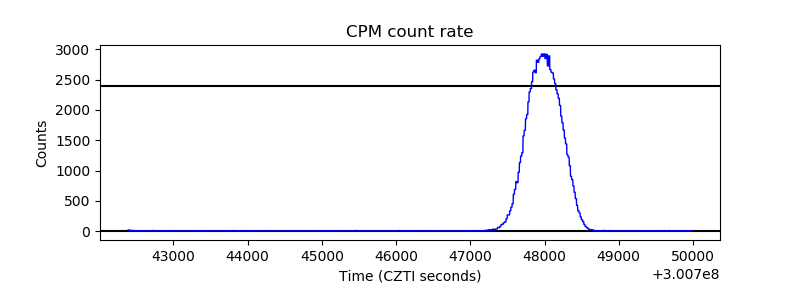 |
| CZT Counter | 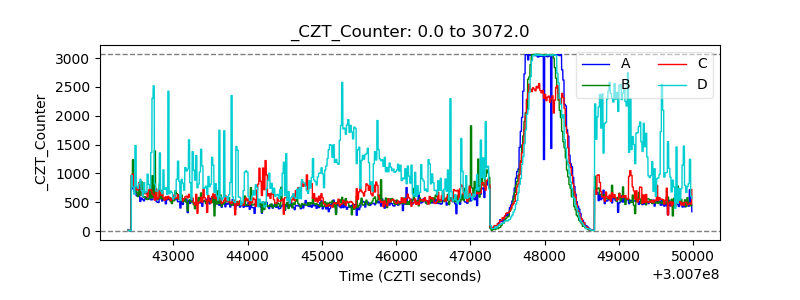 |
| +2.5 Volts monitor |  |
| +5 Volts monitor |  |
| _ROLL_ROT | 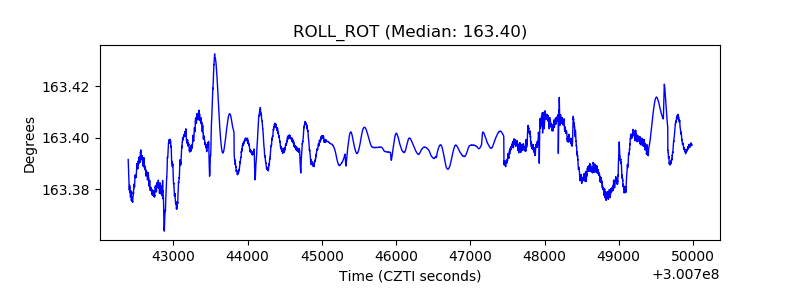 |
| _Roll_DEC | 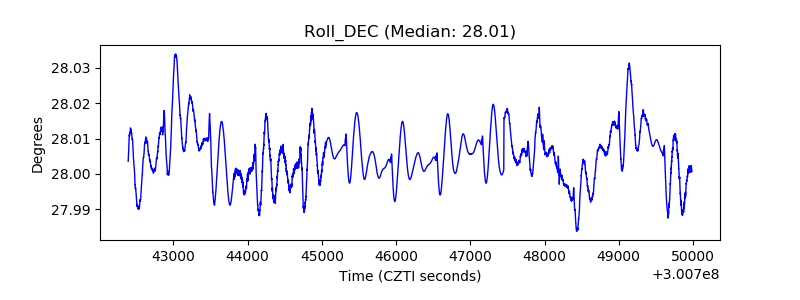 |
| _Roll_RA | 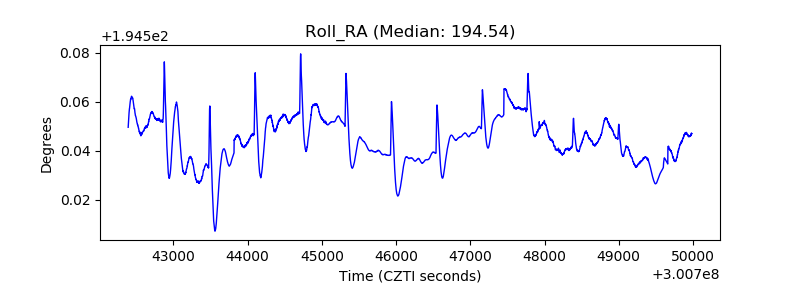 |
| Veto Counter |  |