| Param | Original file | Final file |
|---|---|---|
| Filename | modeM0/AS1A05_115T01_9000003030_20498cztM0_level2.evt | modeM0/AS1A05_115T01_9000003030_20498cztM0_level2_quad_clean.evt |
| Size (bytes) | 928,537,920 | 136,615,680 |
| Size | 885.5 MB | 130.3 MB |
| Events in quadrant A | 5,577,357 | 875,816 |
| Events in quadrant B | 6,279,623 | 884,957 |
| Events in quadrant C | 5,736,485 | 839,195 |
| Events in quadrant D | 9,763,988 | 755,273 |
| Mode M9 | |||
|---|---|---|---|
| Quadrant | BADHDUFLAG | Total packets | Discarded packets |
| A | 0 | 25 | 0 |
| B | 0 | 25 | 0 |
| C | 0 | 25 | 0 |
| D | 0 | 25 | 0 |
| Mode SS | |||
|---|---|---|---|
| Quadrant | BADHDUFLAG | Total packets | Discarded packets |
| A | 0 | 228 | 0 |
| B | 0 | 228 | 0 |
| C | 0 | 228 | 0 |
| D | 0 | 228 | 0 |
| Mode M0 | |||
|---|---|---|---|
| Quadrant | BADHDUFLAG | Total packets | Discarded packets |
| A | 0 | 23578 | 2 |
| B | 0 | 25605 | 2 |
| C | 0 | 23899 | 2 |
| D | 0 | 36487 | 2 |
| Quadrant | Total seconds | Saturated seconds | Saturation percentage |
|---|---|---|---|
| A | 11303 | 66 | 0.583916% |
| B | 11302 | 217 | 1.920014% |
| C | 11302 | 116 | 1.026367% |
| D | 11302 | 1047 | 9.263847% |
Noise dominated data is calculated using 1-second bins in cleaned event files. If a bin has >2000 counts, and if more than 50% of those come from <1% of pixels, then it is considered to be noise-dominated and hence unusable.
| Quadrant | # 1 sec bins | Bins with >0 counts | Bins with >2000 counts | High rate bins dominated by noise | Noise dominated (total time) | Noise dominated (detector-on time) | Marked lightcurve |
|---|---|---|---|---|---|---|---|
| A | 13723 | 11304 | 2 | 2 | 0.01% | 0.02% | 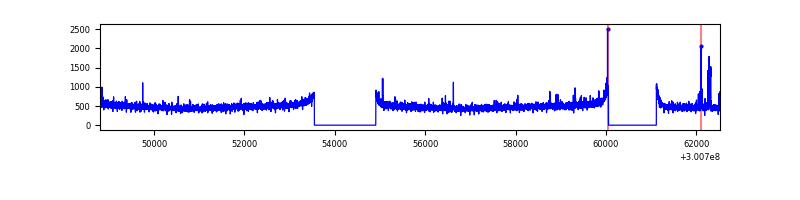 |
| B | 13722 | 11303 | 38 | 38 | 0.28% | 0.34% | 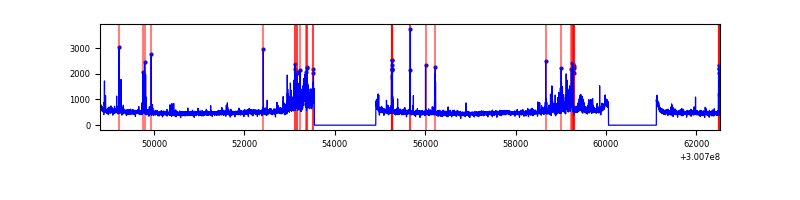 |
| C | 13722 | 11304 | 0 | 0 | 0.00% | 0.00% | 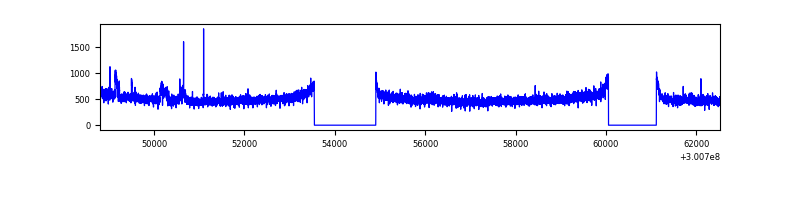 |
| D | 13722 | 11303 | 920 | 920 | 6.70% | 8.14% | 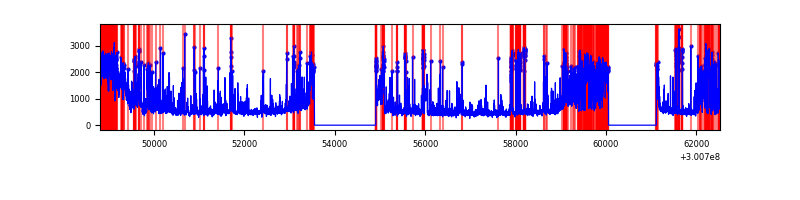 |
Top three noisy pixels from each quadrant. If the there are fewer than three noisy pixels in the level2.evt file, extra rows are filled as -1
| Pixel properties | Quadrant properties | ||||||
|---|---|---|---|---|---|---|---|
| Quadrant | DetID | PixID | Counts | Sigma | Mean | Median | Sigma |
| A | 5 | 16 | 57702 | 198.17 | 1423 | 1397 | 284.1 |
| A | 12 | 96 | 33812 | 114.09 | 1423 | 1397 | 284.1 |
| A | 0 | 226 | 12326 | 38.47 | 1423 | 1397 | 284.1 |
| B | 7 | 220 | 194935 | 713.69 | 1429 | 1395 | 271.2 |
| B | 0 | 197 | 176740 | 646.59 | 1429 | 1395 | 271.2 |
| B | 0 | 189 | 153649 | 561.44 | 1429 | 1395 | 271.2 |
| C | 14 | 238 | 216579 | 683.74 | 1359 | 1368 | 314.8 |
| C | 3 | 233 | 168513 | 531.03 | 1359 | 1368 | 314.8 |
| C | 9 | 221 | 21850 | 65.07 | 1359 | 1368 | 314.8 |
| D | 2 | 16 | 1420764 | 4451.47 | 1318 | 1280 | 318.9 |
| D | 7 | 38 | 1069735 | 3350.65 | 1318 | 1280 | 318.9 |
| D | 1 | 52 | 880409 | 2756.93 | 1318 | 1280 | 318.9 |
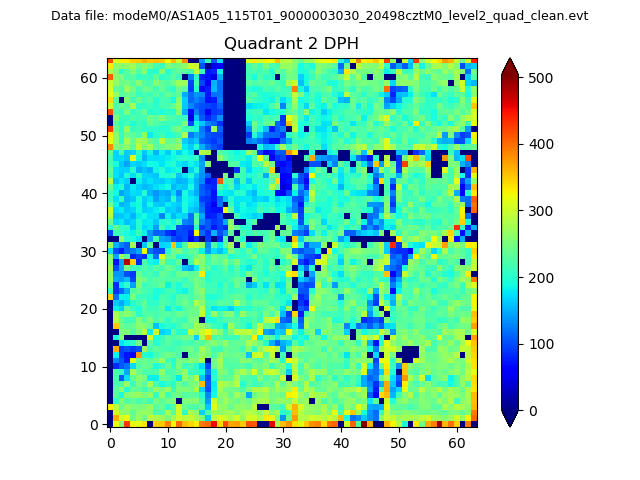
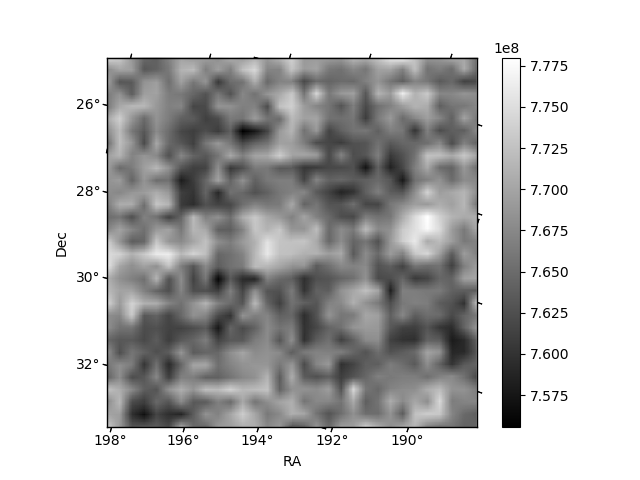
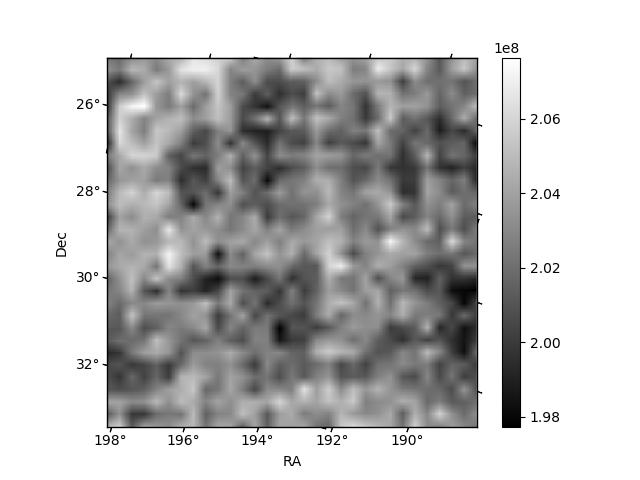
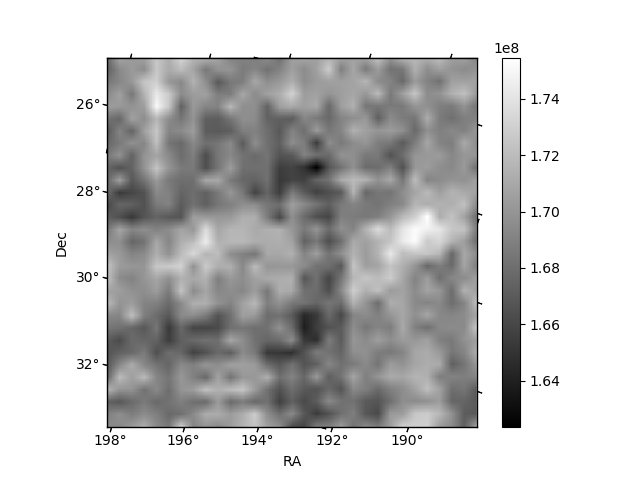
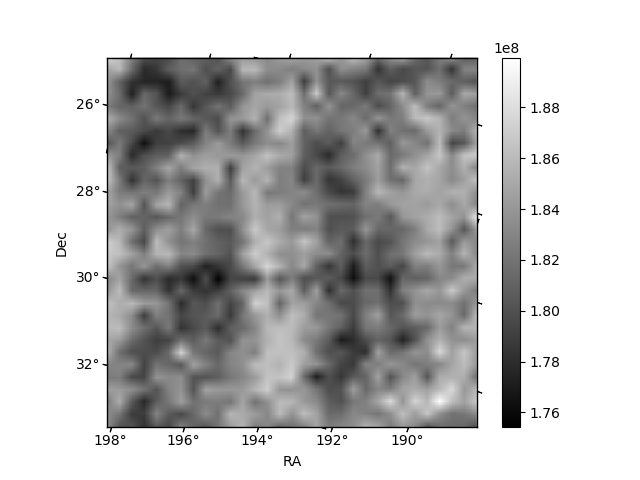
Histogram calculated using DETX and DETY for each event in the final _common_clean file
| Quadrant A | 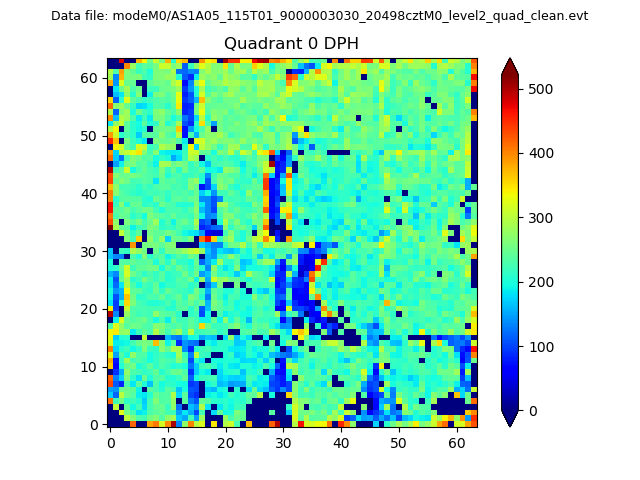 |
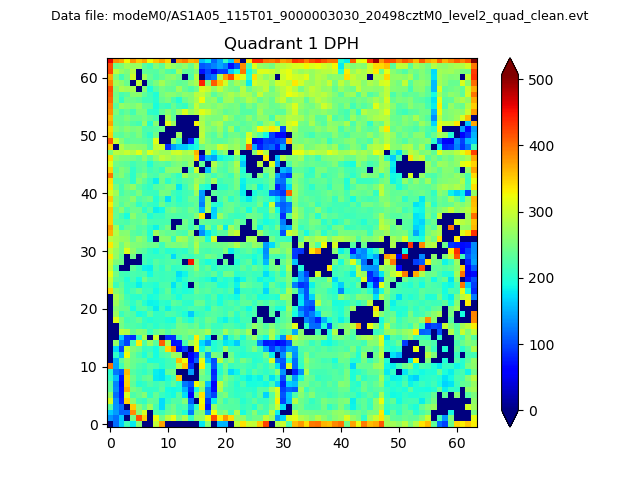 |
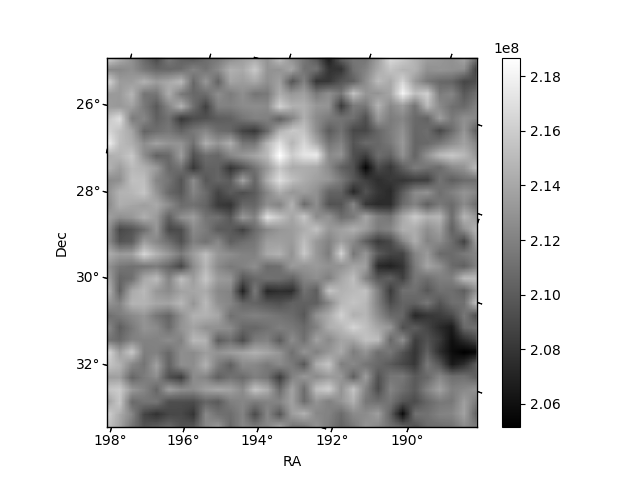
Quadrant B |
|---|---|---|---|
| Quadrant D | 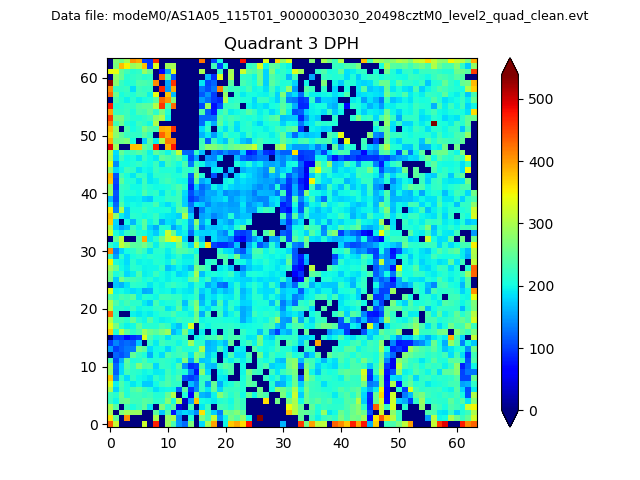 |
 |
Quadrant C |
| Plot type | Count rate plots | Images |
|---|---|---|
| Comparison with Poisson distribution Blue bars denote a histogram of data divided into 1 sec bins. Red curve is a Poisson curve with rate = median count rate of data. |
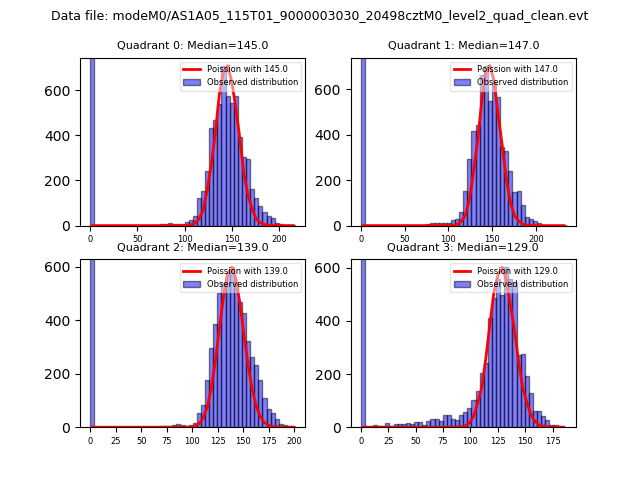 |
 |
| Quadrant-wise count rates Data is divided into 100 sec bins |
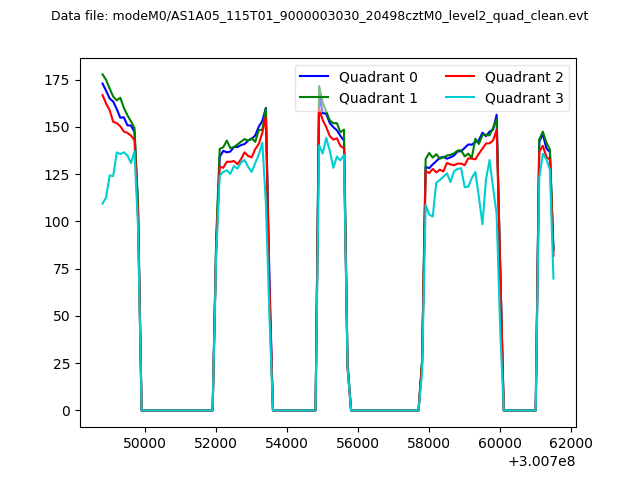 |
|
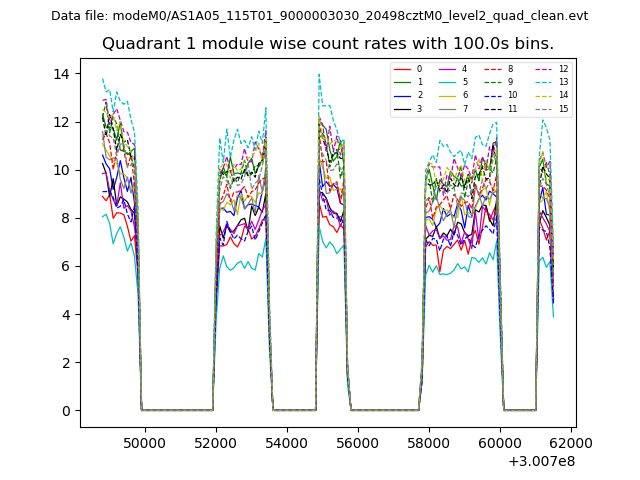
| Module-wise count rates for Quadrant A Data is divided into 100 sec bins |
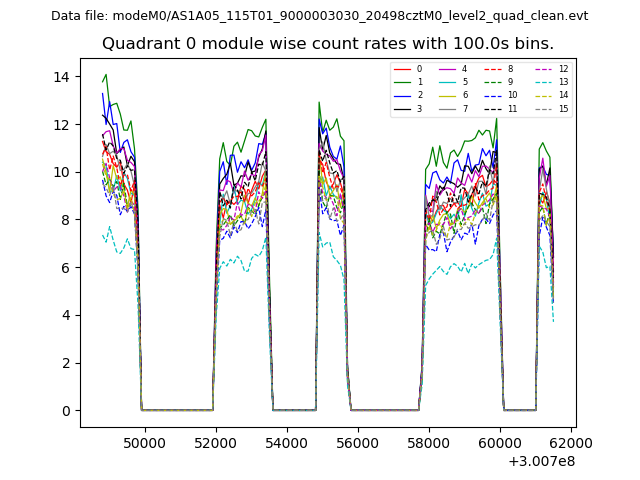 |
 |
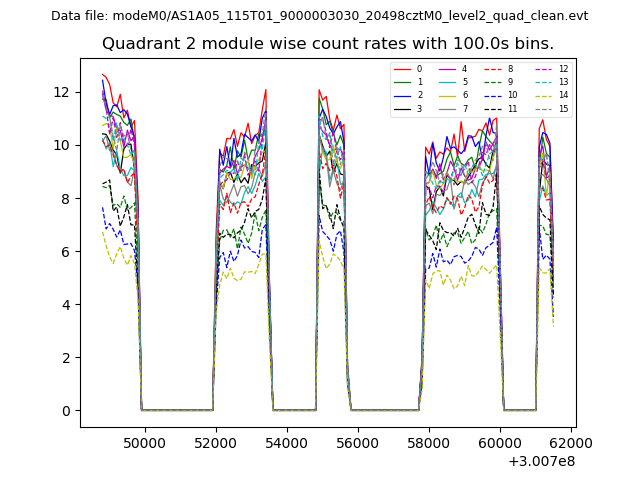
| Module-wise count rates for Quadrant B Data is divided into 100 sec bins |
 |
 |
| Module-wise count rates for Quadrant C Data is divided into 100 sec bins |
 |
 |
| Module-wise count rates for Quadrant D Data is divided into 100 sec bins |
 |
 |
| Parameter | Plot |
|---|---|
| CZT HV Monitor | 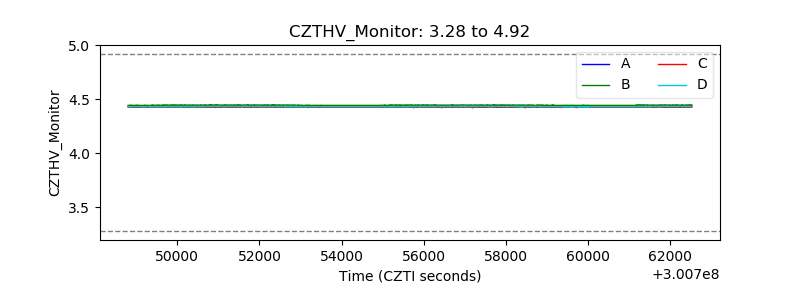 |
| D_VDD | 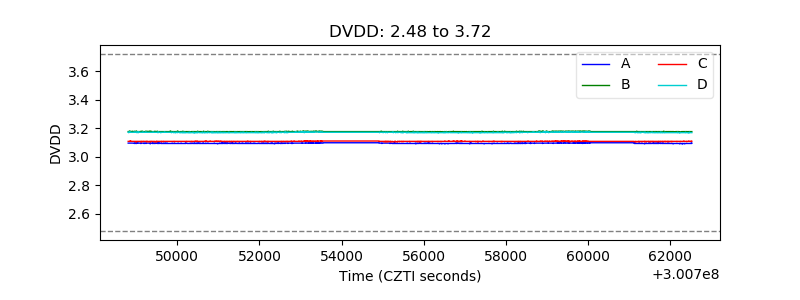 |
| Temperature 1 | 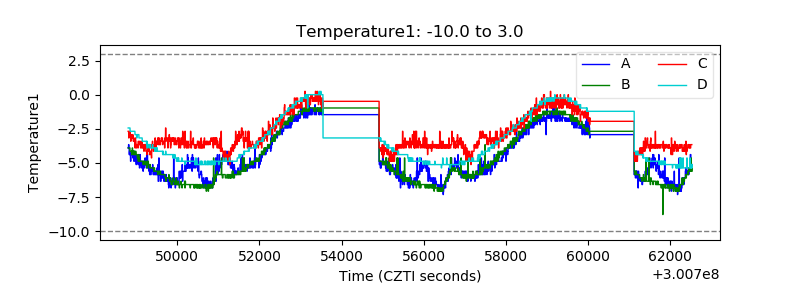 |
| Veto HV Monitor | 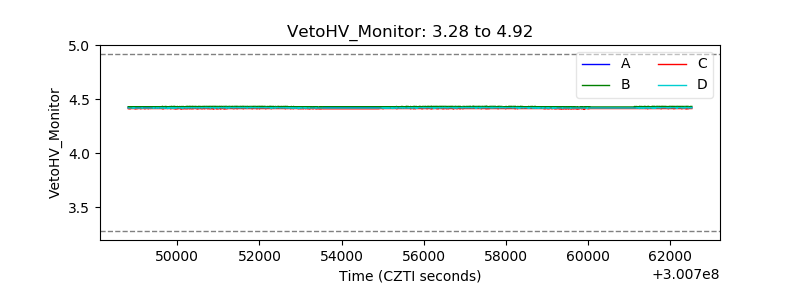 |
| Veto LLD | 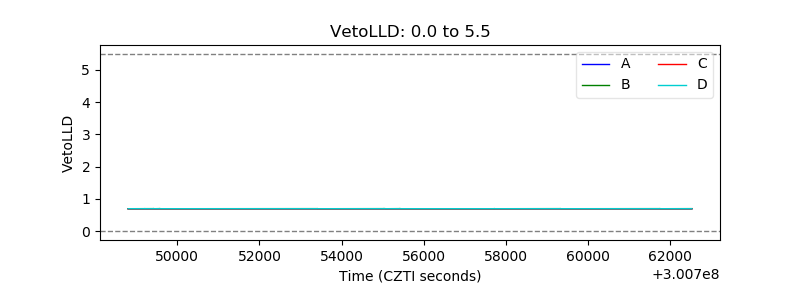 |
| Alpha Counter | 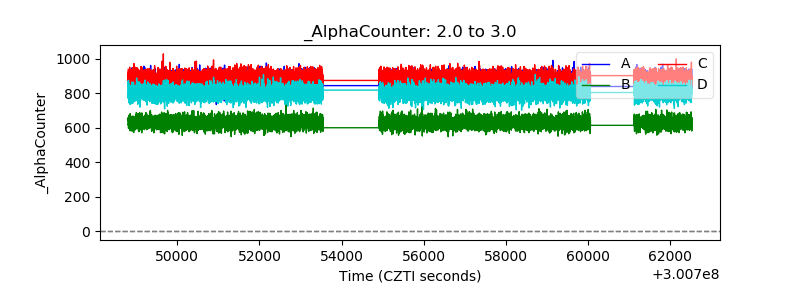 |
| _CPM_Rate | 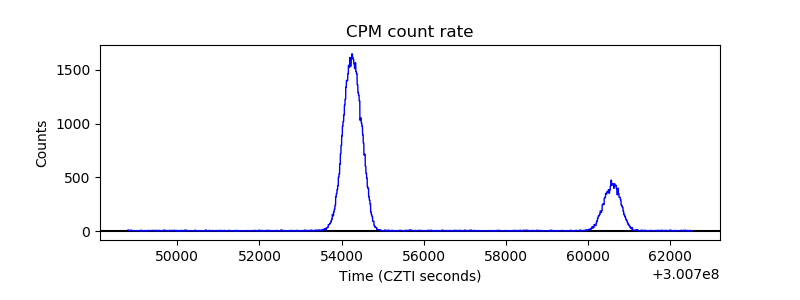 |
| CZT Counter | 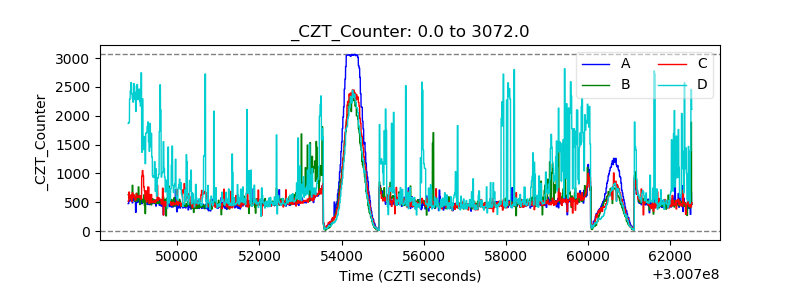 |
| +2.5 Volts monitor |  |
| +5 Volts monitor |  |
| _ROLL_ROT | 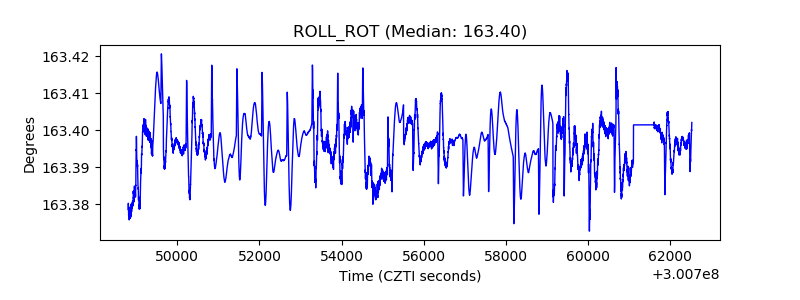 |
| _Roll_DEC | 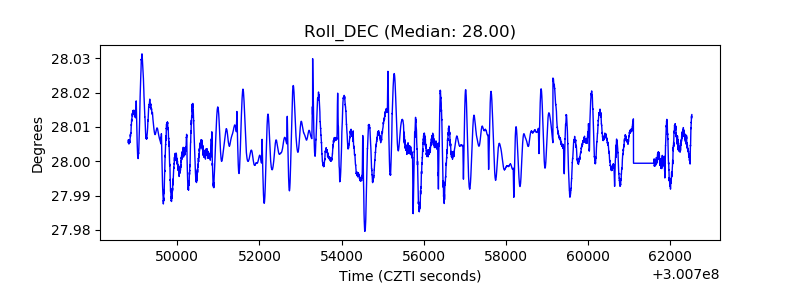 |
| _Roll_RA | 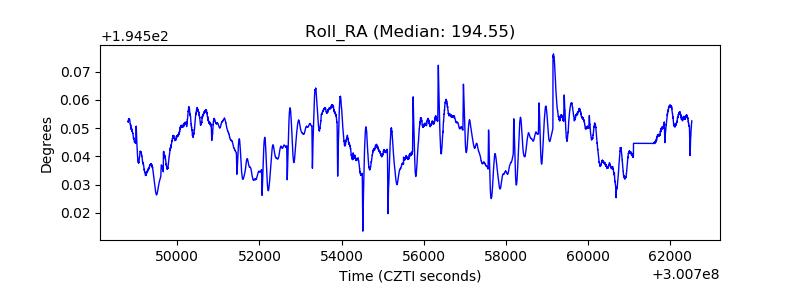 |
| Veto Counter |  |