| Param | Original file | Final file |
|---|---|---|
| Filename | modeM0/AS1A05_115T01_9000003030_20500cztM0_level2.evt | modeM0/AS1A05_115T01_9000003030_20500cztM0_level2_quad_clean.evt |
| Size (bytes) | 634,835,520 | 79,001,280 |
| Size | 605.4 MB | 75.3 MB |
| Events in quadrant A | 3,879,498 | 483,264 |
| Events in quadrant B | 4,026,196 | 486,542 |
| Events in quadrant C | 3,730,255 | 466,187 |
| Events in quadrant D | 7,067,405 | 419,642 |
| Mode M9 | |||
|---|---|---|---|
| Quadrant | BADHDUFLAG | Total packets | Discarded packets |
| A | 0 | 4 | 0 |
| B | 0 | 5 | 0 |
| C | 0 | 5 | 0 |
| D | 0 | 5 | 0 |
| Mode SS | |||
|---|---|---|---|
| Quadrant | BADHDUFLAG | Total packets | Discarded packets |
| A | 0 | 156 | 0 |
| B | 0 | 156 | 0 |
| C | 0 | 156 | 0 |
| D | 0 | 156 | 0 |
| Mode M0 | |||
|---|---|---|---|
| Quadrant | BADHDUFLAG | Total packets | Discarded packets |
| A | 0 | 16548 | 2 |
| B | 0 | 16737 | 2 |
| C | 0 | 16035 | 3 |
| D | 0 | 26332 | 2 |
| Quadrant | Total seconds | Saturated seconds | Saturation percentage |
|---|---|---|---|
| A | 7713 | 318 | 4.122909% |
| B | 7713 | 345 | 4.472968% |
| C | 7712 | 299 | 3.877075% |
| D | 7712 | 762 | 9.880705% |
Noise dominated data is calculated using 1-second bins in cleaned event files. If a bin has >2000 counts, and if more than 50% of those come from <1% of pixels, then it is considered to be noise-dominated and hence unusable.
| Quadrant | # 1 sec bins | Bins with >0 counts | Bins with >2000 counts | High rate bins dominated by noise | Noise dominated (total time) | Noise dominated (detector-on time) | Marked lightcurve |
|---|---|---|---|---|---|---|---|
| A | 7798 | 7713 | 6 | 6 | 0.08% | 0.08% | 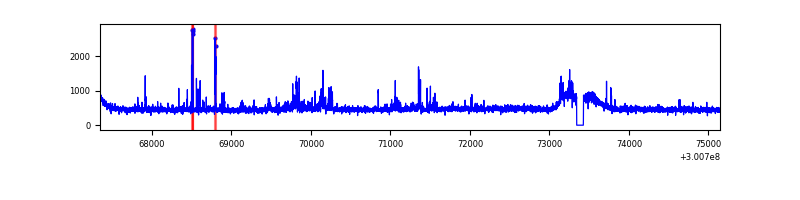 |
| B | 7798 | 7713 | 2 | 2 | 0.03% | 0.03% | 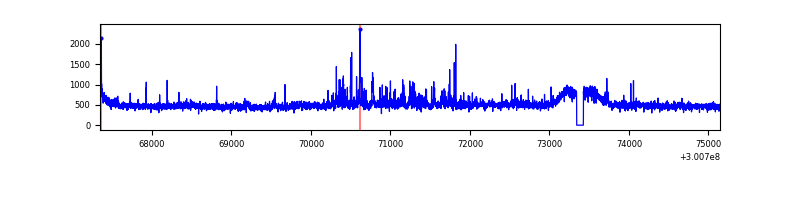 |
| C | 7797 | 7712 | 0 | 0 | 0.00% | 0.00% | 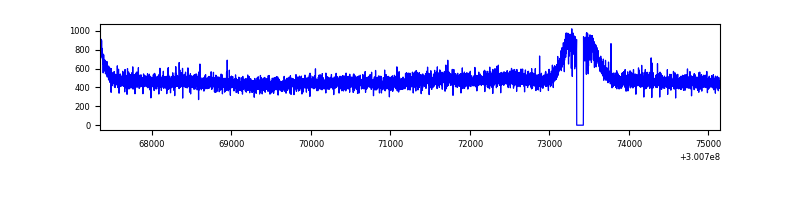 |
| D | 7797 | 7712 | 492 | 492 | 6.31% | 6.38% | 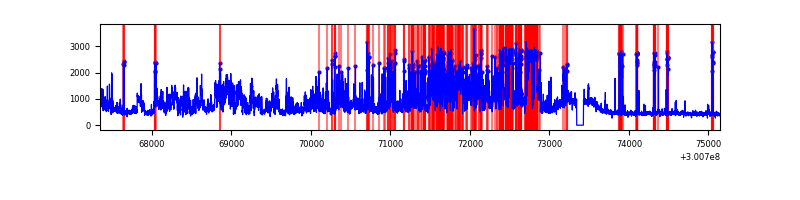 |
Top three noisy pixels from each quadrant. If the there are fewer than three noisy pixels in the level2.evt file, extra rows are filled as -1
| Pixel properties | Quadrant properties | ||||||
|---|---|---|---|---|---|---|---|
| Quadrant | DetID | PixID | Counts | Sigma | Mean | Median | Sigma |
| A | 12 | 96 | 126247 | 649.48 | 950 | 924 | 193.0 |
| A | 5 | 16 | 96219 | 493.86 | 950 | 924 | 193.0 |
| A | 0 | 226 | 8215 | 37.79 | 950 | 924 | 193.0 |
| B | 0 | 189 | 119831 | 646.87 | 953 | 925 | 183.8 |
| B | 0 | 197 | 46639 | 248.69 | 953 | 925 | 183.8 |
| B | 0 | 190 | 25812 | 135.39 | 953 | 925 | 183.8 |
| C | 14 | 238 | 138794 | 634.48 | 917 | 921 | 217.3 |
| C | 7 | 220 | 7906 | 32.14 | 917 | 921 | 217.3 |
| C | 3 | 233 | 7365 | 29.65 | 917 | 921 | 217.3 |
| D | 2 | 16 | 1901703 | 8528.92 | 901 | 873 | 222.9 |
| D | 1 | 52 | 1087192 | 4874.26 | 901 | 873 | 222.9 |
| D | 7 | 96 | 259541 | 1160.63 | 901 | 873 | 222.9 |
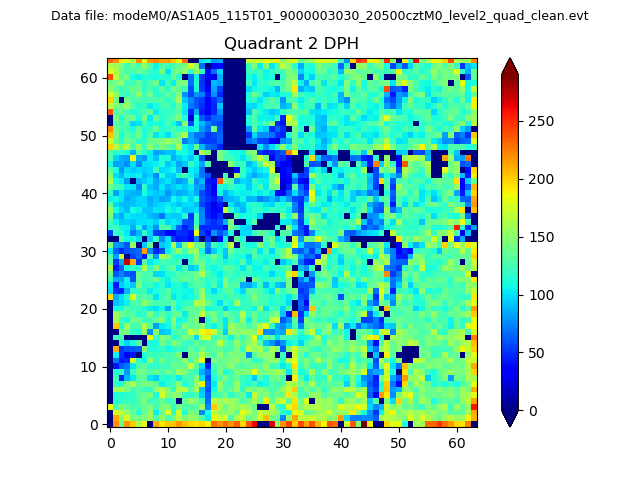
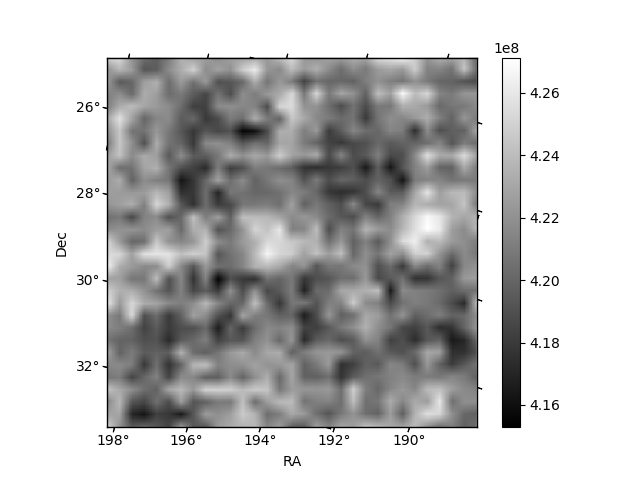
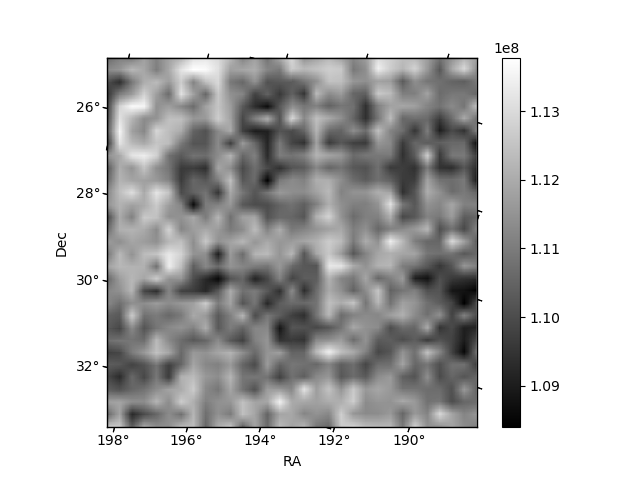
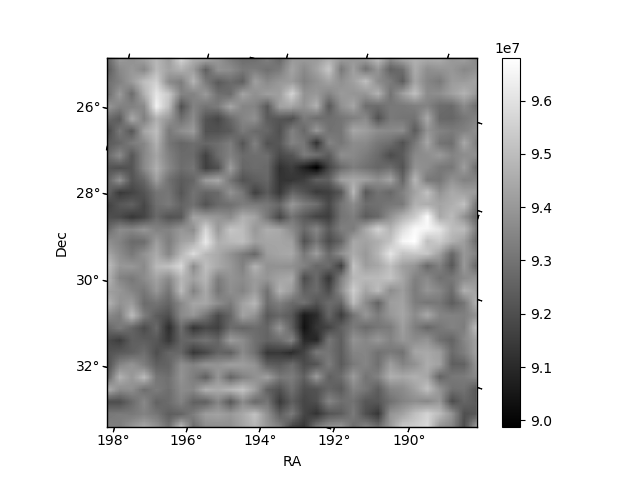
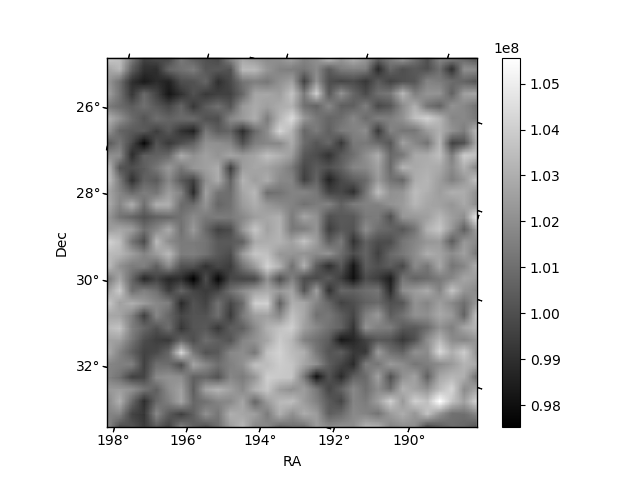
Histogram calculated using DETX and DETY for each event in the final _common_clean file
| Quadrant A | 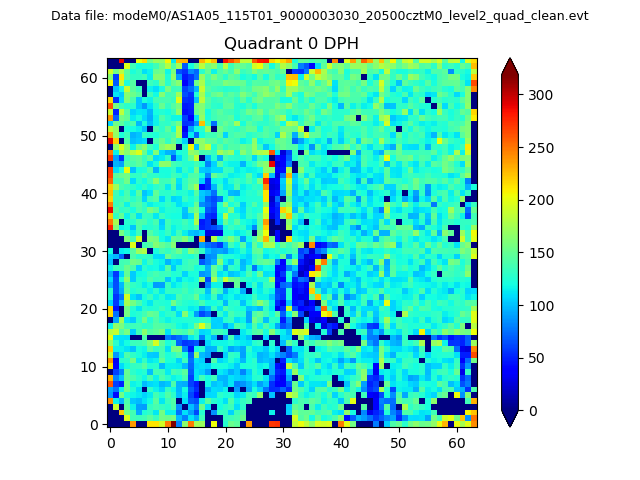 |
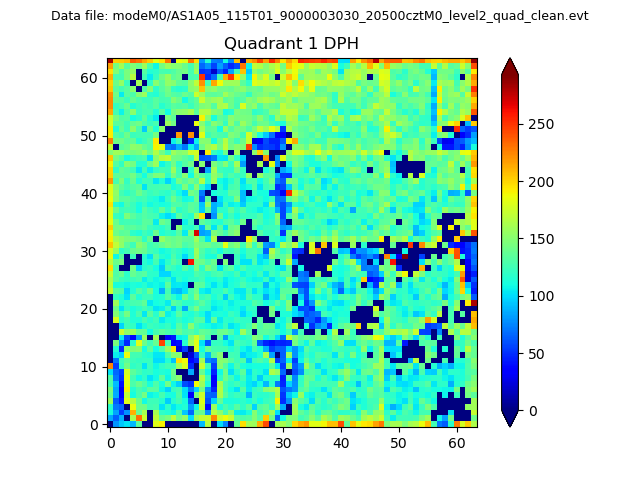 |
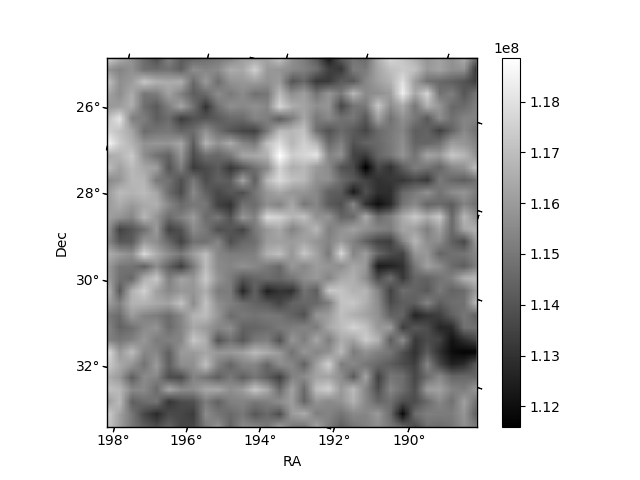
Quadrant B |
|---|---|---|---|
| Quadrant D | 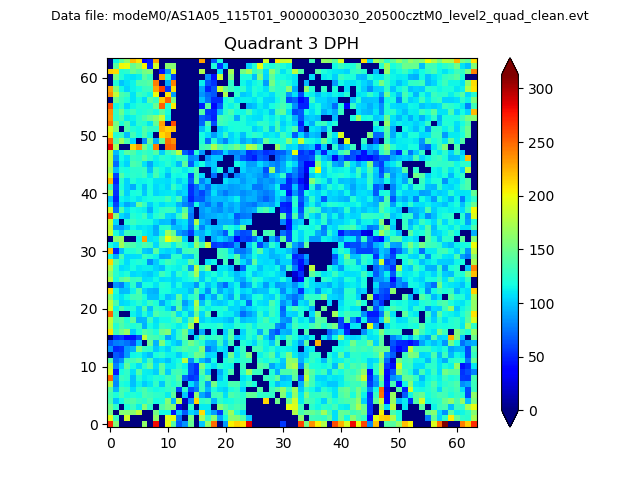 |
 |
Quadrant C |
| Plot type | Count rate plots | Images |
|---|---|---|
| Comparison with Poisson distribution Blue bars denote a histogram of data divided into 1 sec bins. Red curve is a Poisson curve with rate = median count rate of data. |
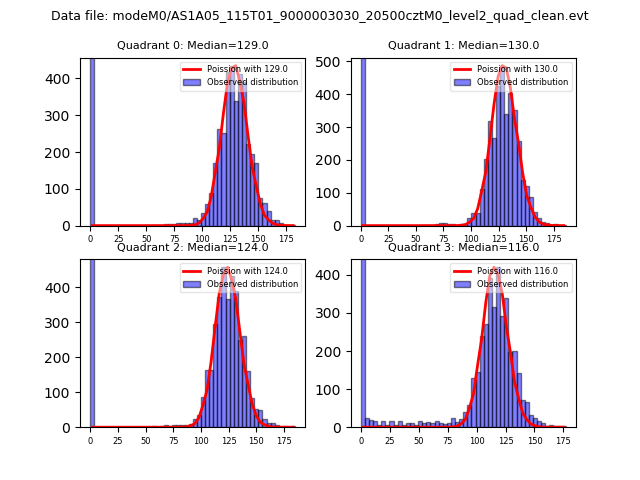 |
 |
| Quadrant-wise count rates Data is divided into 100 sec bins |
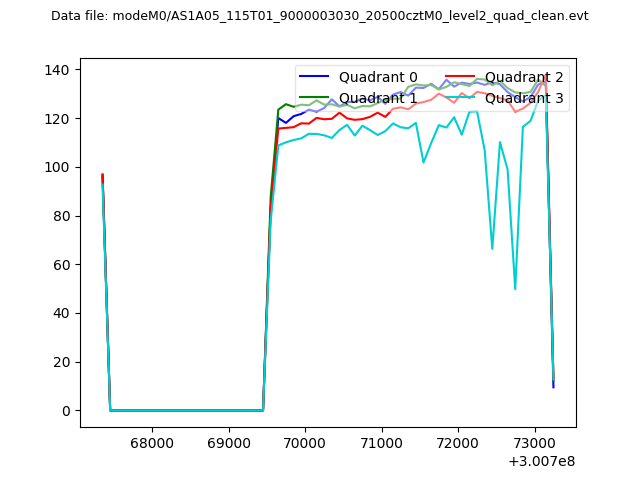 |
|
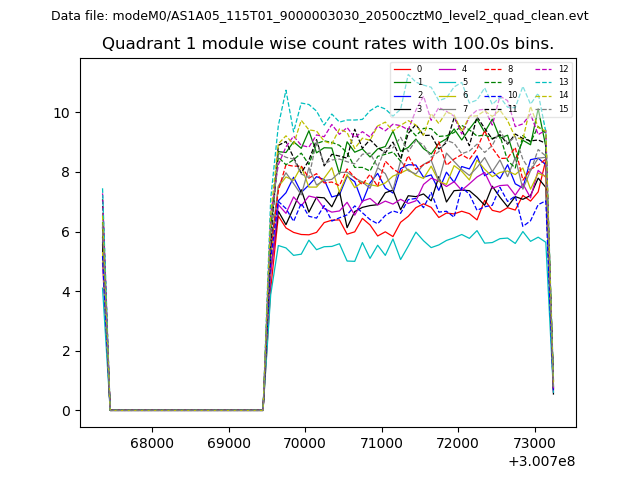
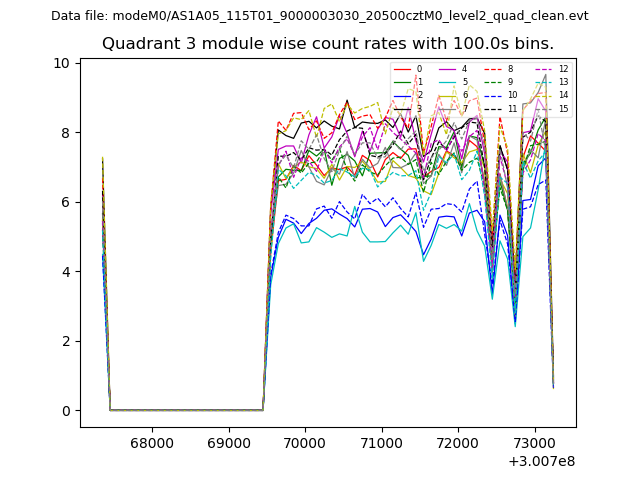
| Module-wise count rates for Quadrant A Data is divided into 100 sec bins |
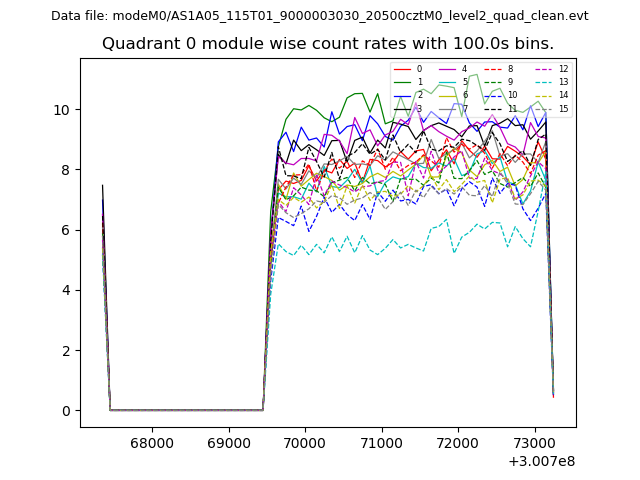 |
 |
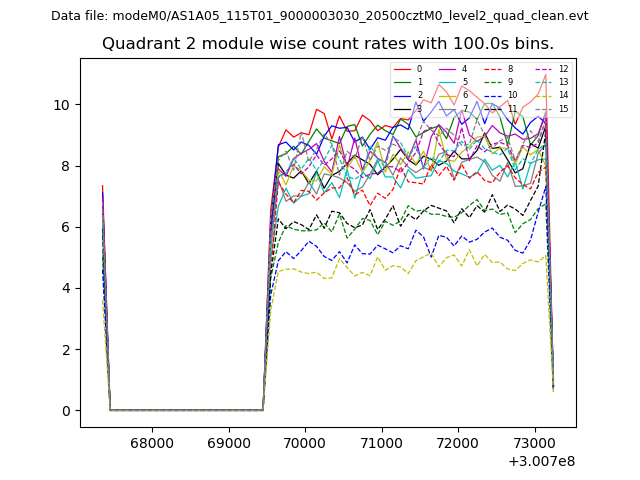
| Module-wise count rates for Quadrant B Data is divided into 100 sec bins |
 |
 |
| Module-wise count rates for Quadrant C Data is divided into 100 sec bins |
 |
 |
| Module-wise count rates for Quadrant D Data is divided into 100 sec bins |
 |
 |
| Parameter | Plot |
|---|---|
| CZT HV Monitor | 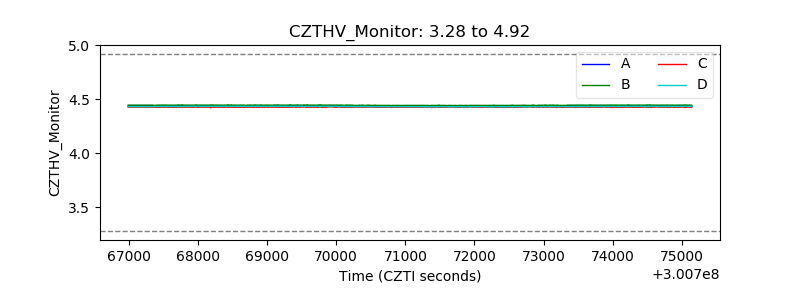 |
| D_VDD | 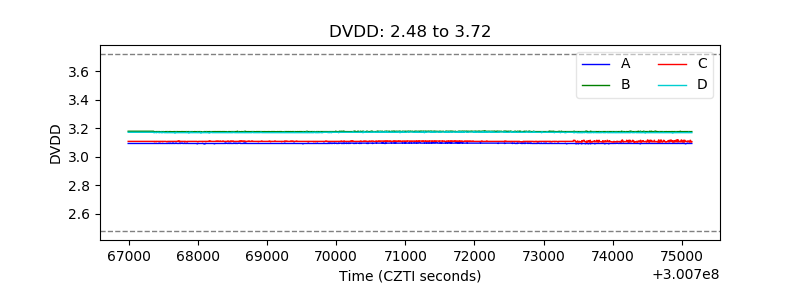 |
| Temperature 1 | 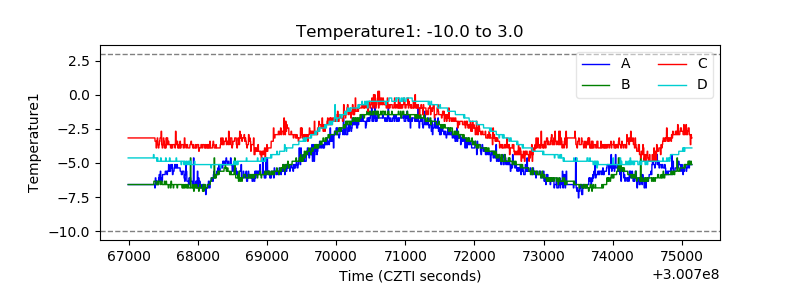 |
| Veto HV Monitor | 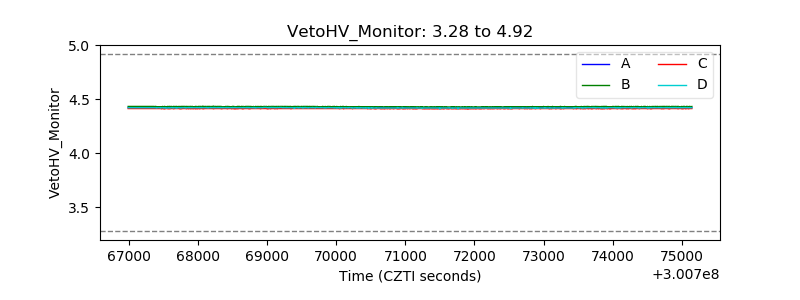 |
| Veto LLD | 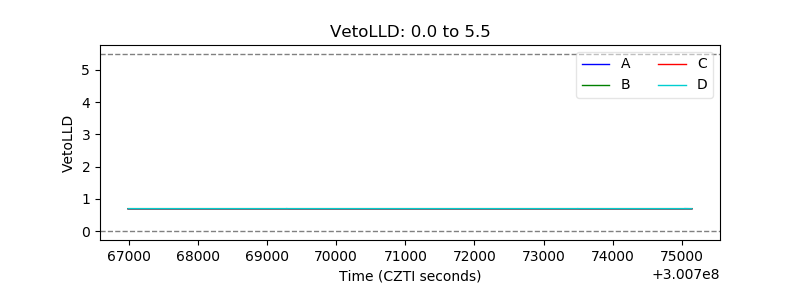 |
| Alpha Counter | 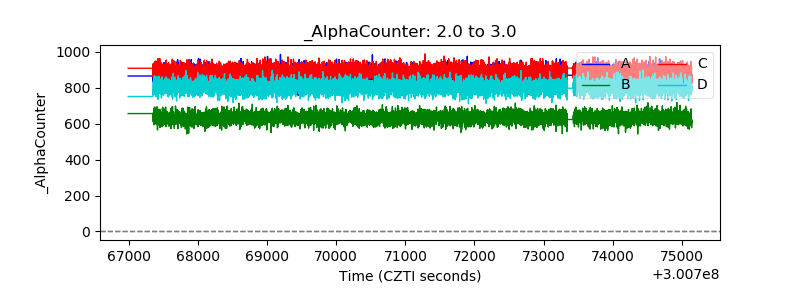 |
| _CPM_Rate | 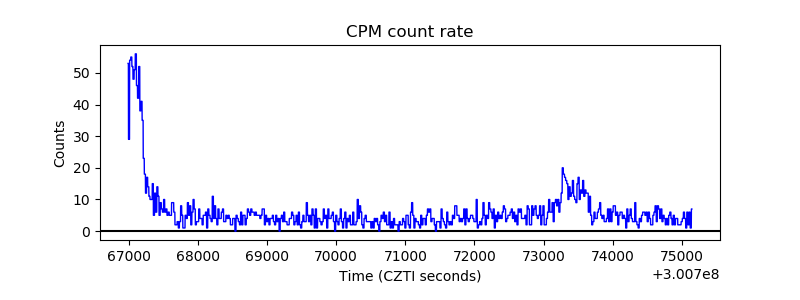 |
| CZT Counter | 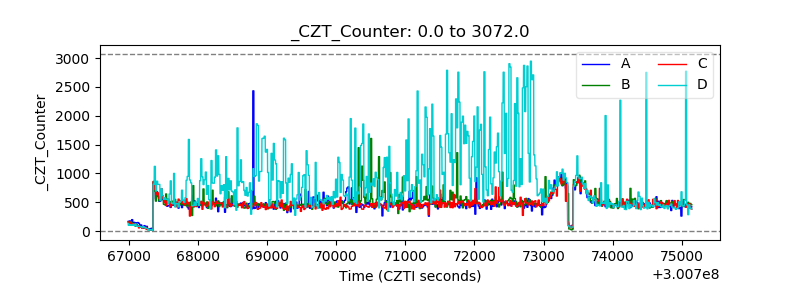 |
| +2.5 Volts monitor | 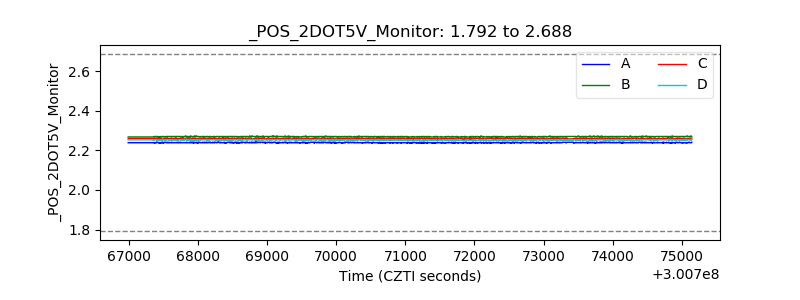 |
| +5 Volts monitor | 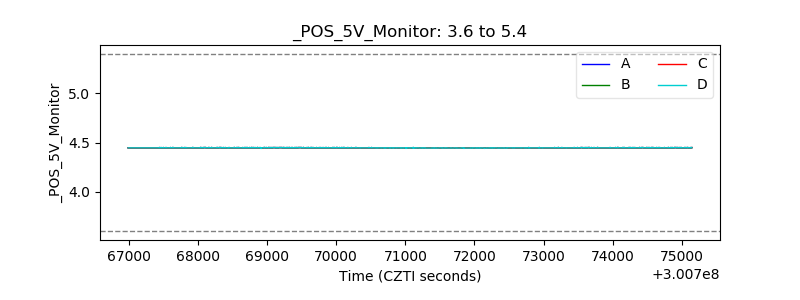 |
| _ROLL_ROT | 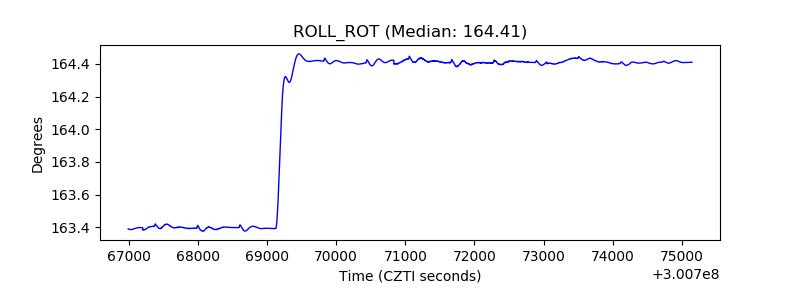 |
| _Roll_DEC | 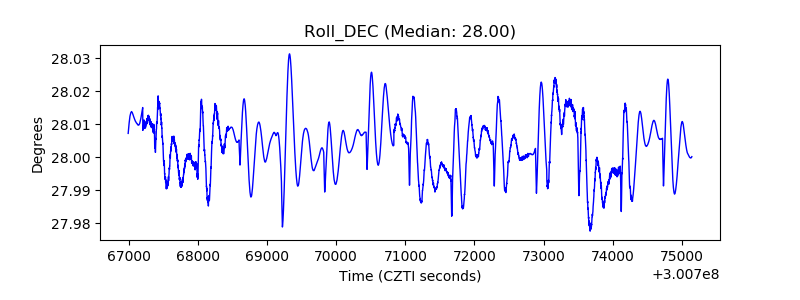 |
| _Roll_RA | 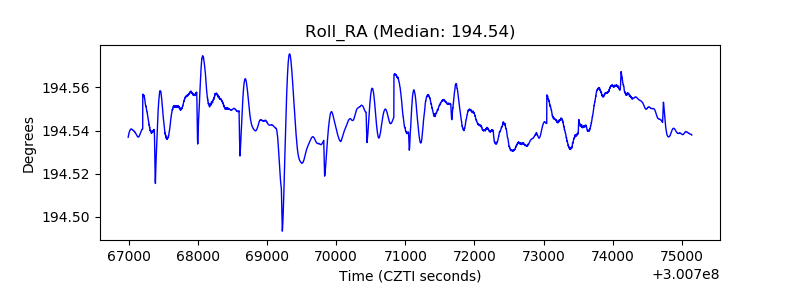 |
| Veto Counter | 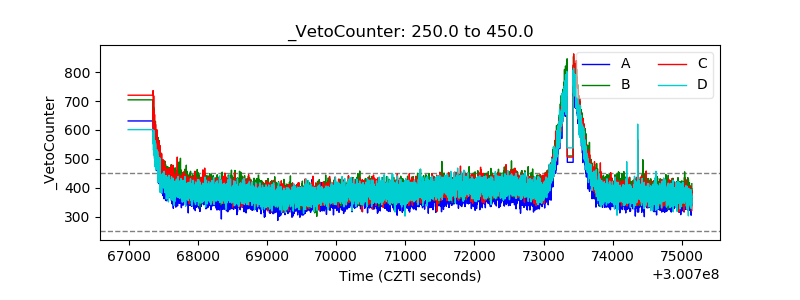 |