| Param | Original file | Final file |
|---|---|---|
| Filename | modeM0/AS1A05_115T01_9000003030_20501cztM0_level2.evt | modeM0/AS1A05_115T01_9000003030_20501cztM0_level2_quad_clean.evt |
| Size (bytes) | 671,307,840 | 78,491,520 |
| Size | 640.2 MB | 74.9 MB |
| Events in quadrant A | 3,915,229 | 480,810 |
| Events in quadrant B | 4,175,745 | 486,809 |
| Events in quadrant C | 3,887,530 | 461,933 |
| Events in quadrant D | 7,810,075 | 391,444 |
| Mode M9 | |||
|---|---|---|---|
| Quadrant | BADHDUFLAG | Total packets | Discarded packets |
| A | 0 | 1 | 0 |
| B | 0 | 1 | 0 |
| C | 0 | 1 | 0 |
| D | 0 | 1 | 0 |
| Mode SS | |||
|---|---|---|---|
| Quadrant | BADHDUFLAG | Total packets | Discarded packets |
| A | 0 | 164 | 0 |
| B | 0 | 164 | 0 |
| C | 0 | 164 | 0 |
| D | 0 | 164 | 0 |
| Mode M0 | |||
|---|---|---|---|
| Quadrant | BADHDUFLAG | Total packets | Discarded packets |
| A | 0 | 16944 | 2 |
| B | 0 | 17411 | 2 |
| C | 0 | 16707 | 2 |
| D | 0 | 28548 | 5 |
| Quadrant | Total seconds | Saturated seconds | Saturation percentage |
|---|---|---|---|
| A | 7978 | 485 | 6.079218% |
| B | 7978 | 514 | 6.442717% |
| C | 7978 | 485 | 6.079218% |
| D | 7978 | 1674 | 20.982702% |
Noise dominated data is calculated using 1-second bins in cleaned event files. If a bin has >2000 counts, and if more than 50% of those come from <1% of pixels, then it is considered to be noise-dominated and hence unusable.
| Quadrant | # 1 sec bins | Bins with >0 counts | Bins with >2000 counts | High rate bins dominated by noise | Noise dominated (total time) | Noise dominated (detector-on time) | Marked lightcurve |
|---|---|---|---|---|---|---|---|
| A | 8148 | 7978 | 5 | 5 | 0.06% | 0.06% | 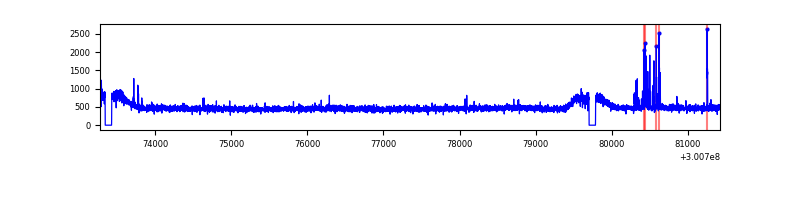 |
| B | 8148 | 7978 | 8 | 8 | 0.10% | 0.10% | 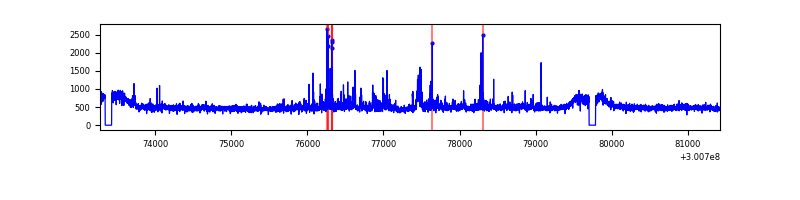 |
| C | 8148 | 7978 | 0 | 0 | 0.00% | 0.00% | 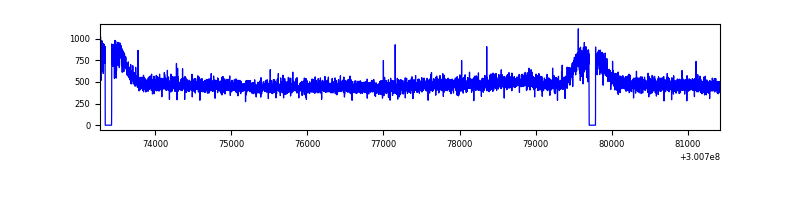 |
| D | 8148 | 7978 | 1253 | 1253 | 15.38% | 15.71% | 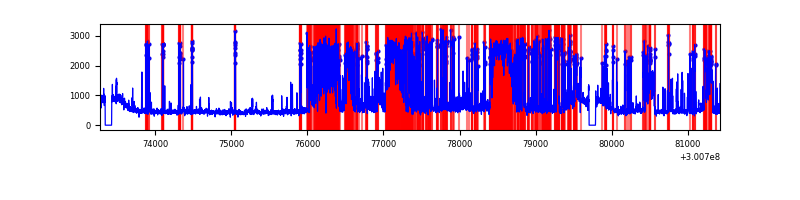 |
Top three noisy pixels from each quadrant. If the there are fewer than three noisy pixels in the level2.evt file, extra rows are filled as -1
| Pixel properties | Quadrant properties | ||||||
|---|---|---|---|---|---|---|---|
| Quadrant | DetID | PixID | Counts | Sigma | Mean | Median | Sigma |
| A | 5 | 16 | 103318 | 506.35 | 988 | 961 | 202.1 |
| A | 12 | 96 | 10423 | 46.81 | 988 | 961 | 202.1 |
| A | 0 | 226 | 8588 | 37.73 | 988 | 961 | 202.1 |
| B | 0 | 189 | 88313 | 455.78 | 989 | 960 | 191.7 |
| B | 7 | 220 | 63334 | 325.45 | 989 | 960 | 191.7 |
| B | 0 | 197 | 58930 | 302.47 | 989 | 960 | 191.7 |
| C | 14 | 238 | 145523 | 643.7 | 953 | 955 | 224.6 |
| C | 8 | 128 | 10924 | 44.39 | 953 | 955 | 224.6 |
| C | 13 | 61 | 6649 | 25.35 | 953 | 955 | 224.6 |
| D | 2 | 16 | 1533368 | 6881.26 | 906 | 875 | 222.7 |
| D | 1 | 52 | 1391598 | 6244.68 | 906 | 875 | 222.7 |
| D | 5 | 222 | 741114 | 3323.85 | 906 | 875 | 222.7 |
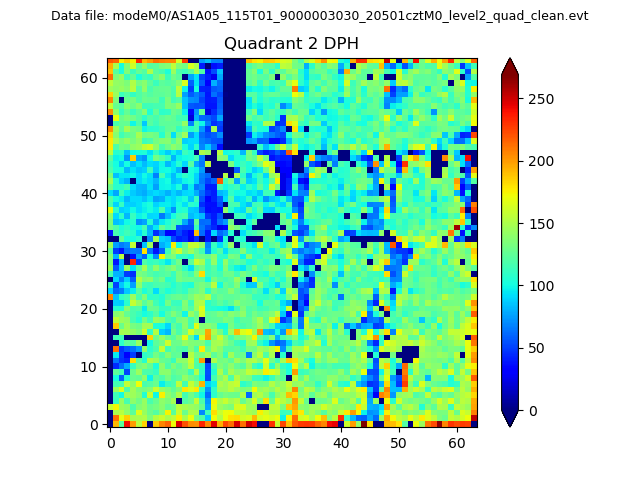
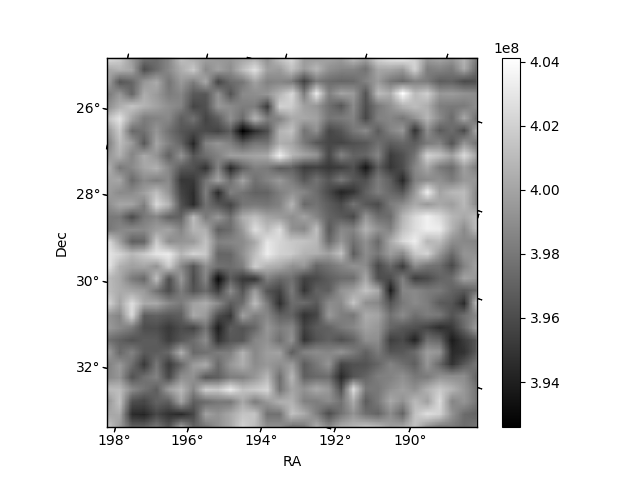
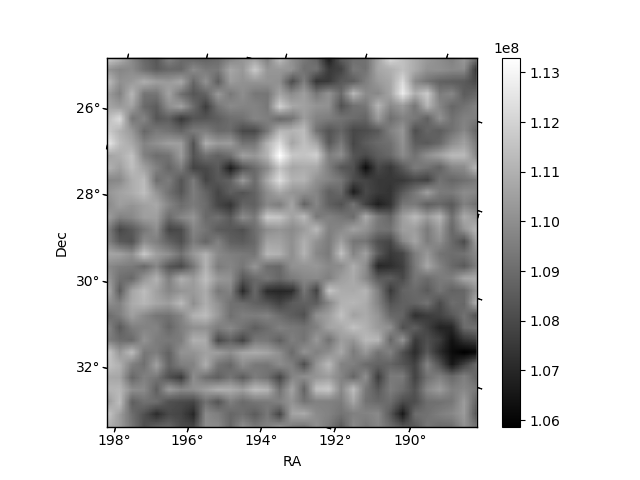
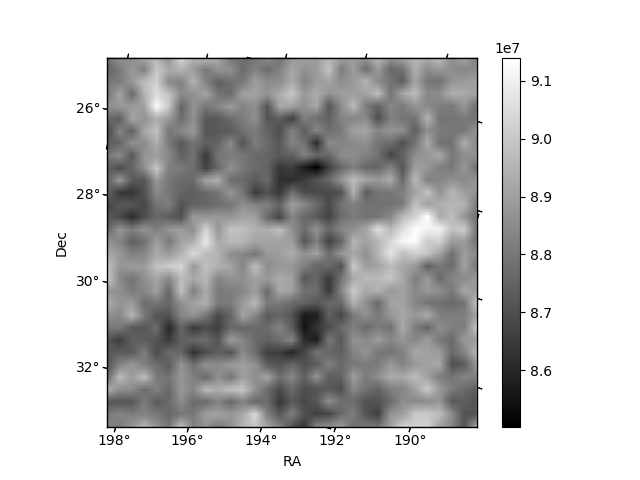
Histogram calculated using DETX and DETY for each event in the final _common_clean file
| Quadrant A | 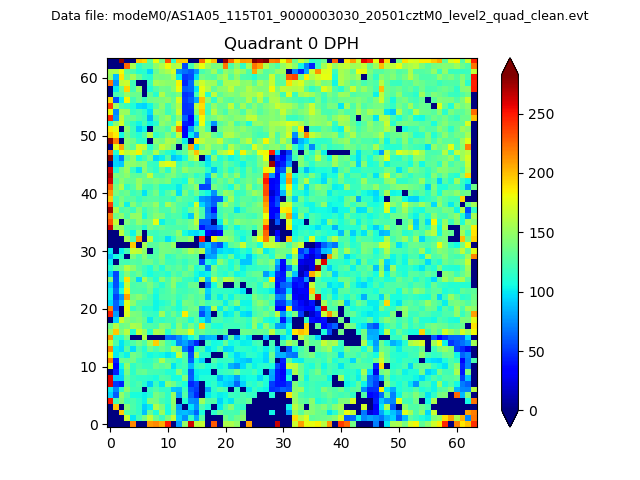 |
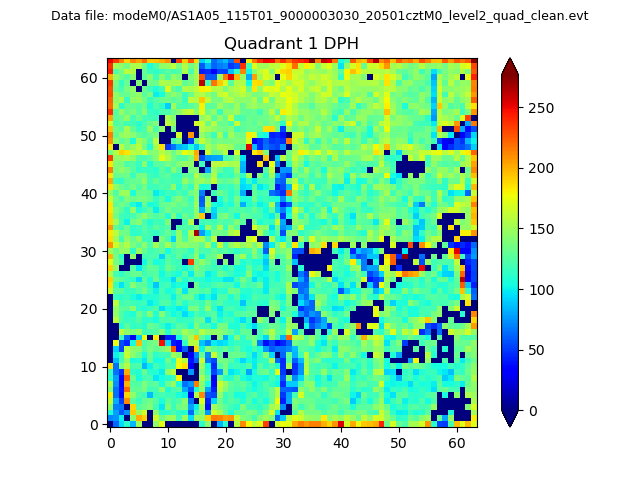 |
Quadrant B |
|---|---|---|---|
| Quadrant D | 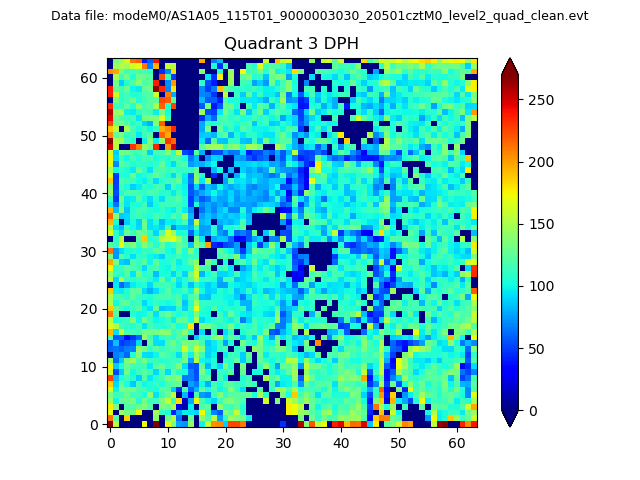 |
 |
Quadrant C |
| Plot type | Count rate plots | Images |
|---|---|---|
| Comparison with Poisson distribution Blue bars denote a histogram of data divided into 1 sec bins. Red curve is a Poisson curve with rate = median count rate of data. |
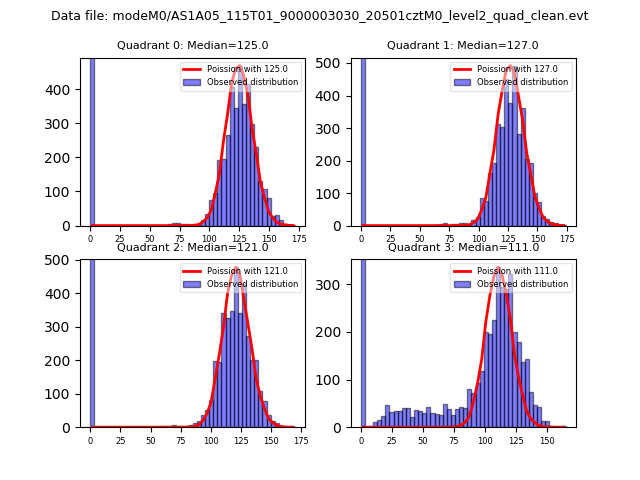 |
 |
| Quadrant-wise count rates Data is divided into 100 sec bins |
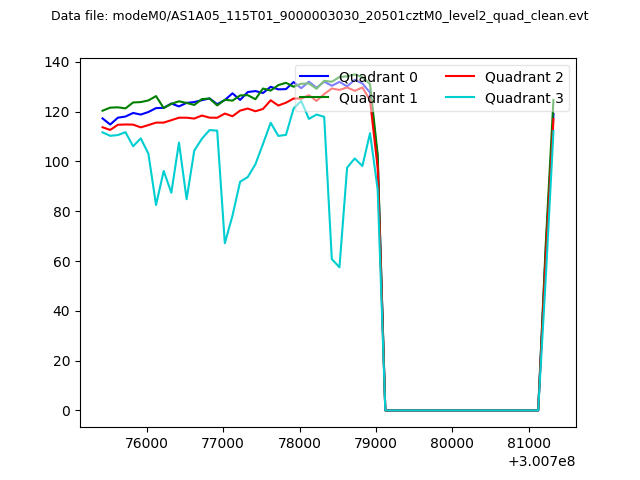 |
|
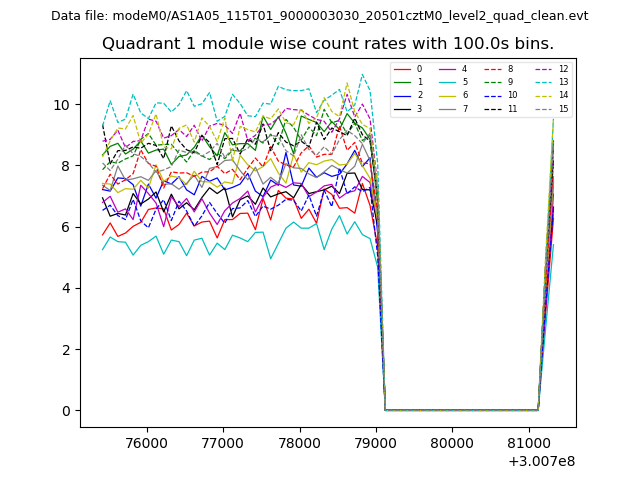
| Module-wise count rates for Quadrant A Data is divided into 100 sec bins |
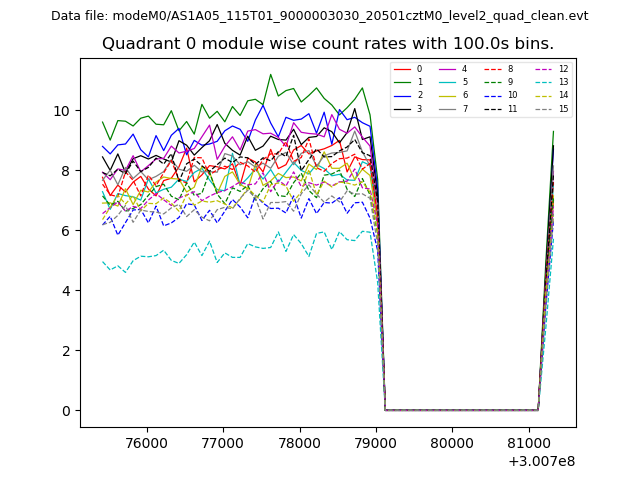 |
 |
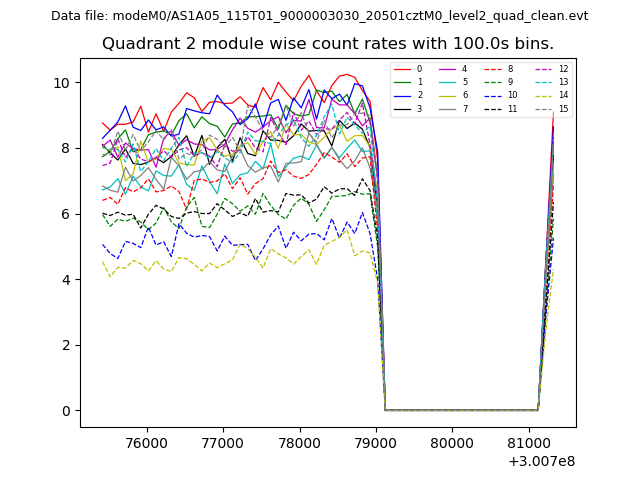
| Module-wise count rates for Quadrant B Data is divided into 100 sec bins |
 |
 |
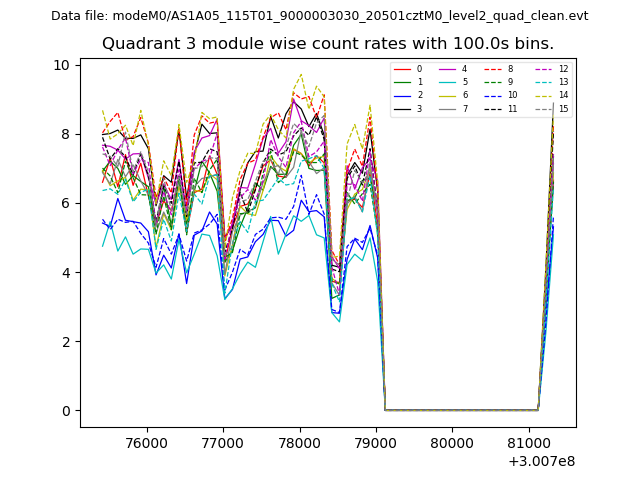
| Module-wise count rates for Quadrant C Data is divided into 100 sec bins |
 |
 |
| Module-wise count rates for Quadrant D Data is divided into 100 sec bins |
 |
 |
| Parameter | Plot |
|---|---|
| CZT HV Monitor | 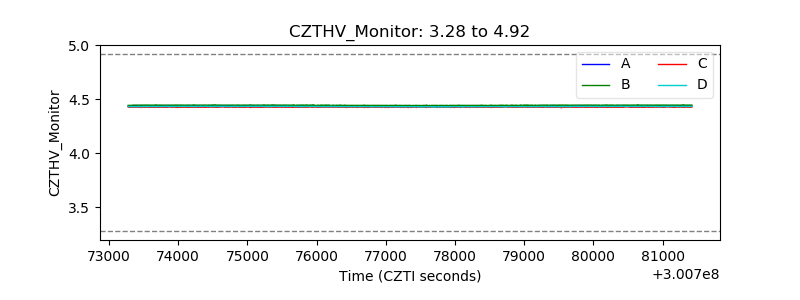 |
| D_VDD | 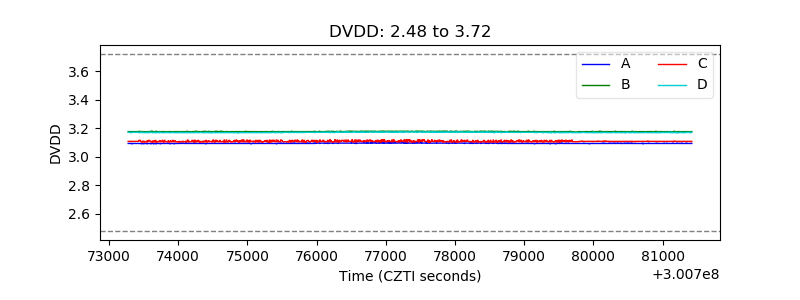 |
| Temperature 1 | 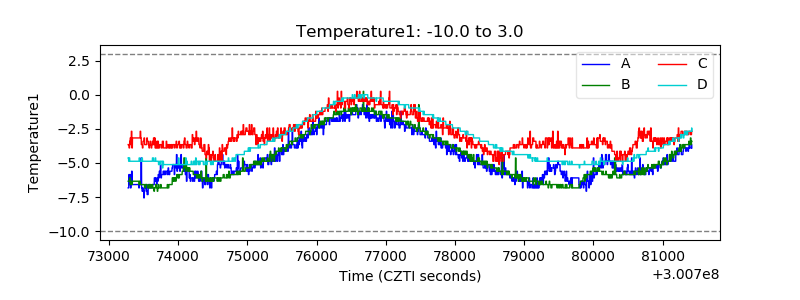 |
| Veto HV Monitor |  |
| Veto LLD | 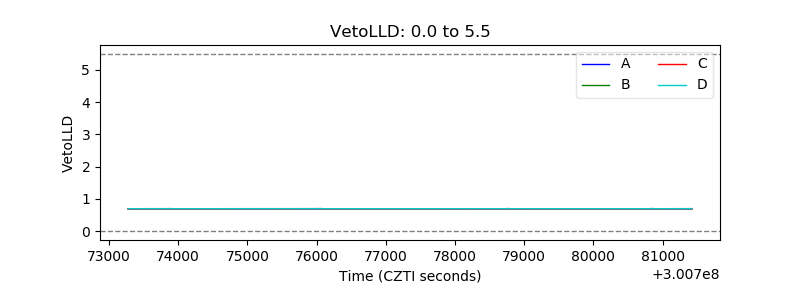 |
| Alpha Counter | 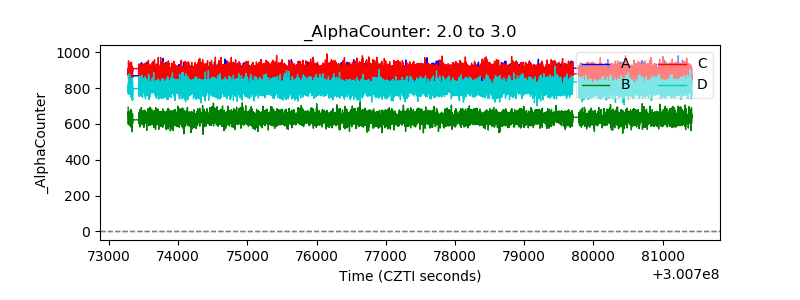 |
| _CPM_Rate | 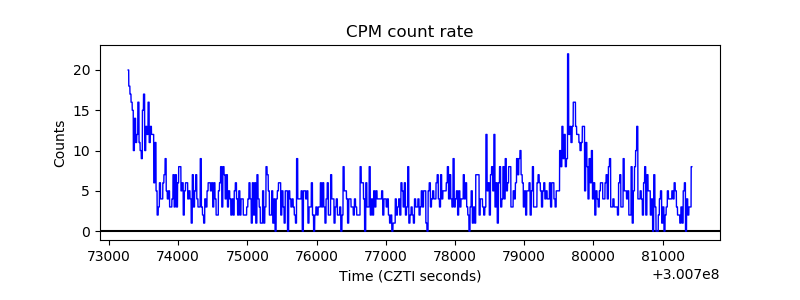 |
| CZT Counter | 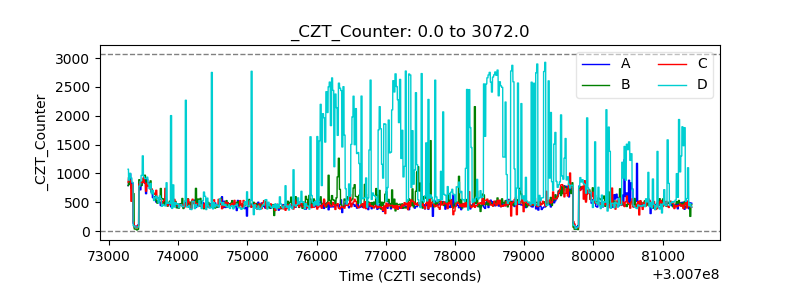 |
| +2.5 Volts monitor |  |
| +5 Volts monitor |  |
| _ROLL_ROT | 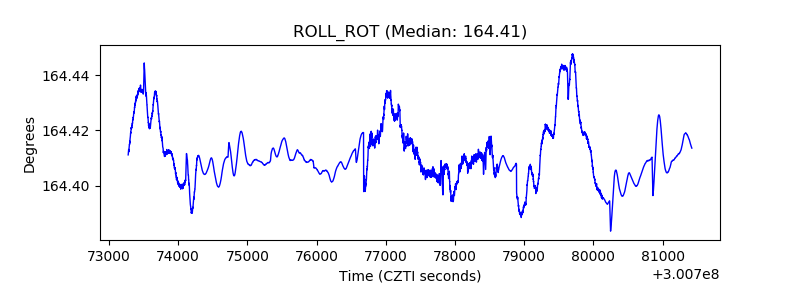 |
| _Roll_DEC |  |
| _Roll_RA | 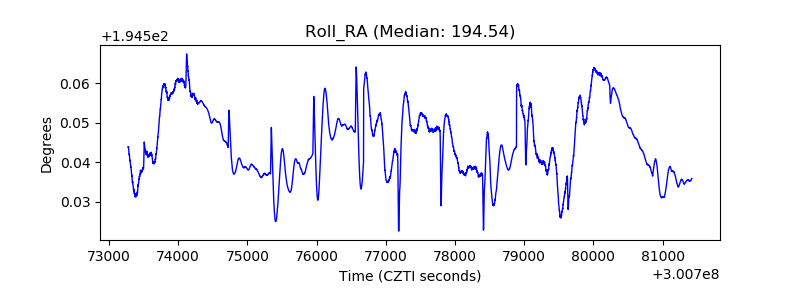 |
| Veto Counter | 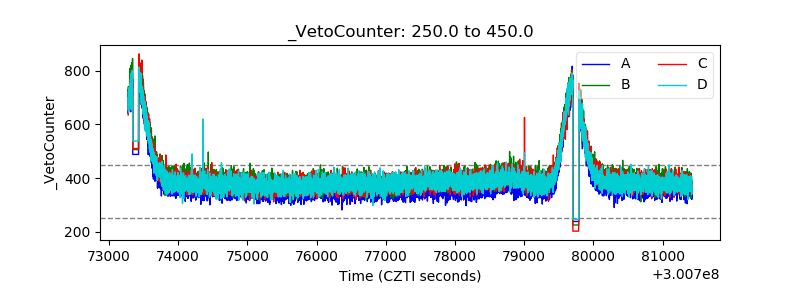 |