| Param | Original file | Final file |
|---|---|---|
| Filename | modeM0/AS1A05_115T01_9000003030_20504cztM0_level2.evt | modeM0/AS1A05_115T01_9000003030_20504cztM0_level2_quad_clean.evt |
| Size (bytes) | 1,735,467,840 | 239,852,160 |
| Size | 1.6 GB | 228.7 MB |
| Events in quadrant A | 9,222,231 | 1,574,557 |
| Events in quadrant B | 10,350,643 | 1,575,361 |
| Events in quadrant C | 9,088,141 | 1,508,345 |
| Events in quadrant D | 22,598,108 | 1,277,503 |
| Mode M9 | |||
|---|---|---|---|
| Quadrant | BADHDUFLAG | Total packets | Discarded packets |
| A | 0 | 18 | 0 |
| B | 0 | 18 | 0 |
| C | 0 | 18 | 0 |
| D | 0 | 18 | 0 |
| Mode SS | |||
|---|---|---|---|
| Quadrant | BADHDUFLAG | Total packets | Discarded packets |
| A | 0 | 392 | 0 |
| B | 0 | 392 | 0 |
| C | 0 | 392 | 0 |
| D | 0 | 392 | 0 |
| Mode M0 | |||
|---|---|---|---|
| Quadrant | BADHDUFLAG | Total packets | Discarded packets |
| A | 0 | 40192 | 4 |
| B | 0 | 42631 | 4 |
| C | 0 | 39511 | 4 |
| D | 0 | 79857 | 4 |
| Quadrant | Total seconds | Saturated seconds | Saturation percentage |
|---|---|---|---|
| A | 19264 | 501 | 2.600706% |
| B | 19264 | 539 | 2.797965% |
| C | 19264 | 501 | 2.600706% |
| D | 19264 | 4695 | 24.371885% |
Noise dominated data is calculated using 1-second bins in cleaned event files. If a bin has >2000 counts, and if more than 50% of those come from <1% of pixels, then it is considered to be noise-dominated and hence unusable.
| Quadrant | # 1 sec bins | Bins with >0 counts | Bins with >2000 counts | High rate bins dominated by noise | Noise dominated (total time) | Noise dominated (detector-on time) | Marked lightcurve |
|---|---|---|---|---|---|---|---|
| A | 21064 | 19264 | 31 | 31 | 0.15% | 0.16% | 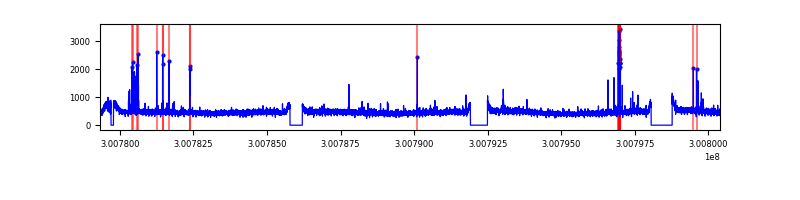 |
| B | 21064 | 19264 | 42 | 42 | 0.20% | 0.22% | 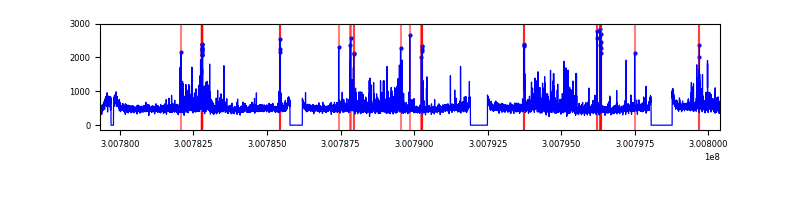 |
| C | 21064 | 19264 | 0 | 0 | 0.00% | 0.00% | 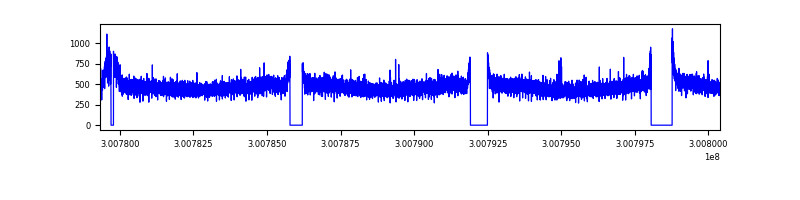 |
| D | 21064 | 19264 | 4381 | 4381 | 20.80% | 22.74% | 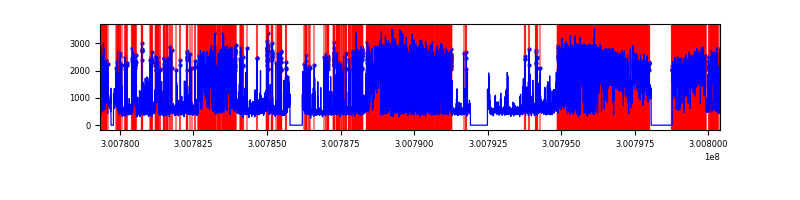 |
Top three noisy pixels from each quadrant. If the there are fewer than three noisy pixels in the level2.evt file, extra rows are filled as -1
| Pixel properties | Quadrant properties | ||||||
|---|---|---|---|---|---|---|---|
| Quadrant | DetID | PixID | Counts | Sigma | Mean | Median | Sigma |
| A | 5 | 16 | 199327 | 416.76 | 2329 | 2275 | 472.8 |
| A | 12 | 96 | 53871 | 109.12 | 2329 | 2275 | 472.8 |
| A | 13 | 254 | 22941 | 43.71 | 2329 | 2275 | 472.8 |
| B | 0 | 189 | 432453 | 972.45 | 2323 | 2258 | 442.4 |
| B | 0 | 197 | 311618 | 699.3 | 2323 | 2258 | 442.4 |
| B | 7 | 220 | 133399 | 296.44 | 2323 | 2258 | 442.4 |
| C | 14 | 238 | 343639 | 650.47 | 2234 | 2248 | 524.8 |
| C | 13 | 61 | 15780 | 25.78 | 2234 | 2248 | 524.8 |
| C | 0 | 207 | 12011 | 18.6 | 2234 | 2248 | 524.8 |
| D | 2 | 16 | 10012148 | 19487.68 | 2096 | 2033 | 513.7 |
| D | 7 | 38 | 1297147 | 2521.33 | 2096 | 2033 | 513.7 |
| D | 2 | 165 | 1128240 | 2192.5 | 2096 | 2033 | 513.7 |
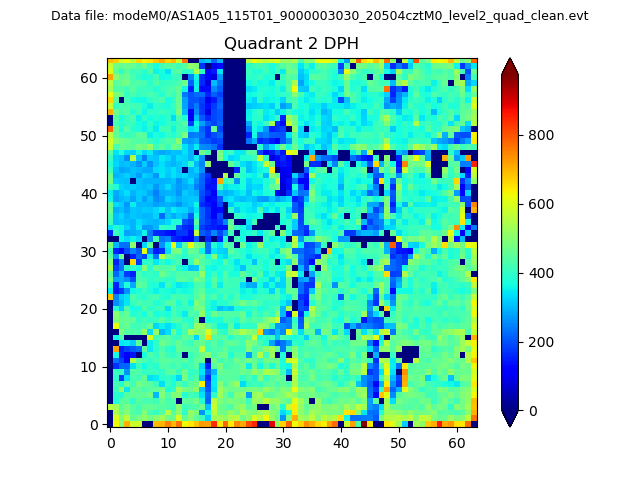
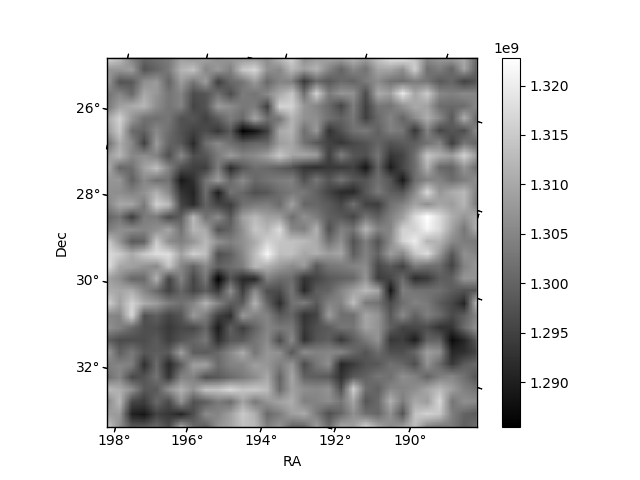
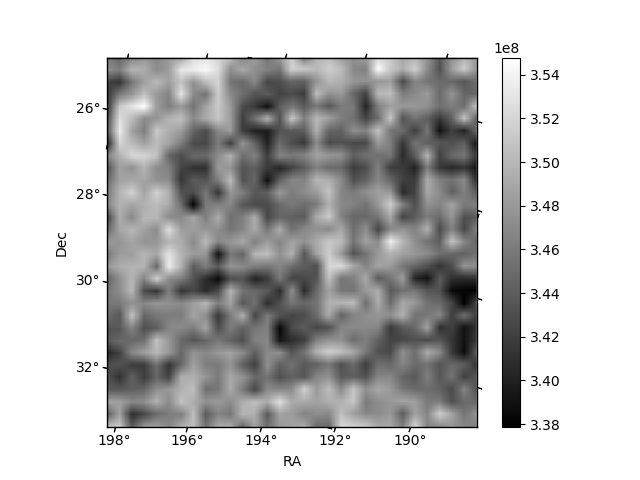
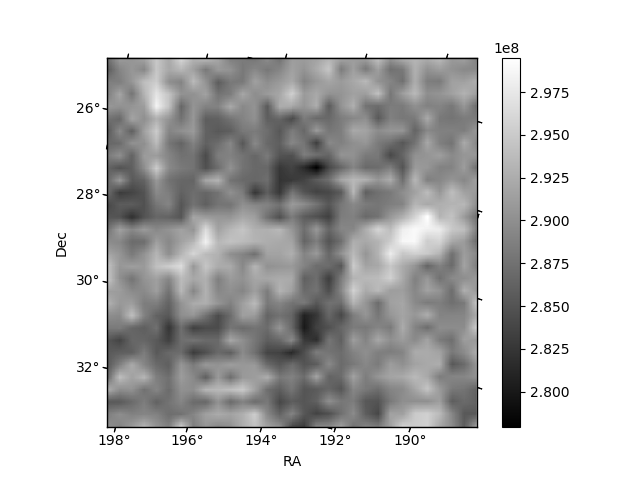
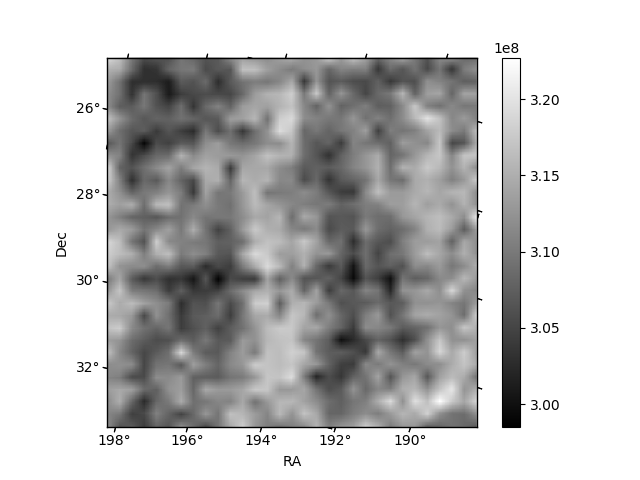
Histogram calculated using DETX and DETY for each event in the final _common_clean file
| Quadrant A | 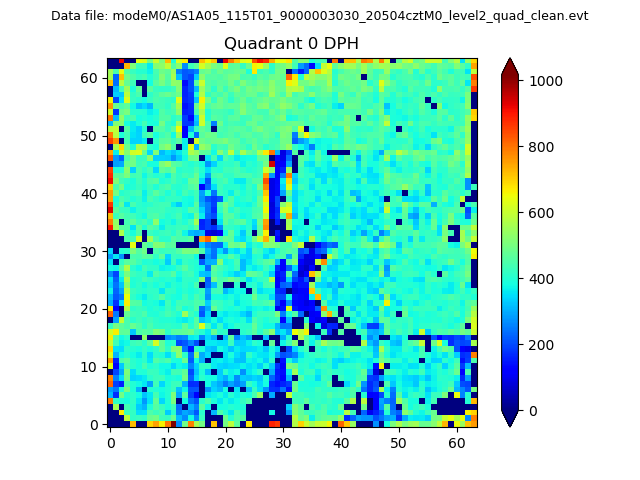 |
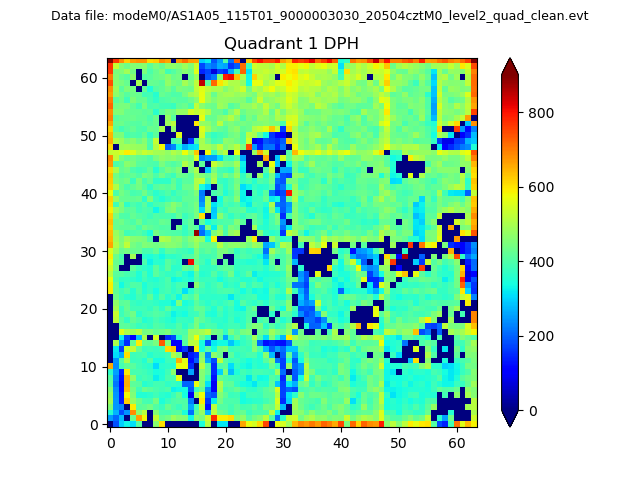 |
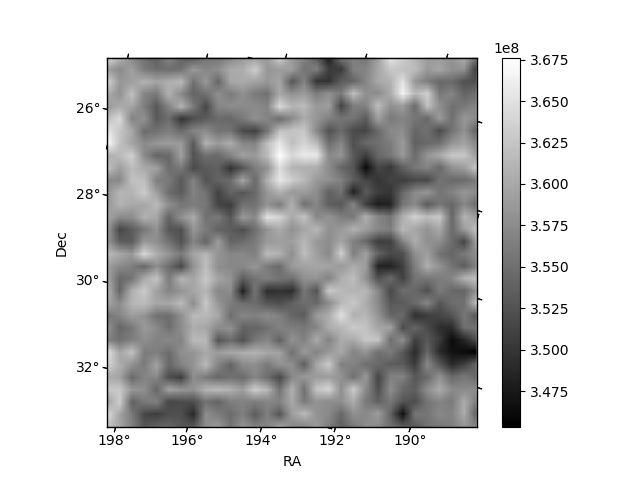
Quadrant B |
|---|---|---|---|
| Quadrant D | 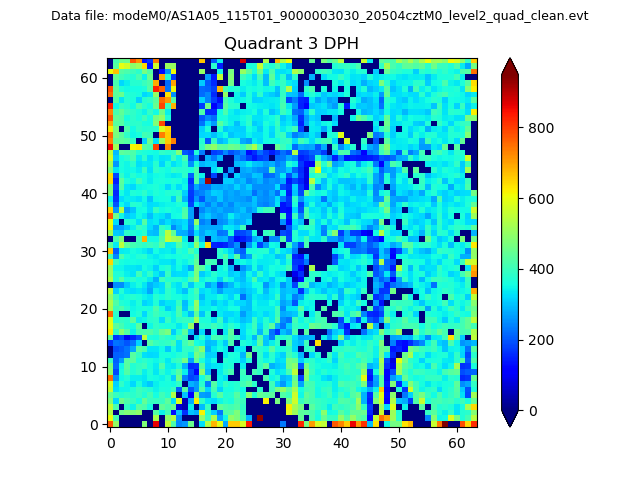 |
 |
Quadrant C |
| Plot type | Count rate plots | Images |
|---|---|---|
| Comparison with Poisson distribution Blue bars denote a histogram of data divided into 1 sec bins. Red curve is a Poisson curve with rate = median count rate of data. |
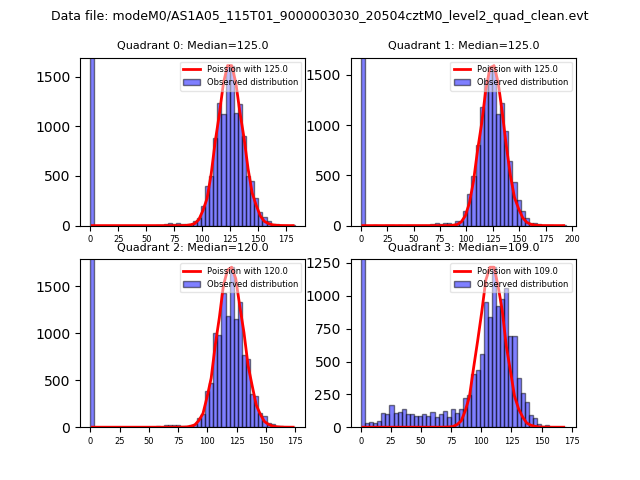 |
 |
| Quadrant-wise count rates Data is divided into 100 sec bins |
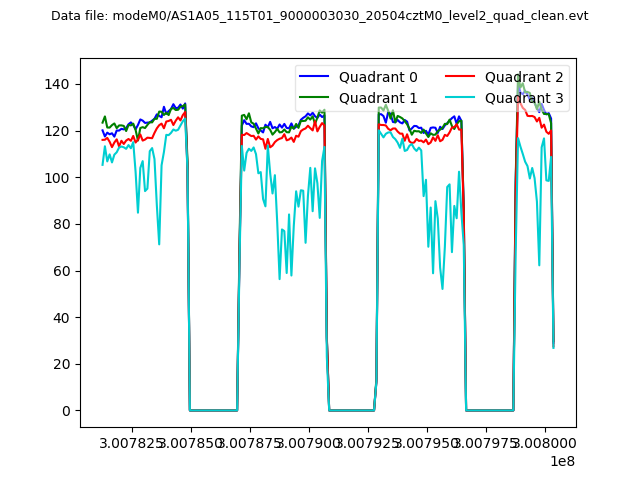 |
|
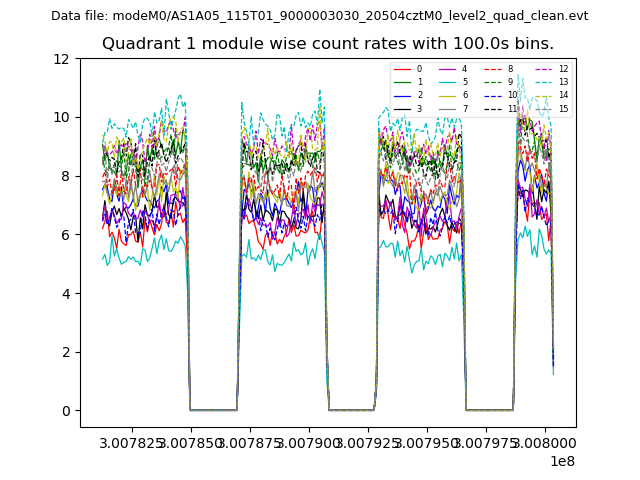
| Module-wise count rates for Quadrant A Data is divided into 100 sec bins |
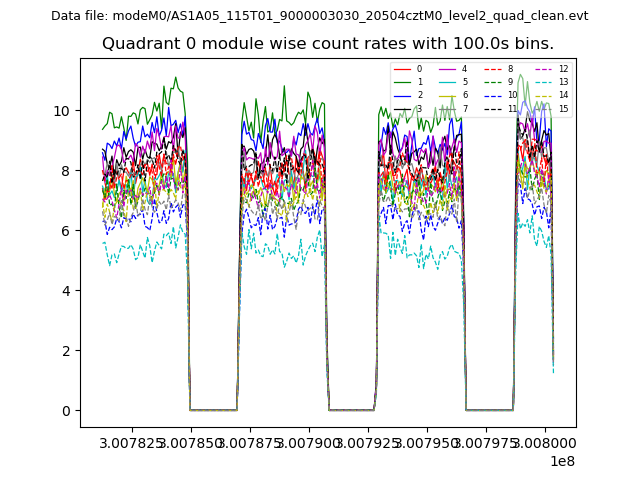 |
 |
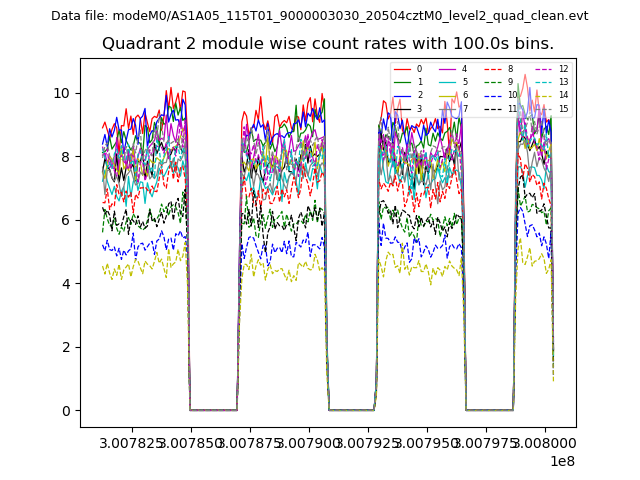
| Module-wise count rates for Quadrant B Data is divided into 100 sec bins |
 |
 |
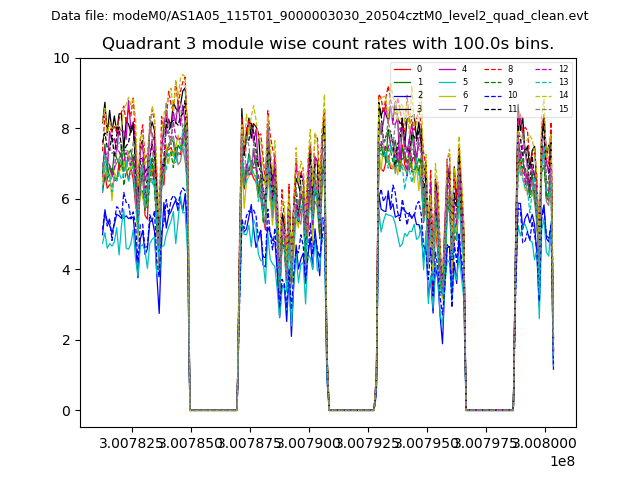
| Module-wise count rates for Quadrant C Data is divided into 100 sec bins |
 |
 |
| Module-wise count rates for Quadrant D Data is divided into 100 sec bins |
 |
 |
| Parameter | Plot |
|---|---|
| CZT HV Monitor | 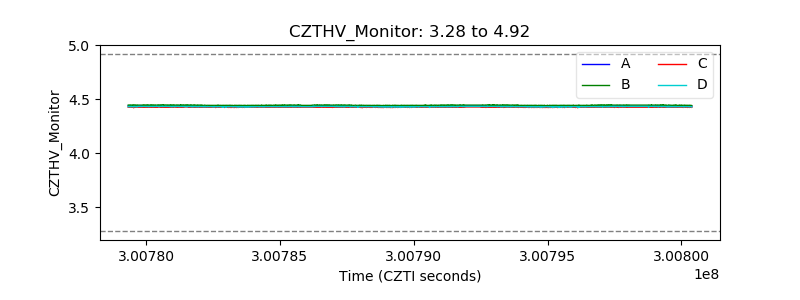 |
| D_VDD | 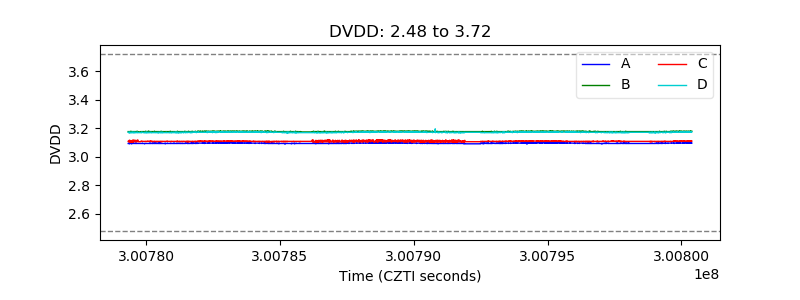 |
| Temperature 1 | 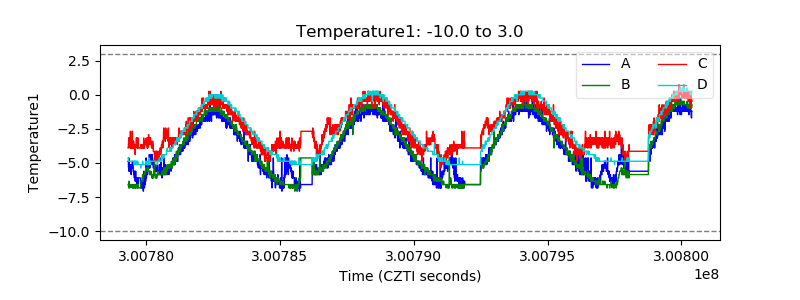 |
| Veto HV Monitor | 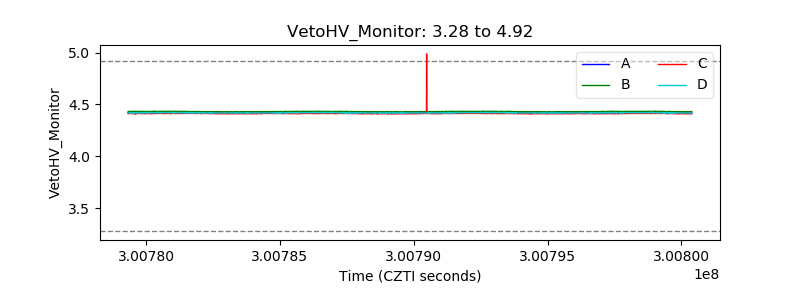 |
| Veto LLD | 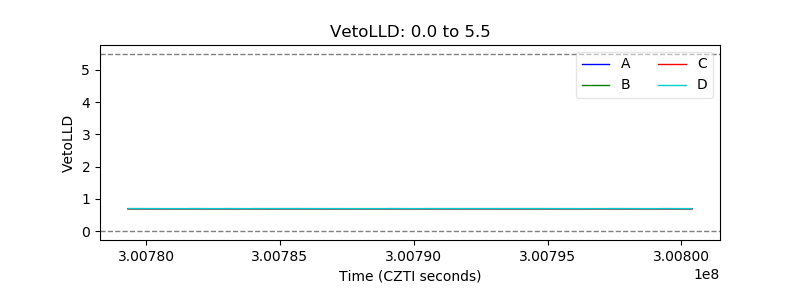 |
| Alpha Counter | 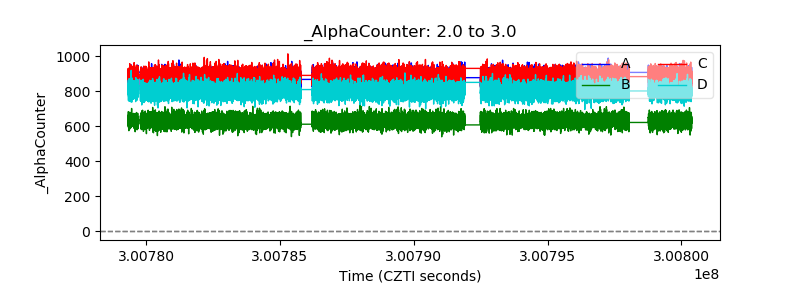 |
| _CPM_Rate | 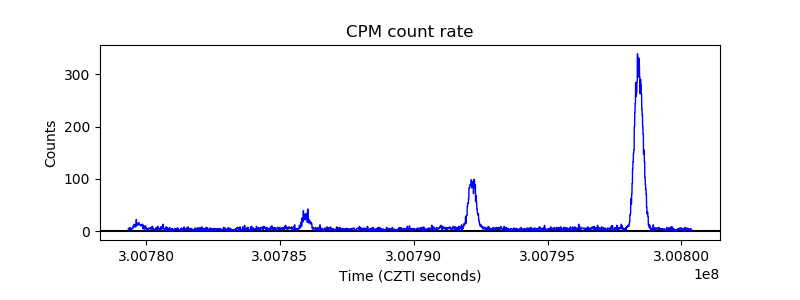 |
| CZT Counter | 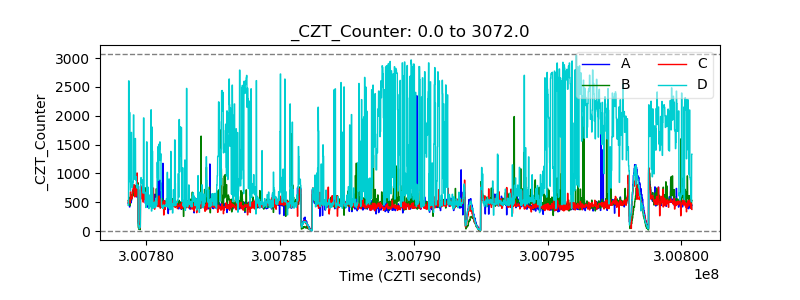 |
| +2.5 Volts monitor |  |
| +5 Volts monitor |  |
| _ROLL_ROT | 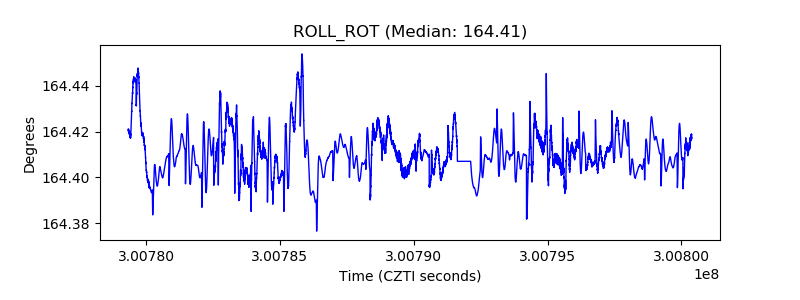 |
| _Roll_DEC | 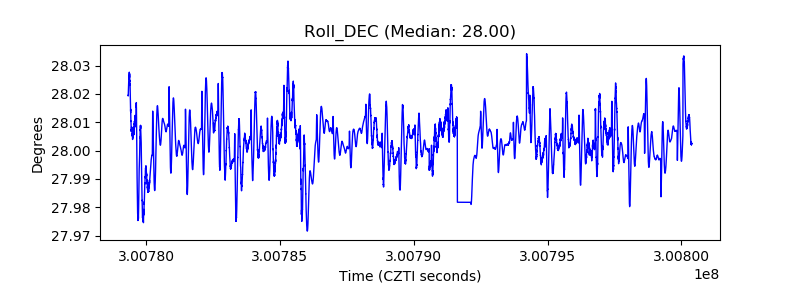 |
| _Roll_RA | 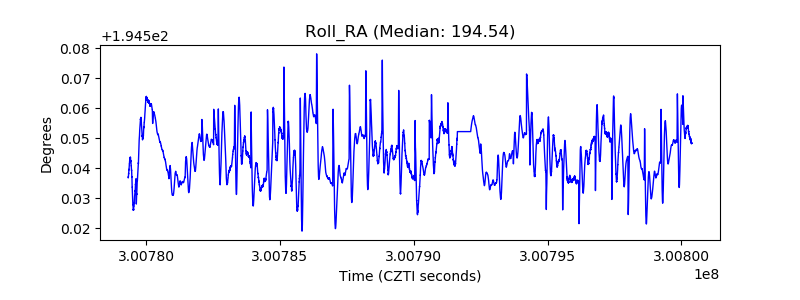 |
| Veto Counter | 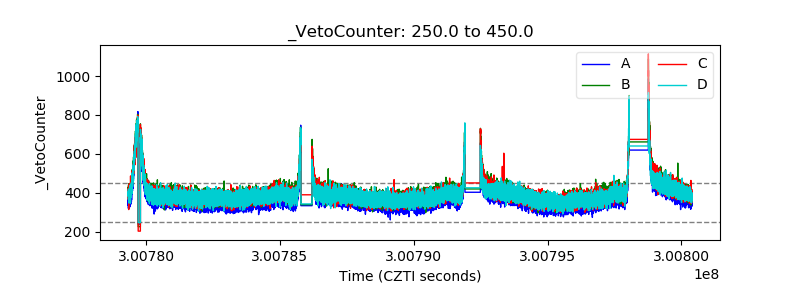 |