| Param | Original file | Final file |
|---|---|---|
| Filename | modeM0/AS1A05_115T01_9000003030_20507cztM0_level2.evt | modeM0/AS1A05_115T01_9000003030_20507cztM0_level2_quad_clean.evt |
| Size (bytes) | 585,420,480 | 81,374,400 |
| Size | 558.3 MB | 77.6 MB |
| Events in quadrant A | 2,999,426 | 547,583 |
| Events in quadrant B | 3,271,656 | 551,275 |
| Events in quadrant C | 2,853,596 | 526,940 |
| Events in quadrant D | 8,197,544 | 417,920 |
| Mode M9 | |||
|---|---|---|---|
| Quadrant | BADHDUFLAG | Total packets | Discarded packets |
| A | 0 | 11 | 0 |
| B | 0 | 11 | 0 |
| C | 0 | 11 | 0 |
| D | 0 | 11 | 0 |
| Mode SS | |||
|---|---|---|---|
| Quadrant | BADHDUFLAG | Total packets | Discarded packets |
| A | 0 | 122 | 0 |
| B | 0 | 122 | 0 |
| C | 0 | 122 | 0 |
| D | 0 | 122 | 0 |
| Mode M0 | |||
|---|---|---|---|
| Quadrant | BADHDUFLAG | Total packets | Discarded packets |
| A | 0 | 12981 | 1 |
| B | 0 | 13676 | 1 |
| C | 0 | 12392 | 1 |
| D | 0 | 28525 | 1 |
| Quadrant | Total seconds | Saturated seconds | Saturation percentage |
|---|---|---|---|
| A | 6013 | 53 | 0.881424% |
| B | 6013 | 34 | 0.565442% |
| C | 6013 | 40 | 0.665225% |
| D | 6013 | 1649 | 27.423915% |
Noise dominated data is calculated using 1-second bins in cleaned event files. If a bin has >2000 counts, and if more than 50% of those come from <1% of pixels, then it is considered to be noise-dominated and hence unusable.
| Quadrant | # 1 sec bins | Bins with >0 counts | Bins with >2000 counts | High rate bins dominated by noise | Noise dominated (total time) | Noise dominated (detector-on time) | Marked lightcurve |
|---|---|---|---|---|---|---|---|
| A | 7143 | 6013 | 21 | 21 | 0.29% | 0.35% | 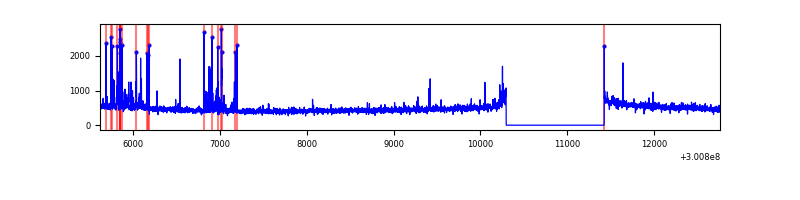 |
| B | 7143 | 6013 | 11 | 11 | 0.15% | 0.18% | 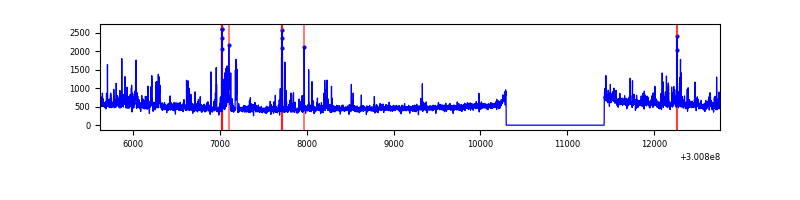 |
| C | 7143 | 6013 | 0 | 0 | 0.00% | 0.00% | 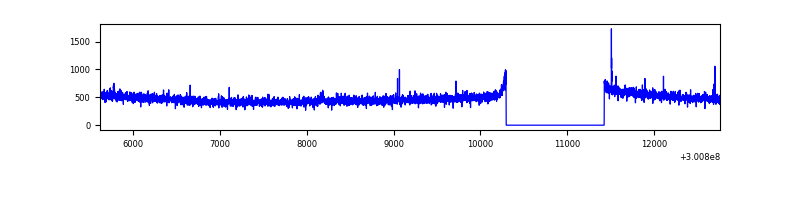 |
| D | 7142 | 6012 | 1540 | 1540 | 21.56% | 25.62% | 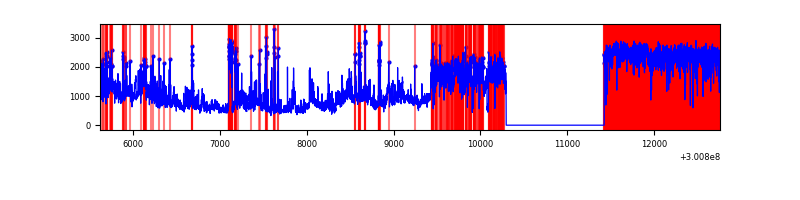 |
Top three noisy pixels from each quadrant. If the there are fewer than three noisy pixels in the level2.evt file, extra rows are filled as -1
| Pixel properties | Quadrant properties | ||||||
|---|---|---|---|---|---|---|---|
| Quadrant | DetID | PixID | Counts | Sigma | Mean | Median | Sigma |
| A | 5 | 16 | 197992 | 1338.6 | 724 | 708 | 147.4 |
| A | 13 | 254 | 9149 | 57.27 | 724 | 708 | 147.4 |
| A | 12 | 194 | 6405 | 38.65 | 724 | 708 | 147.4 |
| B | 0 | 197 | 147762 | 1067.95 | 727 | 710 | 137.7 |
| B | 0 | 190 | 80054 | 576.23 | 727 | 710 | 137.7 |
| B | 0 | 189 | 71773 | 516.09 | 727 | 710 | 137.7 |
| C | 14 | 238 | 108151 | 655.7 | 699 | 703 | 163.9 |
| C | 0 | 207 | 7246 | 39.93 | 699 | 703 | 163.9 |
| C | 8 | 208 | 7004 | 38.45 | 699 | 703 | 163.9 |
| D | 2 | 16 | 3762236 | 24688.0 | 626 | 608 | 152.4 |
| D | 1 | 52 | 1185069 | 7773.76 | 626 | 608 | 152.4 |
| D | 13 | 153 | 378350 | 2479.16 | 626 | 608 | 152.4 |
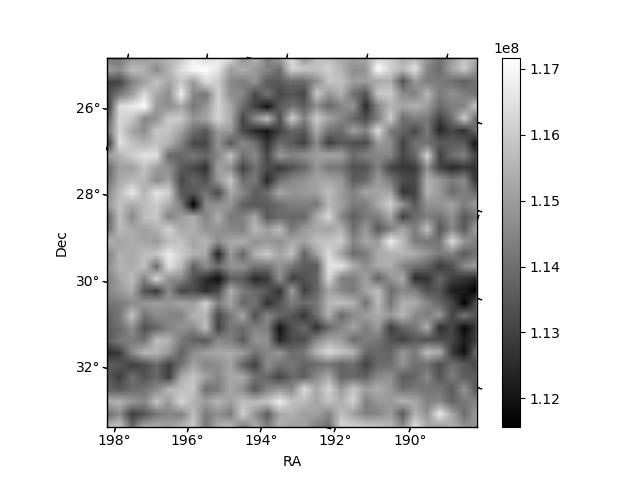
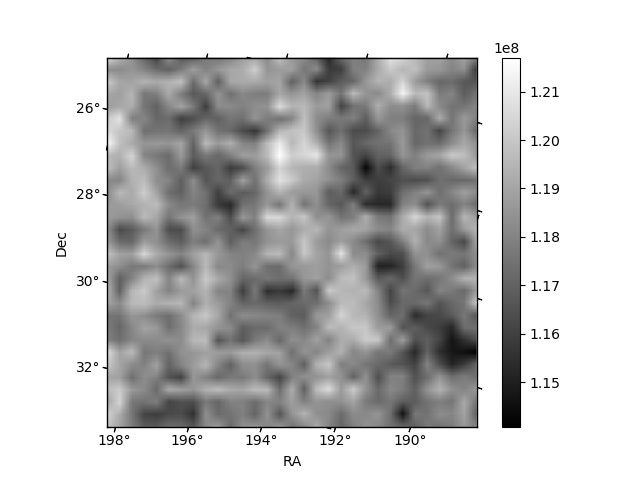
Histogram calculated using DETX and DETY for each event in the final _common_clean file
| Quadrant A | 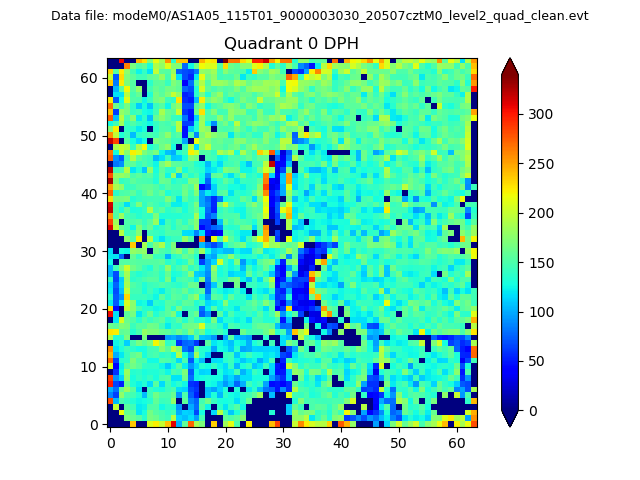 |
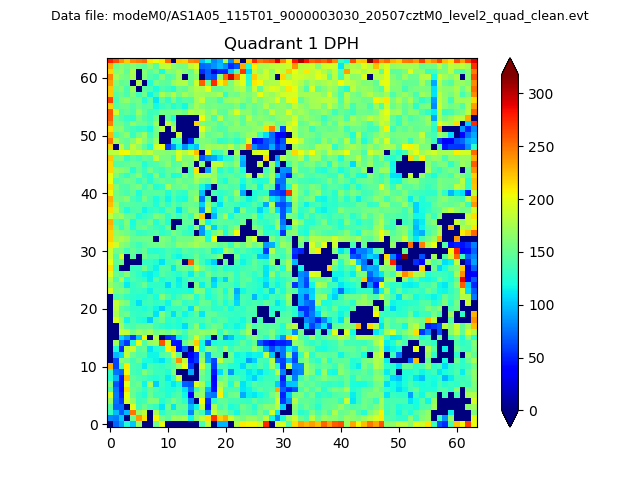 |
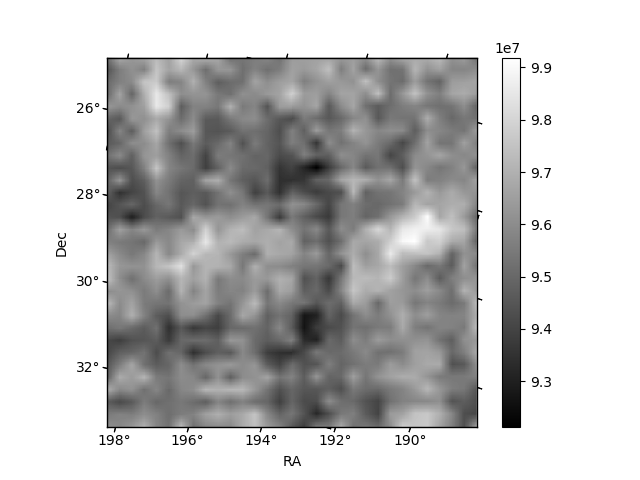
Quadrant B |
|---|---|---|---|
| Quadrant D | 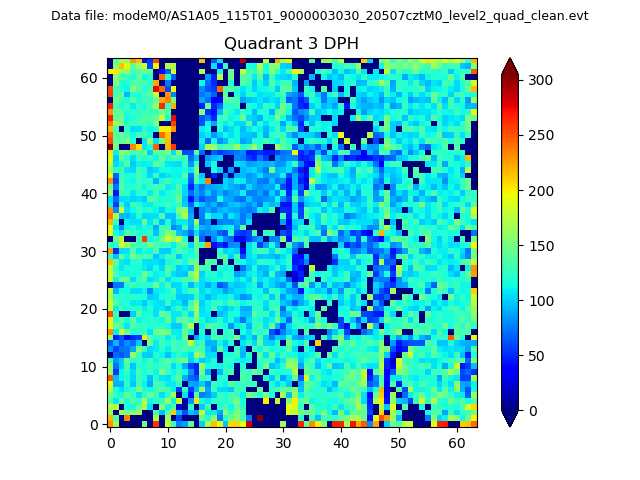 |
 |
Quadrant C |
| Plot type | Count rate plots | Images |
|---|---|---|
| Comparison with Poisson distribution Blue bars denote a histogram of data divided into 1 sec bins. Red curve is a Poisson curve with rate = median count rate of data. |
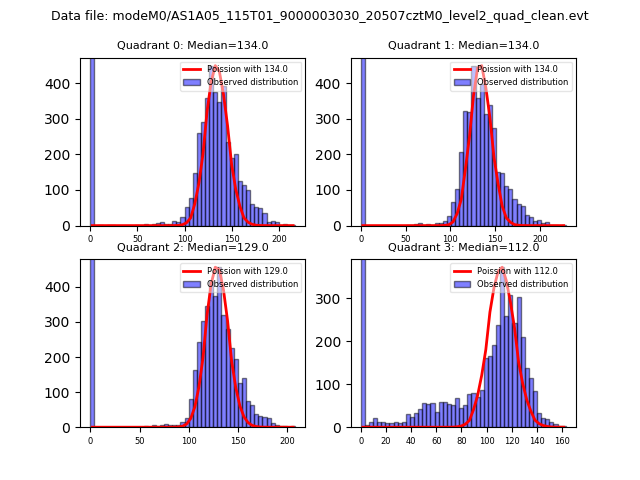 |
 |
| Quadrant-wise count rates Data is divided into 100 sec bins |
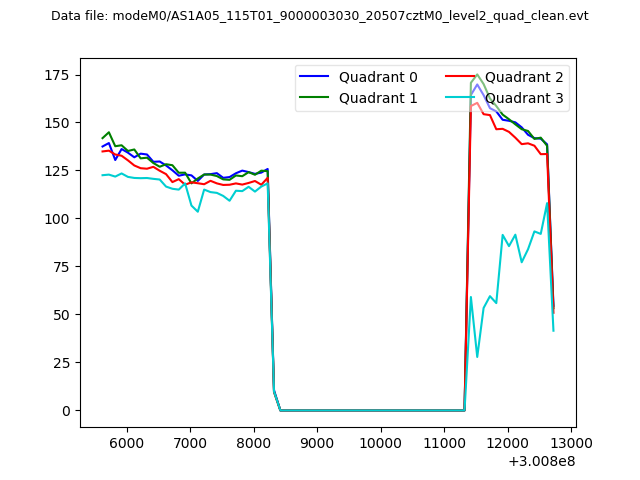 |
|
| Module-wise count rates for Quadrant A Data is divided into 100 sec bins |
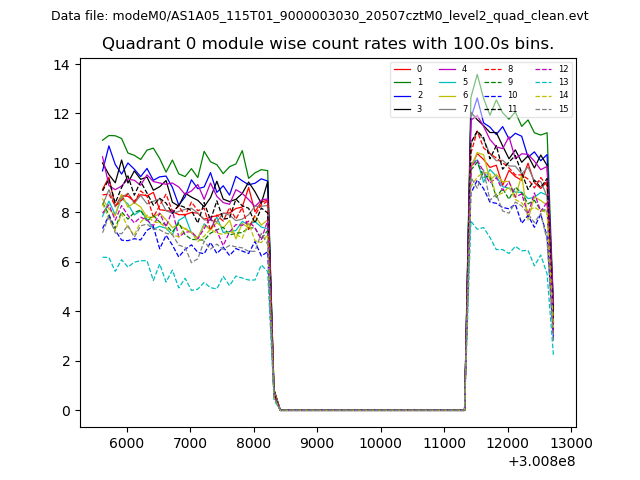 |
 |
| Module-wise count rates for Quadrant B Data is divided into 100 sec bins |
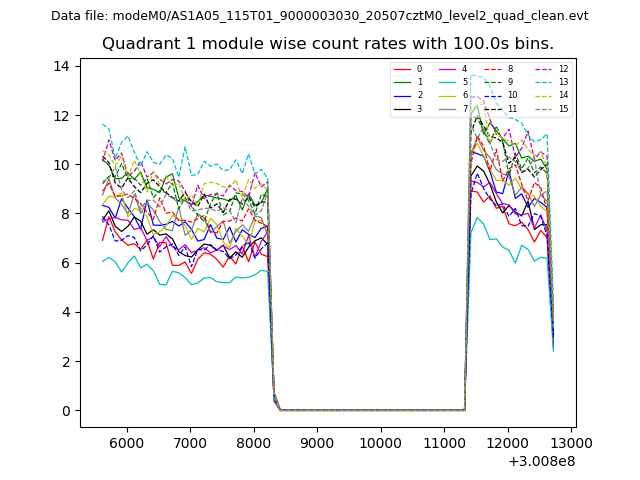 |
 |
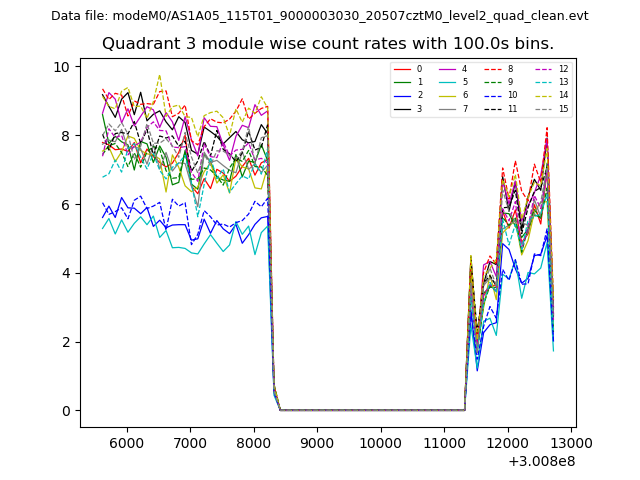
| Module-wise count rates for Quadrant C Data is divided into 100 sec bins |
 |
 |
| Module-wise count rates for Quadrant D Data is divided into 100 sec bins |
 |
 |
| Parameter | Plot |
|---|---|
| CZT HV Monitor | 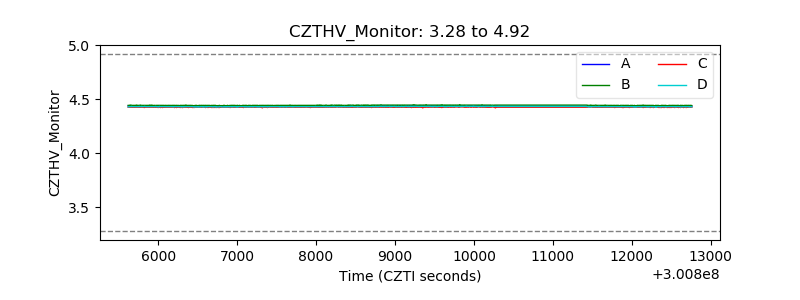 |
| D_VDD | 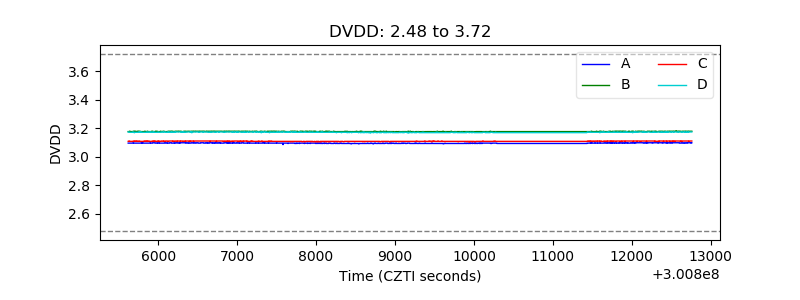 |
| Temperature 1 | 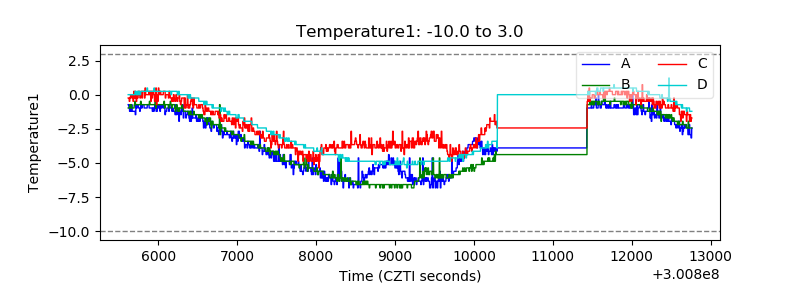 |
| Veto HV Monitor | 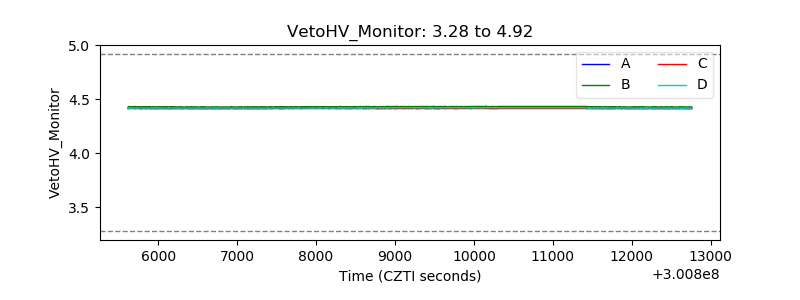 |
| Veto LLD | 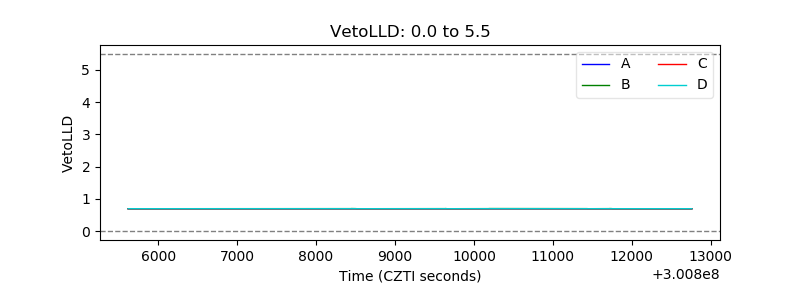 |
| Alpha Counter |  |
| _CPM_Rate | 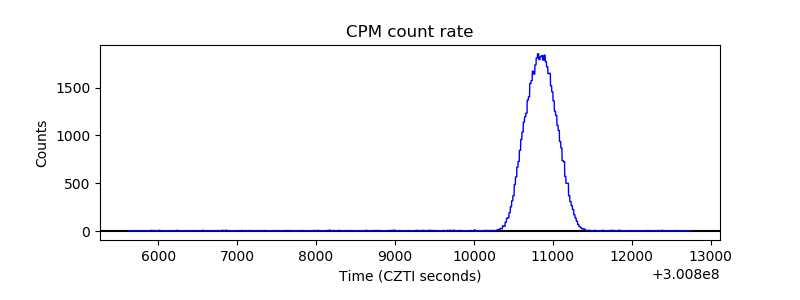 |
| CZT Counter | 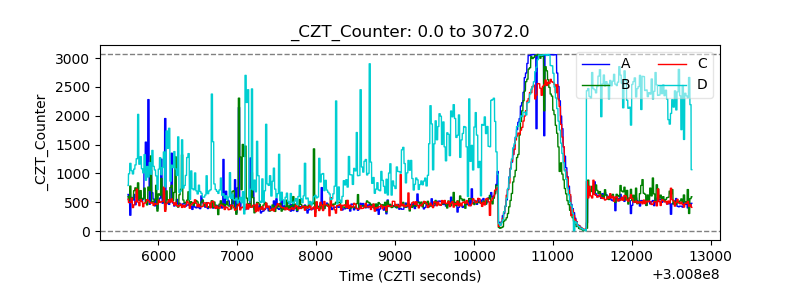 |
| +2.5 Volts monitor | 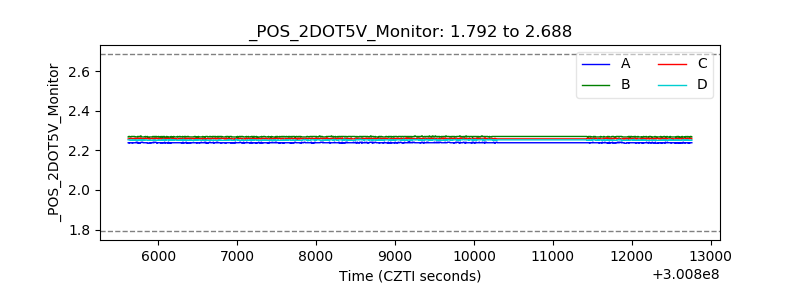 |
| +5 Volts monitor |  |
| _ROLL_ROT | 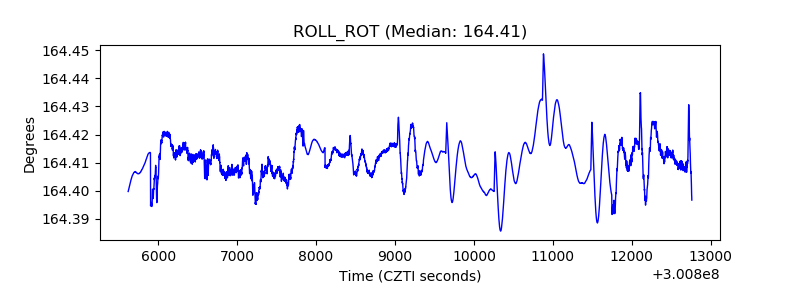 |
| _Roll_DEC | 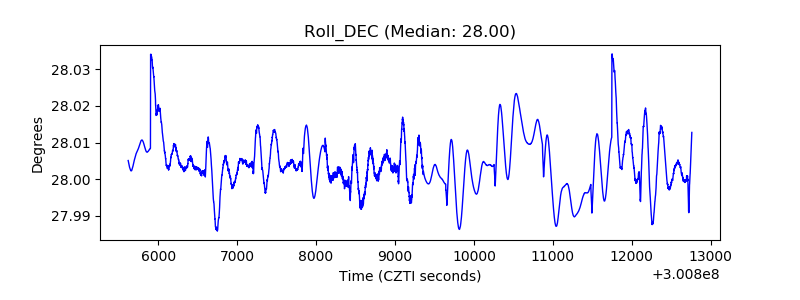 |
| _Roll_RA | 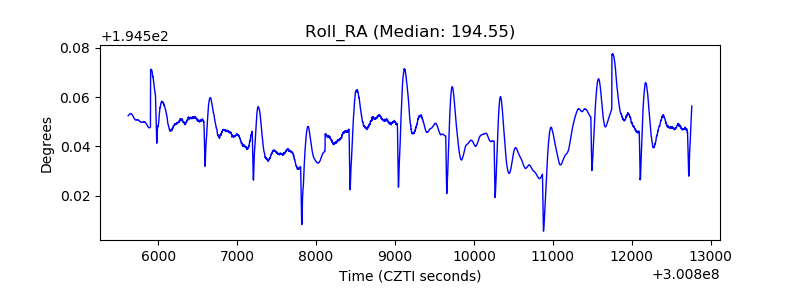 |
| Veto Counter | 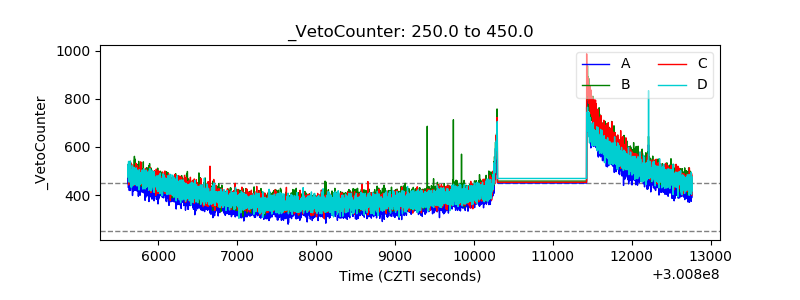 |