| Param | Original file | Final file |
|---|---|---|
| Filename | modeM0/AS1A05_115T01_9000003030_20508cztM0_level2.evt | modeM0/AS1A05_115T01_9000003030_20508cztM0_level2_quad_clean.evt |
| Size (bytes) | 604,281,600 | 81,668,160 |
| Size | 576.3 MB | 77.9 MB |
| Events in quadrant A | 2,954,495 | 555,911 |
| Events in quadrant B | 3,266,596 | 561,779 |
| Events in quadrant C | 2,938,212 | 533,844 |
| Events in quadrant D | 8,737,099 | 403,872 |
| Mode M9 | |||
|---|---|---|---|
| Quadrant | BADHDUFLAG | Total packets | Discarded packets |
| A | 0 | 12 | 0 |
| B | 0 | 12 | 0 |
| C | 0 | 12 | 0 |
| D | 0 | 12 | 0 |
| Mode SS | |||
|---|---|---|---|
| Quadrant | BADHDUFLAG | Total packets | Discarded packets |
| A | 0 | 122 | 0 |
| B | 0 | 122 | 0 |
| C | 0 | 122 | 0 |
| D | 0 | 122 | 0 |
| Mode M0 | |||
|---|---|---|---|
| Quadrant | BADHDUFLAG | Total packets | Discarded packets |
| A | 0 | 12646 | 1 |
| B | 0 | 13559 | 1 |
| C | 0 | 12555 | 2 |
| D | 0 | 29973 | 1 |
| Quadrant | Total seconds | Saturated seconds | Saturation percentage |
|---|---|---|---|
| A | 5963 | 27 | 0.452792% |
| B | 5964 | 33 | 0.553320% |
| C | 5963 | 58 | 0.972665% |
| D | 5963 | 2200 | 36.894181% |
Noise dominated data is calculated using 1-second bins in cleaned event files. If a bin has >2000 counts, and if more than 50% of those come from <1% of pixels, then it is considered to be noise-dominated and hence unusable.
| Quadrant | # 1 sec bins | Bins with >0 counts | Bins with >2000 counts | High rate bins dominated by noise | Noise dominated (total time) | Noise dominated (detector-on time) | Marked lightcurve |
|---|---|---|---|---|---|---|---|
| A | 7188 | 5964 | 2 | 2 | 0.03% | 0.03% | 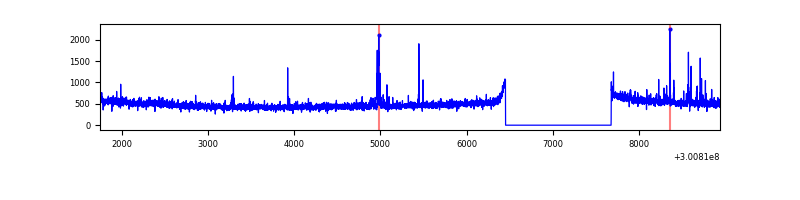 |
| B | 7189 | 5964 | 4 | 4 | 0.06% | 0.07% | 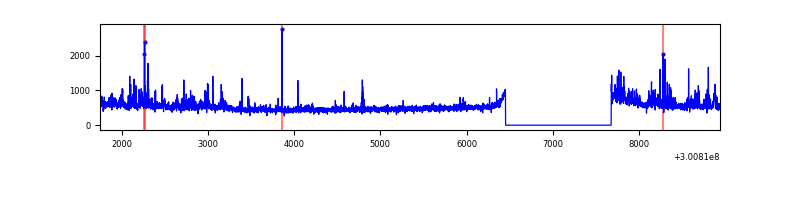 |
| C | 7188 | 5963 | 1 | 1 | 0.01% | 0.02% | 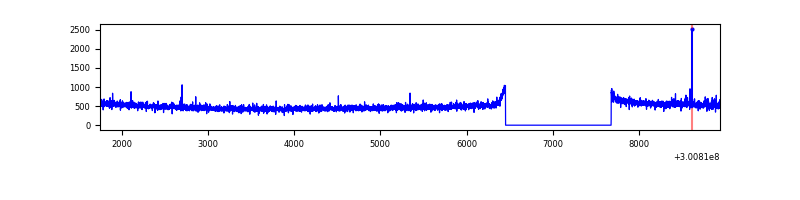 |
| D | 7188 | 5963 | 2335 | 2335 | 32.48% | 39.16% | 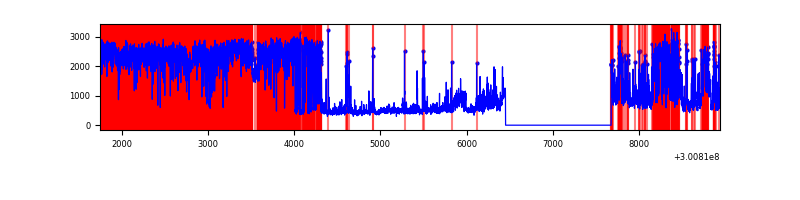 |
Top three noisy pixels from each quadrant. If the there are fewer than three noisy pixels in the level2.evt file, extra rows are filled as -1
| Pixel properties | Quadrant properties | ||||||
|---|---|---|---|---|---|---|---|
| Quadrant | DetID | PixID | Counts | Sigma | Mean | Median | Sigma |
| A | 5 | 16 | 36202 | 235.39 | 743 | 727 | 150.7 |
| A | 12 | 96 | 25919 | 167.16 | 743 | 727 | 150.7 |
| A | 12 | 16 | 13853 | 87.1 | 743 | 727 | 150.7 |
| B | 0 | 189 | 131145 | 937.23 | 745 | 727 | 139.2 |
| B | 0 | 219 | 72600 | 516.51 | 745 | 727 | 139.2 |
| B | 0 | 190 | 45905 | 324.67 | 745 | 727 | 139.2 |
| C | 14 | 238 | 112691 | 669.15 | 715 | 720 | 167.3 |
| C | 3 | 9 | 20820 | 120.12 | 715 | 720 | 167.3 |
| C | 3 | 233 | 8518 | 46.6 | 715 | 720 | 167.3 |
| D | 2 | 16 | 4607997 | 29356.97 | 643 | 623 | 156.9 |
| D | 5 | 222 | 426652 | 2714.54 | 643 | 623 | 156.9 |
| D | 7 | 238 | 297717 | 1893.0 | 643 | 623 | 156.9 |
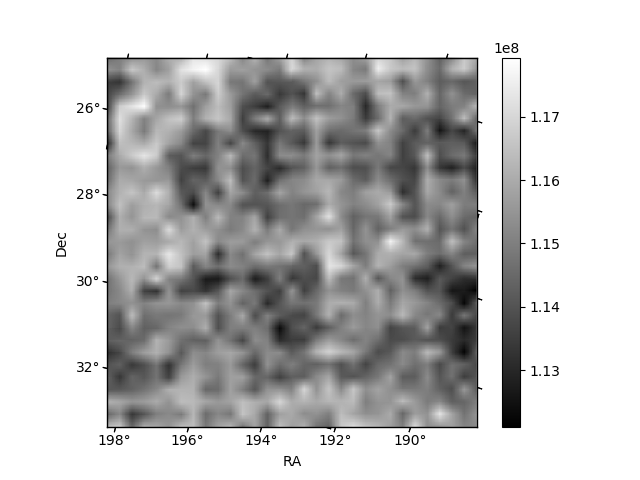
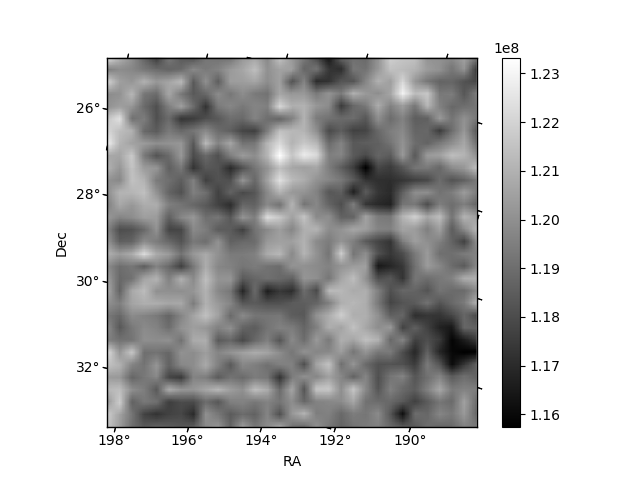
Histogram calculated using DETX and DETY for each event in the final _common_clean file
| Quadrant A | 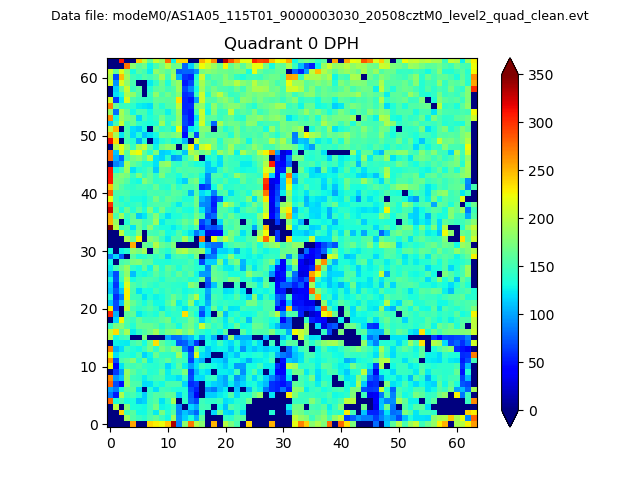 |
 |
Quadrant B |
|---|---|---|---|
| Quadrant D |  |
 |
Quadrant C |
| Plot type | Count rate plots | Images |
|---|---|---|
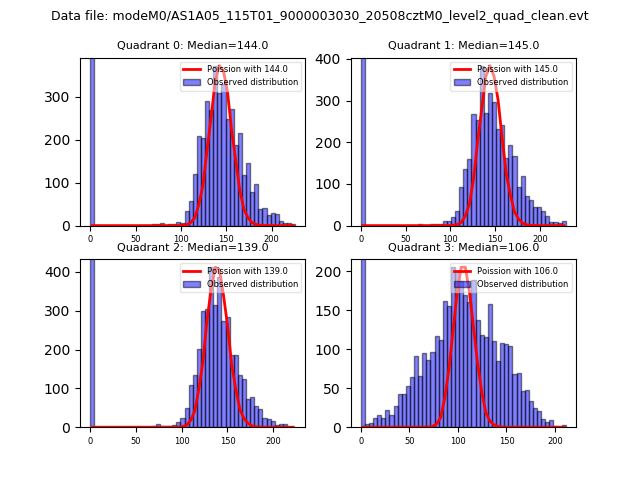
| Comparison with Poisson distribution Blue bars denote a histogram of data divided into 1 sec bins. Red curve is a Poisson curve with rate = median count rate of data. |
 |
 |
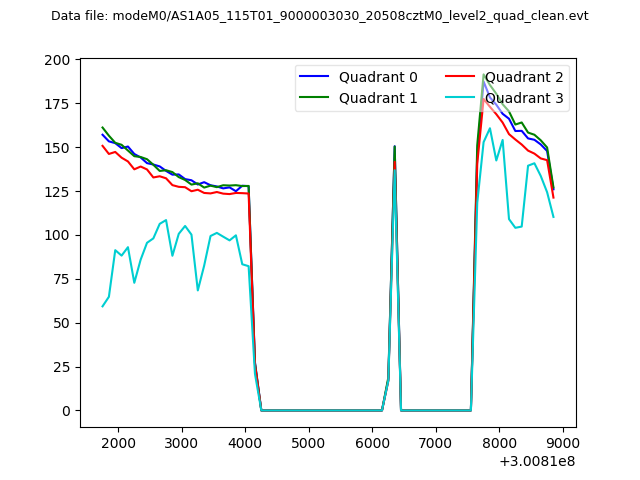
| Quadrant-wise count rates Data is divided into 100 sec bins |
 |
|
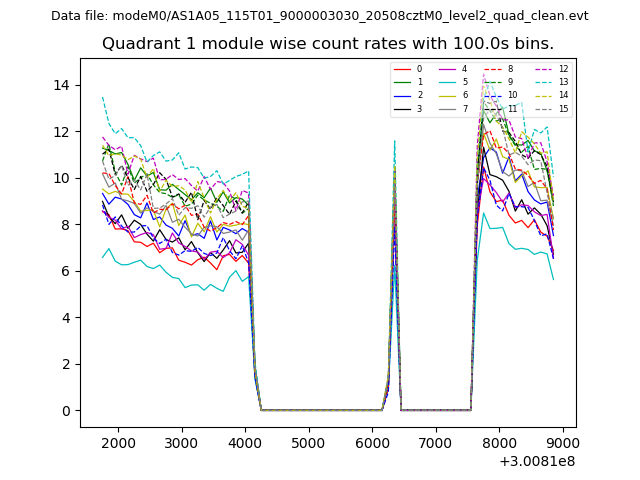
| Module-wise count rates for Quadrant A Data is divided into 100 sec bins |
 |
 |
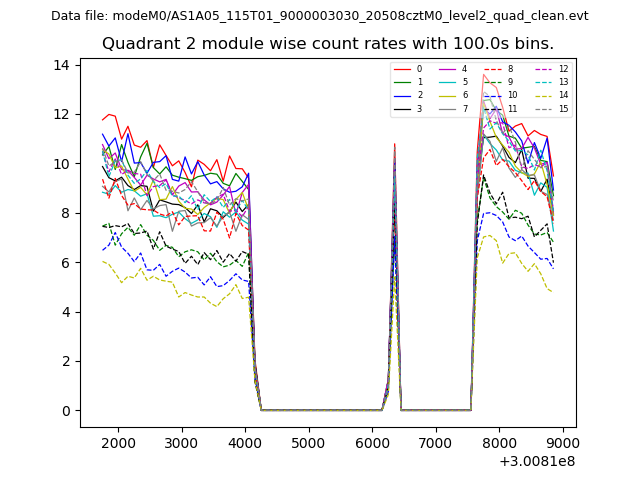
| Module-wise count rates for Quadrant B Data is divided into 100 sec bins |
 |
 |
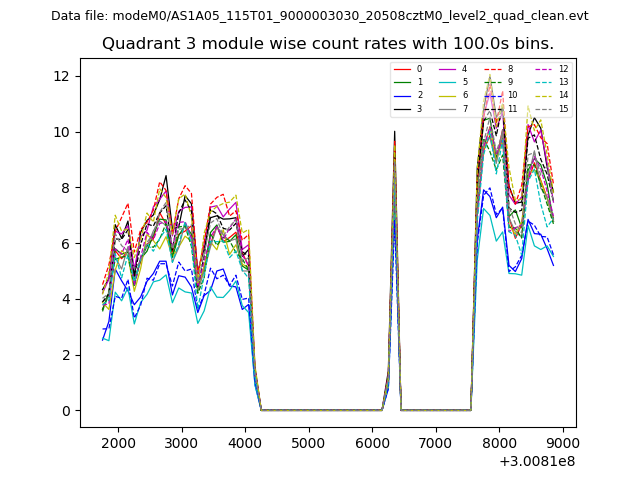
| Module-wise count rates for Quadrant C Data is divided into 100 sec bins |
 |
 |
| Module-wise count rates for Quadrant D Data is divided into 100 sec bins |
 |
 |
| Parameter | Plot |
|---|---|
| CZT HV Monitor |  |
| D_VDD | 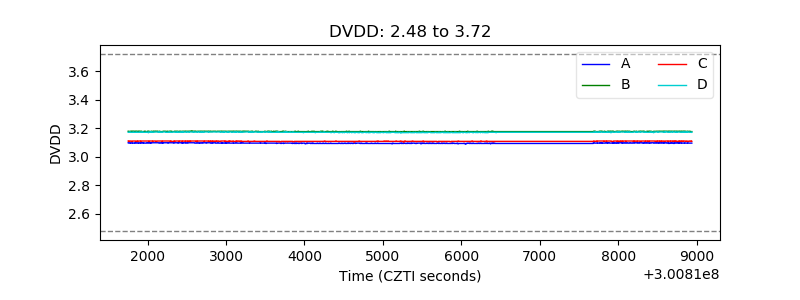 |
| Temperature 1 | 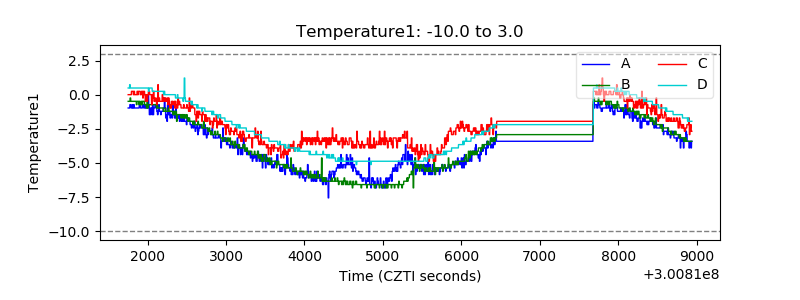 |
| Veto HV Monitor | 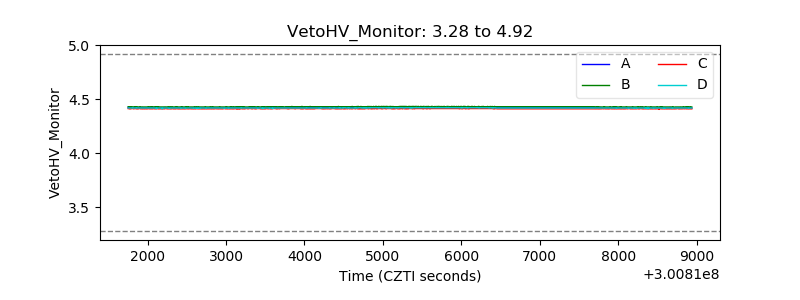 |
| Veto LLD | 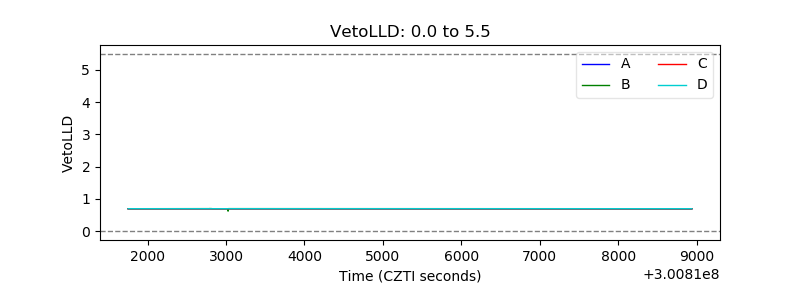 |
| Alpha Counter | 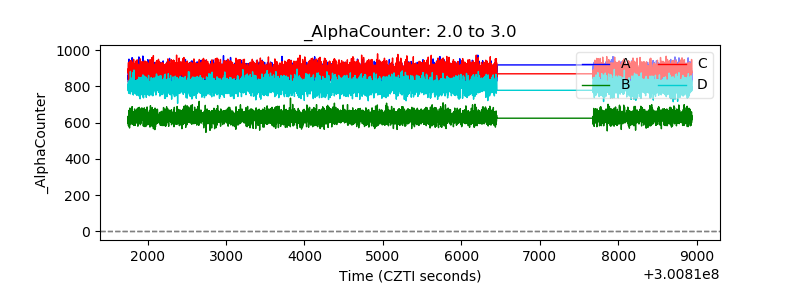 |
| _CPM_Rate | 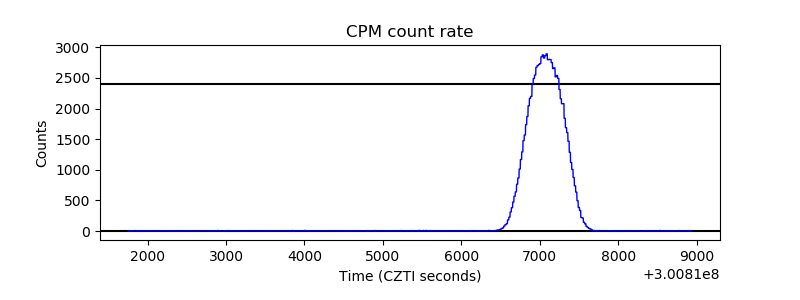 |
| CZT Counter | 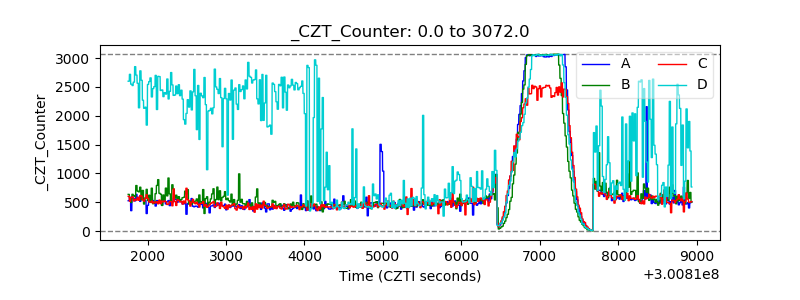 |
| +2.5 Volts monitor |  |
| +5 Volts monitor | 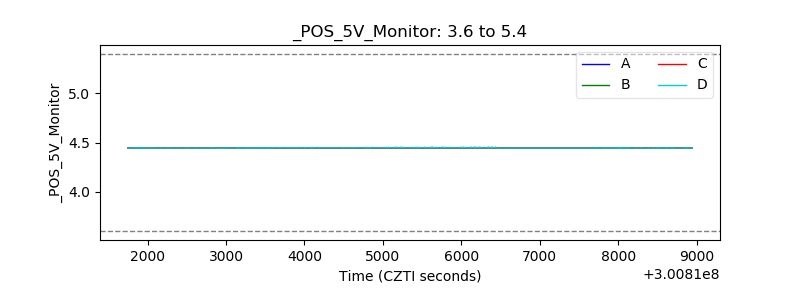 |
| _ROLL_ROT | 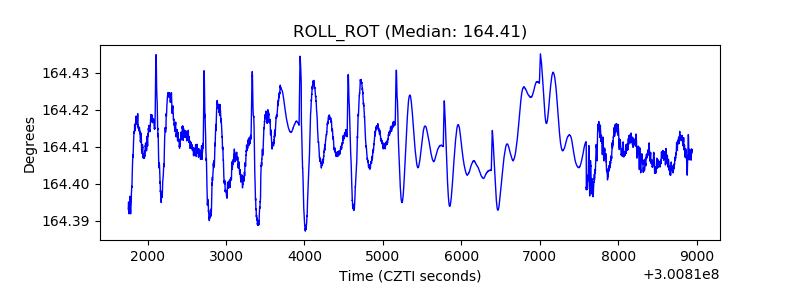 |
| _Roll_DEC | 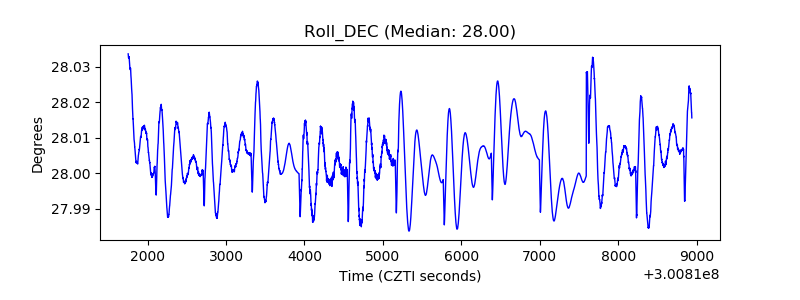 |
| _Roll_RA | 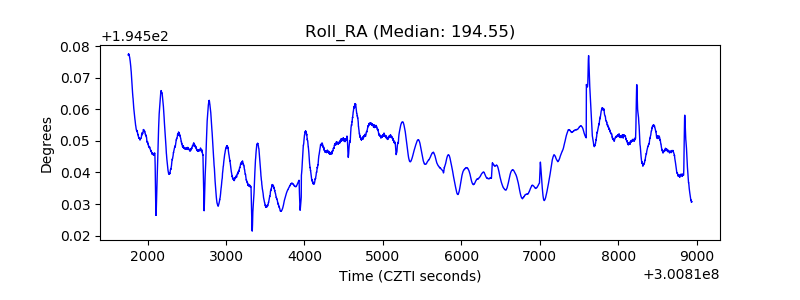 |
| Veto Counter | 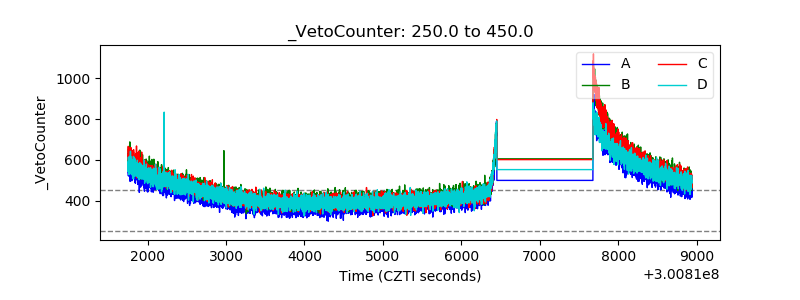 |