| Param | Original file | Final file |
|---|---|---|
| Filename | modeM0/AS1A05_115T01_9000003030_20509cztM0_level2.evt | modeM0/AS1A05_115T01_9000003030_20509cztM0_level2_quad_clean.evt |
| Size (bytes) | 510,923,520 | 90,250,560 |
| Size | 487.3 MB | 86.1 MB |
| Events in quadrant A | 3,294,480 | 598,343 |
| Events in quadrant B | 3,311,836 | 613,659 |
| Events in quadrant C | 3,071,394 | 575,823 |
| Events in quadrant D | 5,387,216 | 524,358 |
| Mode M9 | |||
|---|---|---|---|
| Quadrant | BADHDUFLAG | Total packets | Discarded packets |
| A | 0 | 13 | 0 |
| B | 0 | 13 | 0 |
| C | 0 | 13 | 0 |
| D | 0 | 13 | 0 |
| Mode SS | |||
|---|---|---|---|
| Quadrant | BADHDUFLAG | Total packets | Discarded packets |
| A | 0 | 124 | 0 |
| B | 0 | 124 | 0 |
| C | 0 | 124 | 0 |
| D | 0 | 124 | 0 |
| Mode M0 | |||
|---|---|---|---|
| Quadrant | BADHDUFLAG | Total packets | Discarded packets |
| A | 0 | 13606 | 1 |
| B | 0 | 13683 | 1 |
| C | 0 | 12886 | 1 |
| D | 0 | 20117 | 1 |
| Quadrant | Total seconds | Saturated seconds | Saturation percentage |
|---|---|---|---|
| A | 6019 | 60 | 0.996843% |
| B | 6020 | 37 | 0.614618% |
| C | 6019 | 38 | 0.631334% |
| D | 6019 | 410 | 6.811763% |
Noise dominated data is calculated using 1-second bins in cleaned event files. If a bin has >2000 counts, and if more than 50% of those come from <1% of pixels, then it is considered to be noise-dominated and hence unusable.
| Quadrant | # 1 sec bins | Bins with >0 counts | Bins with >2000 counts | High rate bins dominated by noise | Noise dominated (total time) | Noise dominated (detector-on time) | Marked lightcurve |
|---|---|---|---|---|---|---|---|
| A | 7354 | 6020 | 34 | 34 | 0.46% | 0.56% | 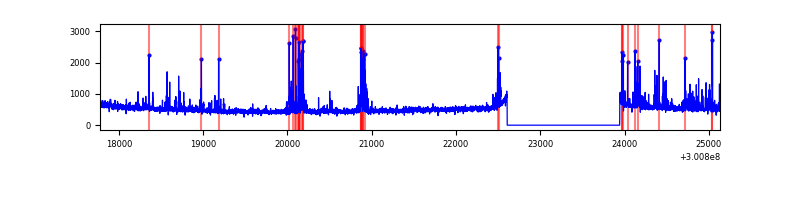 |
| B | 7355 | 6020 | 1 | 1 | 0.01% | 0.02% | 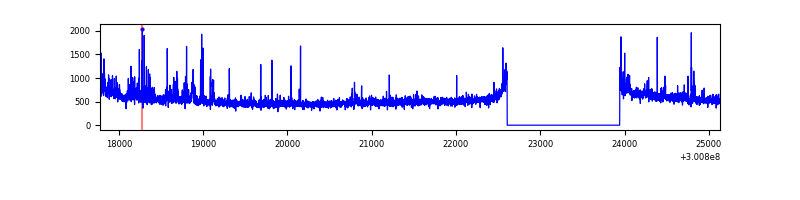 |
| C | 7354 | 6020 | 1 | 1 | 0.01% | 0.02% | 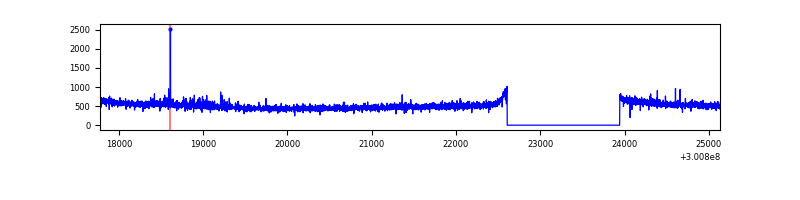 |
| D | 7354 | 6020 | 400 | 400 | 5.44% | 6.64% | 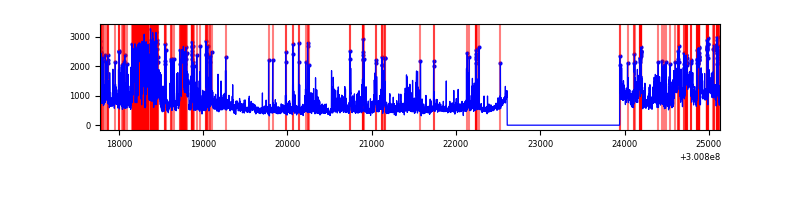 |
Top three noisy pixels from each quadrant. If the there are fewer than three noisy pixels in the level2.evt file, extra rows are filled as -1
| Pixel properties | Quadrant properties | ||||||
|---|---|---|---|---|---|---|---|
| Quadrant | DetID | PixID | Counts | Sigma | Mean | Median | Sigma |
| A | 5 | 16 | 177724 | 1136.86 | 773 | 758 | 155.7 |
| A | 12 | 96 | 138337 | 883.83 | 773 | 758 | 155.7 |
| A | 13 | 254 | 7421 | 42.8 | 773 | 758 | 155.7 |
| B | 0 | 189 | 122985 | 850.9 | 779 | 761 | 143.6 |
| B | 0 | 190 | 43838 | 299.89 | 779 | 761 | 143.6 |
| B | 0 | 219 | 39392 | 268.94 | 779 | 761 | 143.6 |
| C | 14 | 238 | 118182 | 677.03 | 744 | 751 | 173.5 |
| C | 3 | 9 | 33550 | 189.1 | 744 | 751 | 173.5 |
| C | 3 | 233 | 8821 | 46.53 | 744 | 751 | 173.5 |
| D | 7 | 38 | 533318 | 2994.87 | 730 | 709 | 177.8 |
| D | 2 | 16 | 521768 | 2929.92 | 730 | 709 | 177.8 |
| D | 1 | 52 | 479793 | 2693.9 | 730 | 709 | 177.8 |
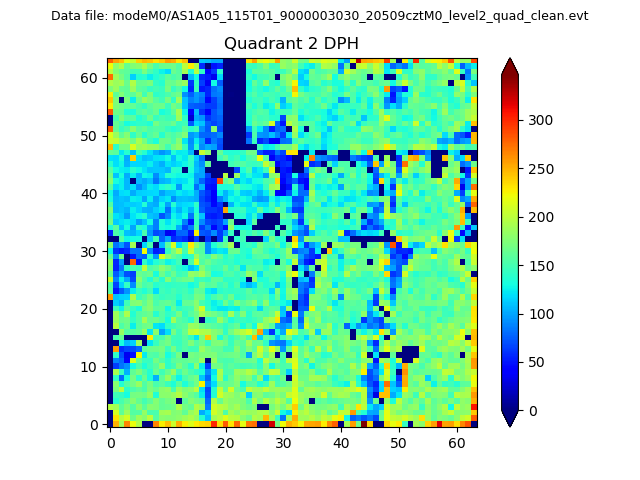
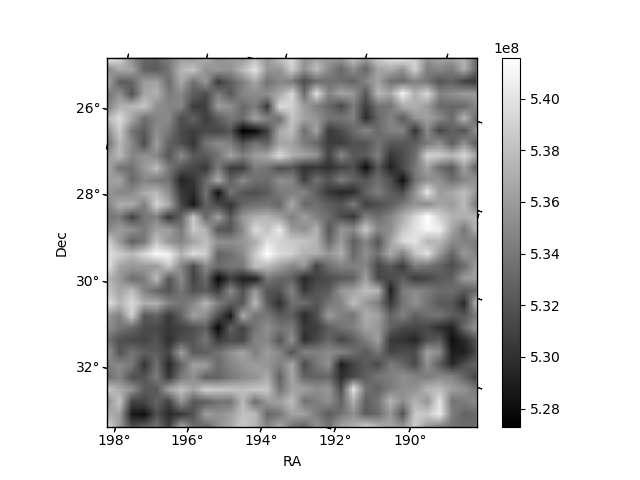
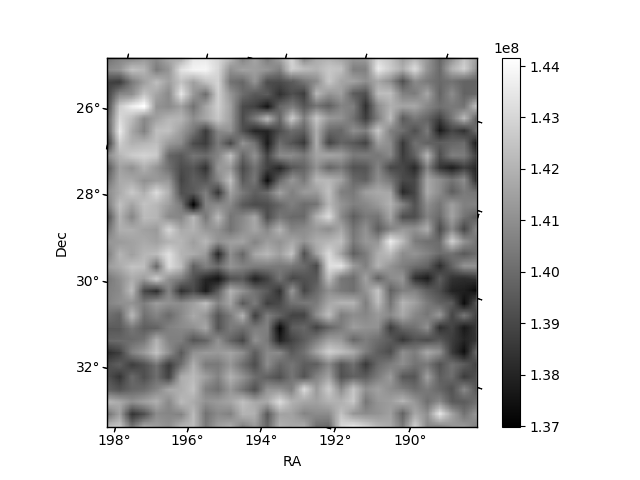
Histogram calculated using DETX and DETY for each event in the final _common_clean file
| Quadrant A | 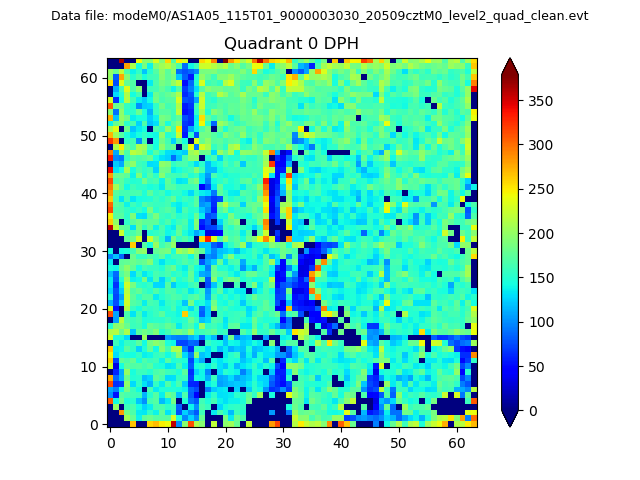 |
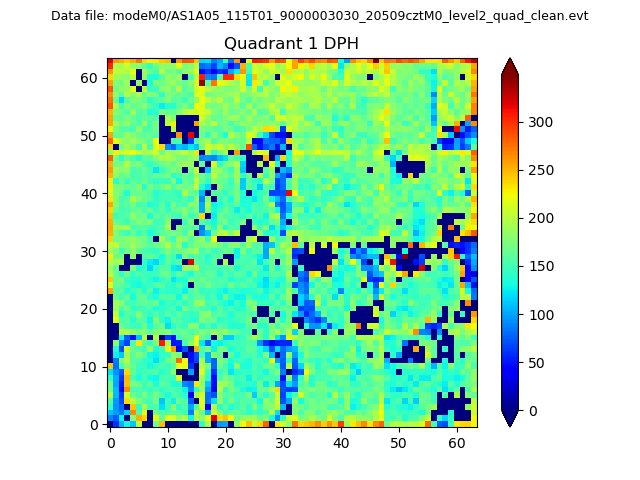 |
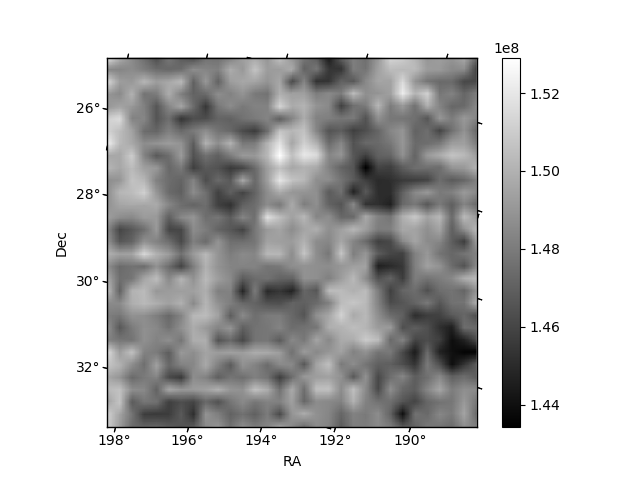
Quadrant B |
|---|---|---|---|
| Quadrant D | 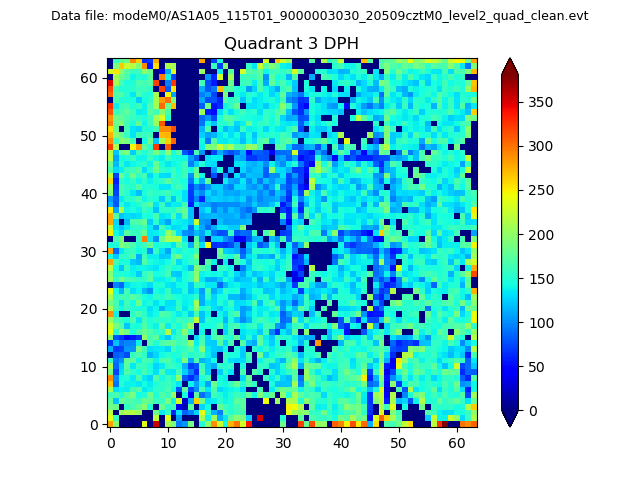 |
 |
Quadrant C |
| Plot type | Count rate plots | Images |
|---|---|---|
| Comparison with Poisson distribution Blue bars denote a histogram of data divided into 1 sec bins. Red curve is a Poisson curve with rate = median count rate of data. |
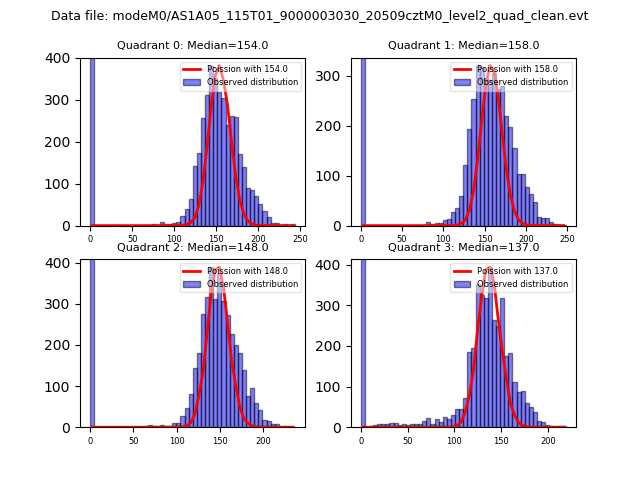 |
 |
| Quadrant-wise count rates Data is divided into 100 sec bins |
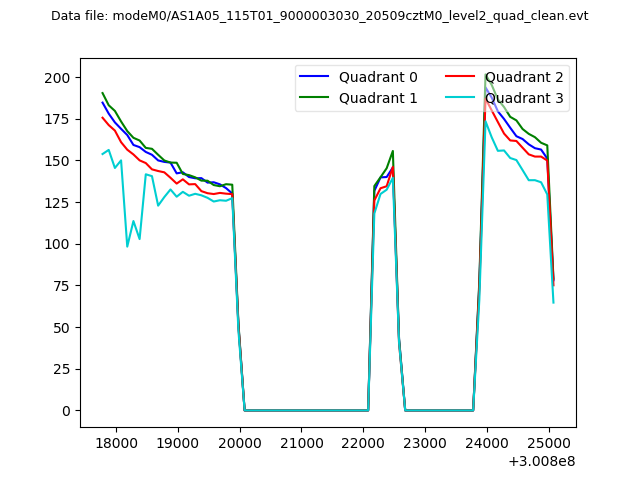 |
|
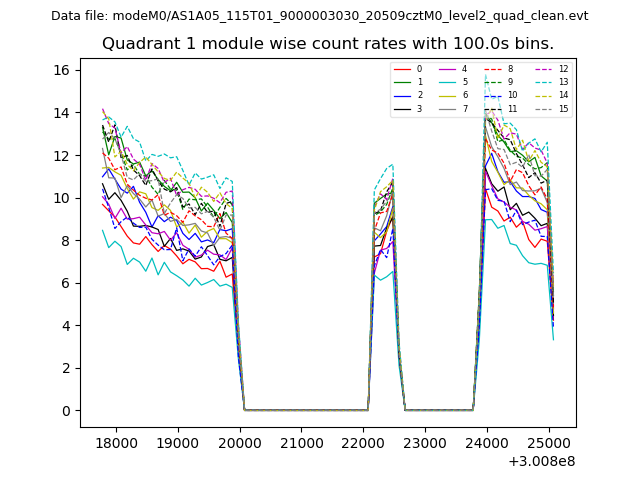
| Module-wise count rates for Quadrant A Data is divided into 100 sec bins |
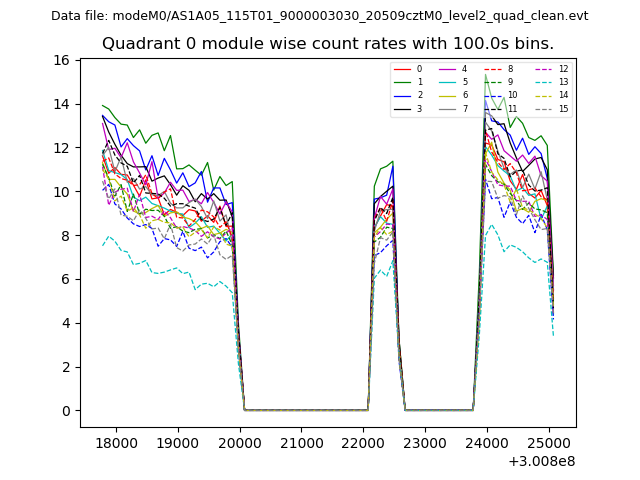 |
 |
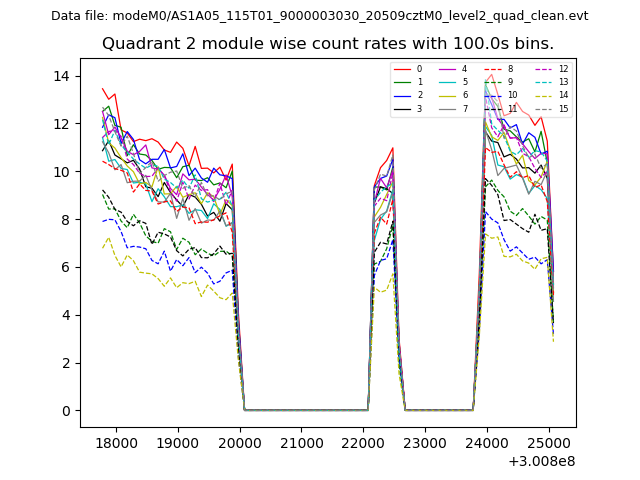
| Module-wise count rates for Quadrant B Data is divided into 100 sec bins |
 |
 |
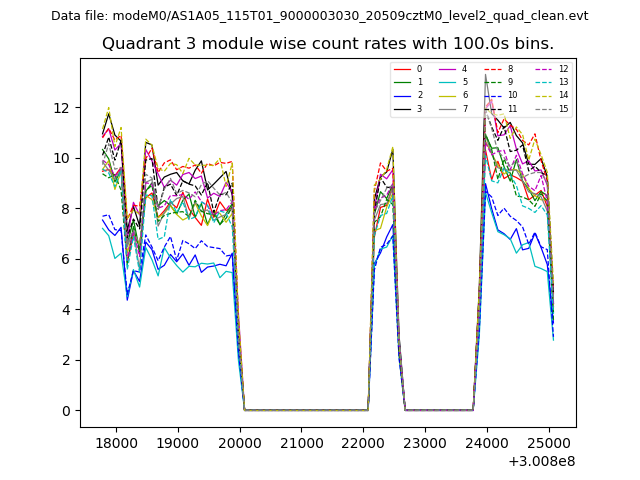
| Module-wise count rates for Quadrant C Data is divided into 100 sec bins |
 |
 |
| Module-wise count rates for Quadrant D Data is divided into 100 sec bins |
 |
 |
| Parameter | Plot |
|---|---|
| CZT HV Monitor |  |
| D_VDD | 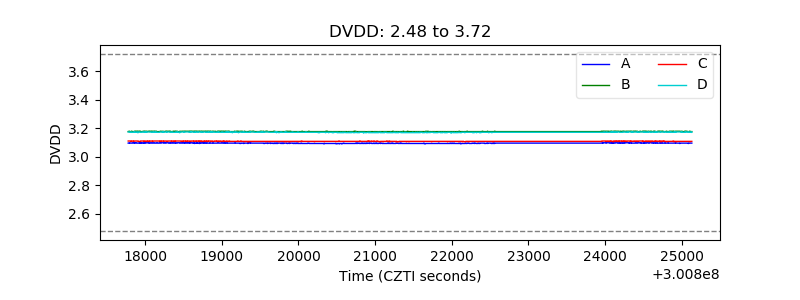 |
| Temperature 1 | 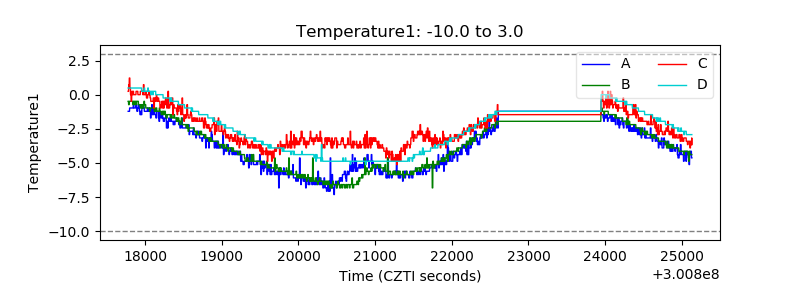 |
| Veto HV Monitor | 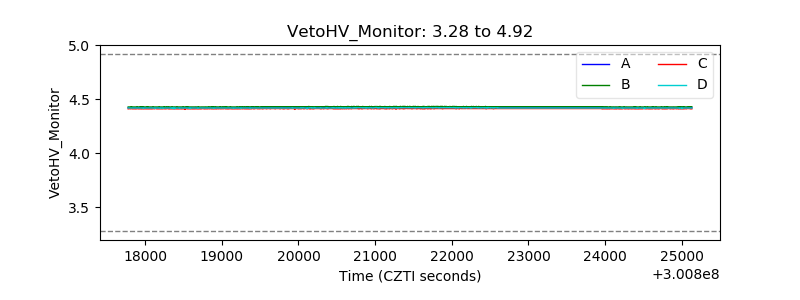 |
| Veto LLD | 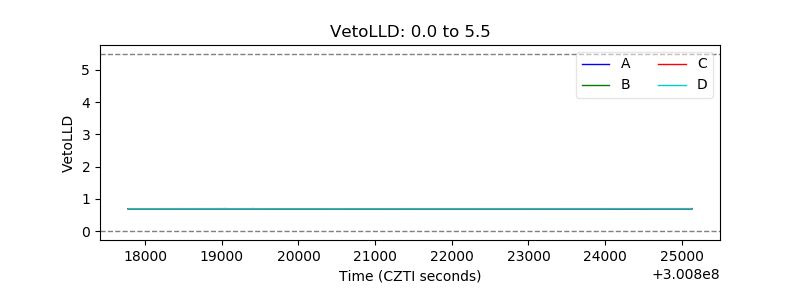 |
| Alpha Counter | 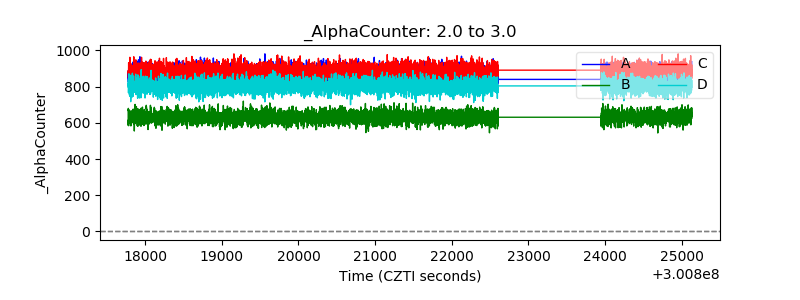 |
| _CPM_Rate | 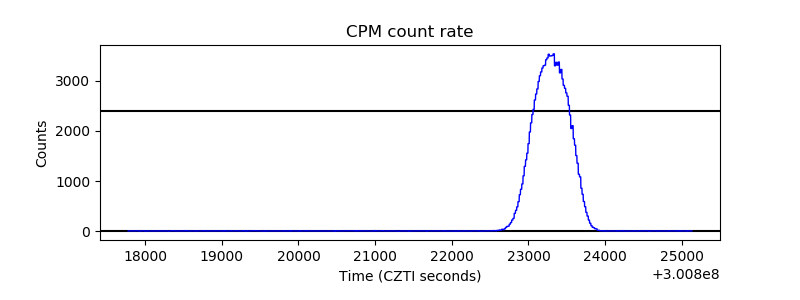 |
| CZT Counter | 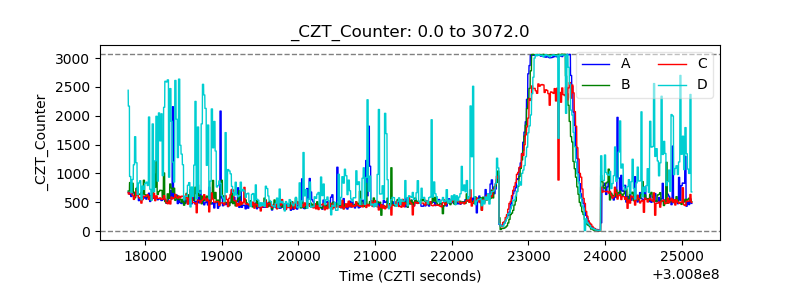 |
| +2.5 Volts monitor |  |
| +5 Volts monitor |  |
| _ROLL_ROT | 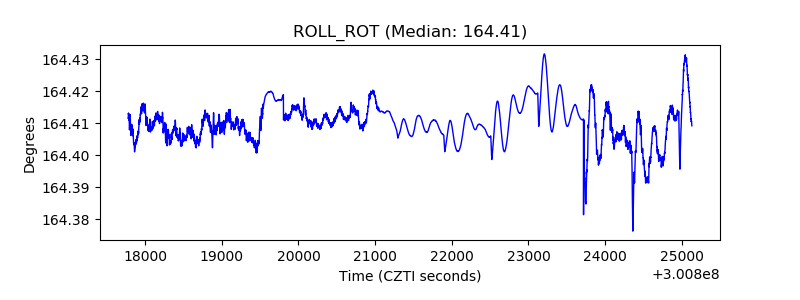 |
| _Roll_DEC | 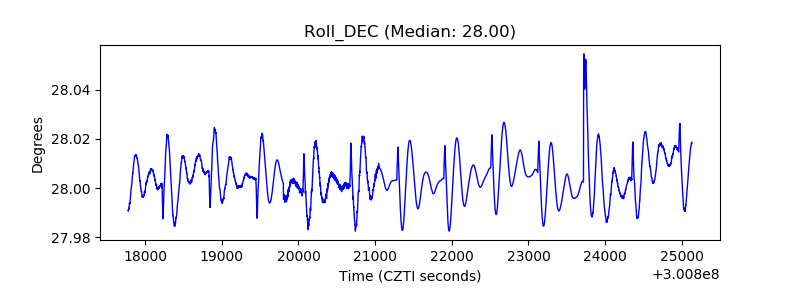 |
| _Roll_RA | 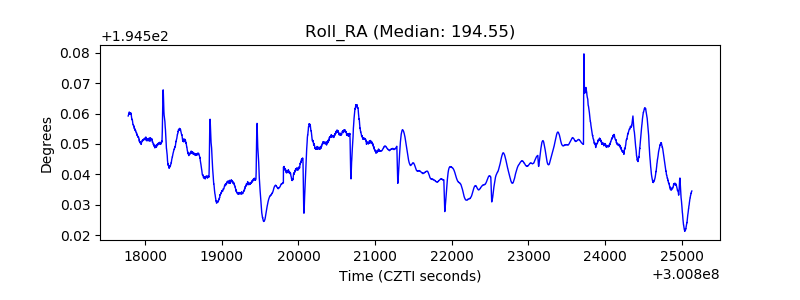 |
| Veto Counter | 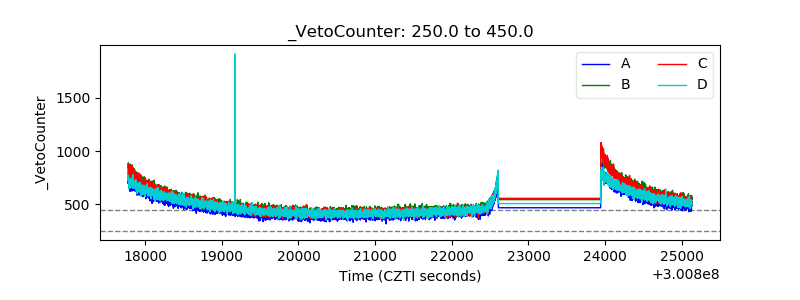 |